Marion County Investment Properties for Sale
Browse homes for sale and investment properties in Marion County. Refine your search by price, property type, or more.
Best cash flowing properties in Marion County

Active
$68,000
2
bds
|
1
ba
|
960
sqft
|
built
1949
3242 S Rybolt Ave, Indianapolis, IN 46221
$621
Cash flow
10.6%
Cash-on-Cash Return
11.0%
Cap rate
1.3%
Rent to Value Ratio
Active
$89,900
2
bds
|
1
ba
|
813
sqft
|
built
1948
2507 S Keystone Ave, Indianapolis, IN 46203
$505
Cash flow
29.3%
Cash-on-Cash Return
12.9%
Cap rate
1.6%
Rent to Value Ratio
1,846 out of 1,997 properties for sale in Marion County
Limited Results Shown
Create a free account, or log in to reveal all property listings and enjoy the complete experience.

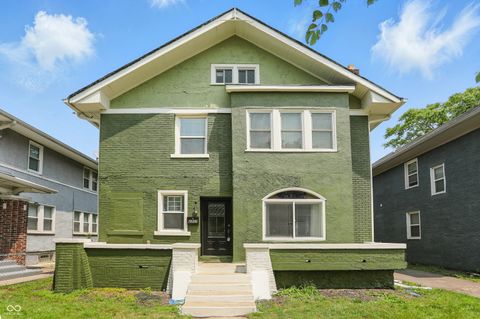
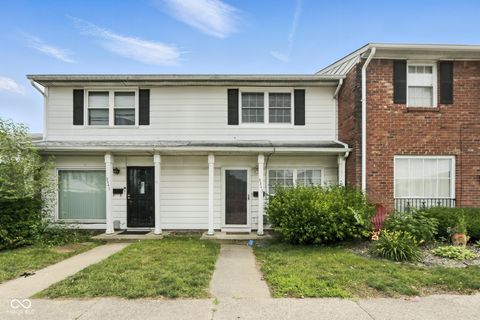
Active
$165,000
3
bds
|
1
ba
|
1,344
sqft
|
built
1920
638 W 30th St, Indianapolis, IN 46208
$243
Cash flow
7.7%
Cash-on-Cash Return
8.0%
Cap rate
1.0%
Rent to Value Ratio

Active
$300,000
3
bds
|
2
ba
|
1,638
sqft
|
built
2016
923 S State Ave, Indianapolis, IN 46203
$-324
Cash flow
-5.6%
Cash-on-Cash Return
5.0%
Cap rate
0.6%
Rent to Value Ratio

Active
$210,000
2
bds
|
2
ba
|
1,214
sqft
|
built
1981
7950 Eagle Valley Pass, Indianapolis, IN 46214
$-331
Cash flow
-8.2%
Cash-on-Cash Return
4.4%
Cap rate
0.7%
Rent to Value Ratio
Active
$164,900
3
bds
|
1
ba
|
1,036
sqft
|
built
1972
1170 N Concord St, Indianapolis, IN 46222
$105
Cash flow
3.3%
Cash-on-Cash Return
7.0%
Cap rate
0.8%
Rent to Value Ratio
Active
$174,000
3
bds
|
2
ba
|
1,456
sqft
|
built
1961
1749 N Graham Ave, Indianapolis, IN 46218
$196
Cash flow
5.9%
Cash-on-Cash Return
7.6%
Cap rate
0.9%
Rent to Value Ratio

Active
$514,900
7
bds
|
5
ba
|
6,219
sqft
|
built
1996
7138 Nile Ridge Ct, Indianapolis, IN 46236
$-348
Cash flow
-3.5%
Cash-on-Cash Return
5.5%
Cap rate
0.7%
Rent to Value Ratio

Active
$254,000
4
bds
|
2
ba
|
2,441
sqft
|
built
1948
541 Dayton Ave, Indianapolis, IN 46203
$-84
Cash flow
-1.7%
Cash-on-Cash Return
5.9%
Cap rate
0.7%
Rent to Value Ratio

Active
$139,500
1
bds
|
1
ba
|
1,000
sqft
|
built
1968
4000 N Meridian St, Indianapolis, IN 46208
$-383
Cash flow
-14.3%
Cash-on-Cash Return
3.0%
Cap rate
1.2%
Rent to Value Ratio
Active
$219,900
2
bds
|
2
ba
|
1,216
sqft
|
built
1955
1814 New St, Indianapolis, IN 46203
$94
Cash flow
2.2%
Cash-on-Cash Return
6.8%
Cap rate
0.8%
Rent to Value Ratio

Active
$250,000
1
bds
|
0
ba
|
0
sqft
|
built
1929
1538 N Grant Ave, Indianapolis, IN 46201
$-822
Cash flow
-17.2%
Cash-on-Cash Return
2.3%
Cap rate
0.3%
Rent to Value Ratio
Active
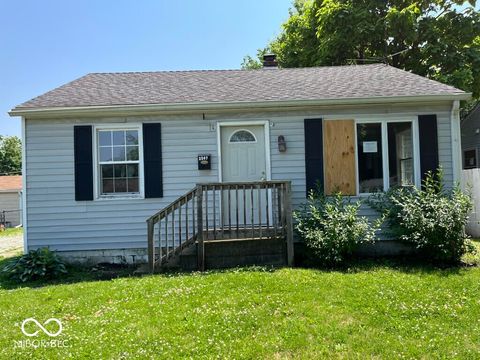
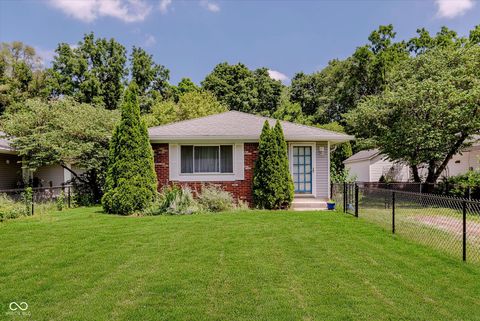
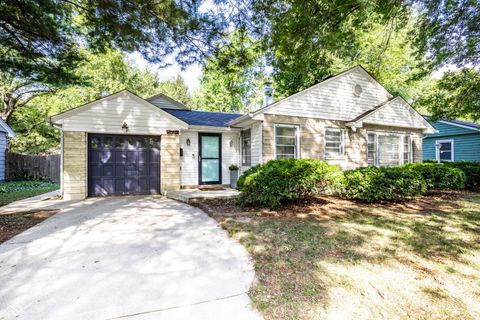
$159,900
3
bds
|
2
ba
|
960
sqft
|
built
1947
1707 N Leland Ave, Indianapolis, IN 46218
$269
Cash flow
8.8%
Cash-on-Cash Return
8.3%
Cap rate
1.0%
Rent to Value Ratio

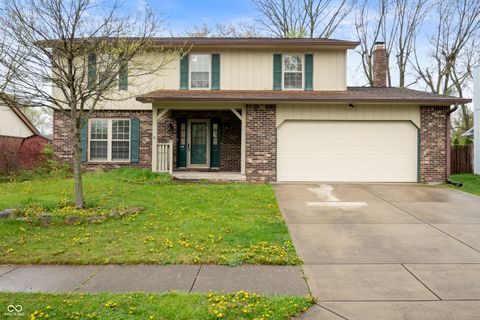
Active
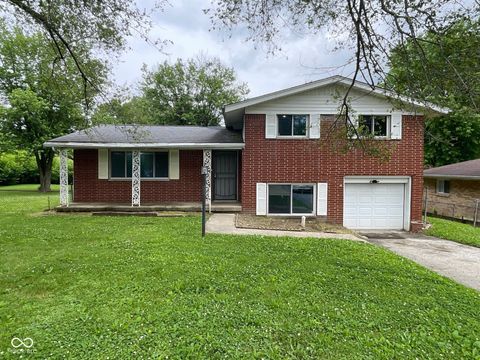
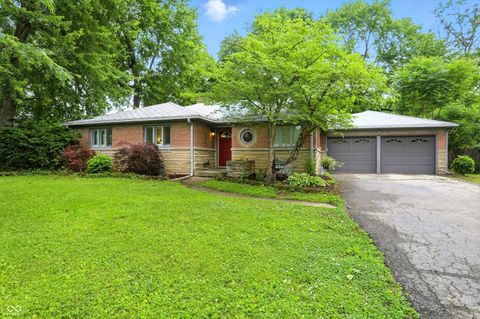
$164,900
3
bds
|
2
ba
|
1,995
sqft
|
built
1960
3570 Decamp Dr, Indianapolis, IN 46226
$381
Cash flow
12.1%
Cash-on-Cash Return
9.0%
Cap rate
1.1%
Rent to Value Ratio

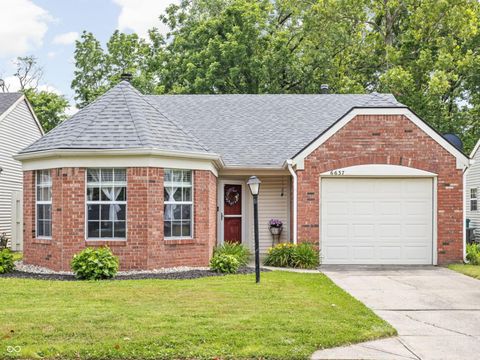
Active
$239,900
3
bds
|
3
ba
|
1,677
sqft
|
built
2002
6637 Larkwood Ct, Indianapolis, IN 46241
$-37
Cash flow
-0.8%
Cash-on-Cash Return
6.1%
Cap rate
0.8%
Rent to Value Ratio
Active
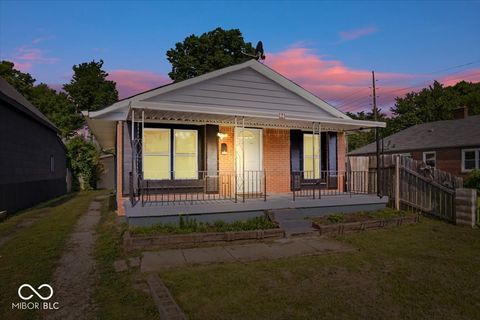
$124,000
3
bds
|
1
ba
|
840
sqft
|
built
1920
3142 N Euclid Ave, Indianapolis, IN 46218
$112
Cash flow
4.7%
Cash-on-Cash Return
7.3%
Cap rate
0.9%
Rent to Value Ratio
Active
$225,000
4
bds
|
1
ba
|
1,809
sqft
|
built
1910
2534 Carrollton Ave, Indianapolis, IN 46205
$-209
Cash flow
-4.8%
Cash-on-Cash Return
5.2%
Cap rate
0.6%
Rent to Value Ratio

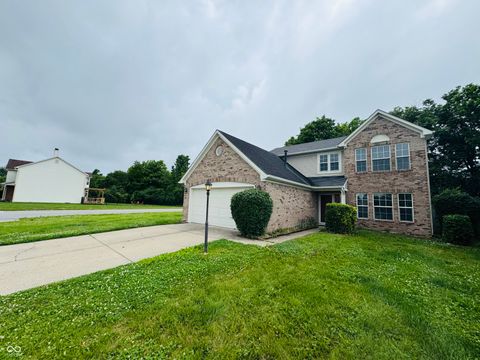
Active
$215,000
3
bds
|
2
ba
|
1,176
sqft
|
built
1999
10922 Snowdrop Way, Indianapolis, IN 46235
$91
Cash flow
2.2%
Cash-on-Cash Return
6.8%
Cap rate
0.8%
Rent to Value Ratio

Active
$165,000
3
bds
|
1
ba
|
1,528
sqft
|
built
1956
4025 Campbell Ave, Indianapolis, IN 46226
$36
Cash flow
1.1%
Cash-on-Cash Return
6.5%
Cap rate
0.8%
Rent to Value Ratio
Active
$250,000
3
bds
|
2
ba
|
1,224
sqft
|
built
1957
45 Kirk Dr E, Indianapolis, IN 46234
$-108
Cash flow
-2.3%
Cash-on-Cash Return
5.6%
Cap rate
0.7%
Rent to Value Ratio
Active
$172,500
3
bds
|
1
ba
|
1,080
sqft
|
built
1970
4218 E 18th St, Indianapolis, IN 46218
$82
Cash flow
2.5%
Cash-on-Cash Return
6.7%
Cap rate
0.8%
Rent to Value Ratio
Active
$339,900
3
bds
|
3
ba
|
2,544
sqft
|
built
1921
3307 N College Ave, Indianapolis, IN 46205
$-499
Cash flow
-7.7%
Cash-on-Cash Return
4.4%
Cap rate
0.5%
Rent to Value Ratio
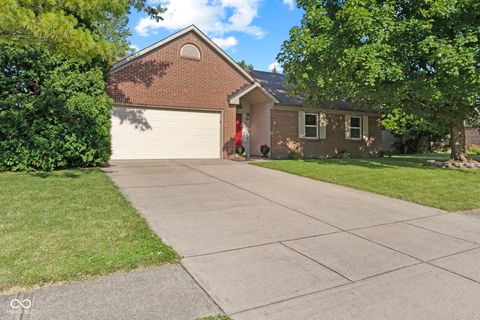
Active
$325,000
4
bds
|
3
ba
|
2,622
sqft
|
built
1983
8306 Corkwood Dr, Indianapolis, IN 46227
$-147
Cash flow
-2.4%
Cash-on-Cash Return
5.6%
Cap rate
0.7%
Rent to Value Ratio
Active
$299,900
3
bds
|
3
ba
|
1,816
sqft
|
built
1997
5938 Tybalt Ln, Indianapolis, IN 46254
$-156
Cash flow
-2.7%
Cash-on-Cash Return
5.5%
Cap rate
0.7%
Rent to Value Ratio
Active
$265,000
3
bds
|
2
ba
|
1,543
sqft
|
built
1956
4340 Ashbourne Ln, Indianapolis, IN 46226
$23
Cash flow
0.5%
Cash-on-Cash Return
6.2%
Cap rate
0.8%
Rent to Value Ratio
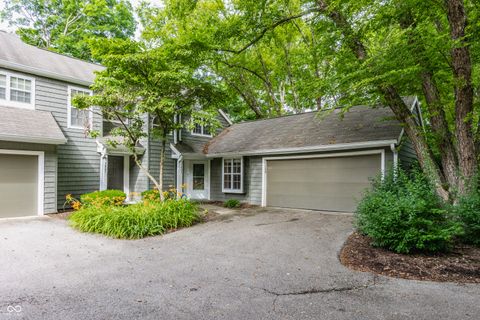
Active
$239,900
3
bds
|
2
ba
|
1,230
sqft
|
built
1988
6637 Sundown Dr S, Indianapolis, IN 46254
$-8
Cash flow
-0.2%
Cash-on-Cash Return
6.1%
Cap rate
0.8%
Rent to Value Ratio
Active
$280,000
2
bds
|
2
ba
|
1,290
sqft
|
built
1984
7803 Harbour Isle, Indianapolis, IN 46240
$-216
Cash flow
-4.0%
Cash-on-Cash Return
5.2%
Cap rate
0.8%
Rent to Value Ratio
Active
$89,999
2
bds
|
2
ba
|
992
sqft
|
built
1964
3343 Ashley Ln, Indianapolis, IN 46224
$269
Cash flow
15.6%
Cash-on-Cash Return
9.7%
Cap rate
1.2%
Rent to Value Ratio
Active
$200,000
3
bds
|
2
ba
|
1,093
sqft
|
built
1960
8136 E 37th Pl, Indianapolis, IN 46226
$11
Cash flow
0.3%
Cash-on-Cash Return
6.2%
Cap rate
0.8%
Rent to Value Ratio
Active
$280,000
3
bds
|
2
ba
|
1,550
sqft
|
built
1978
610 Front Royal Dr, Indianapolis, IN 46227
$-192
Cash flow
-3.6%
Cash-on-Cash Return
5.3%
Cap rate
0.6%
Rent to Value Ratio
Active
$294,900
3
bds
|
2
ba
|
2,118
sqft
|
built
1950
508 W 38th St, Indianapolis, IN 46208
$-269
Cash flow
-4.8%
Cash-on-Cash Return
5.1%
Cap rate
0.6%
Rent to Value Ratio
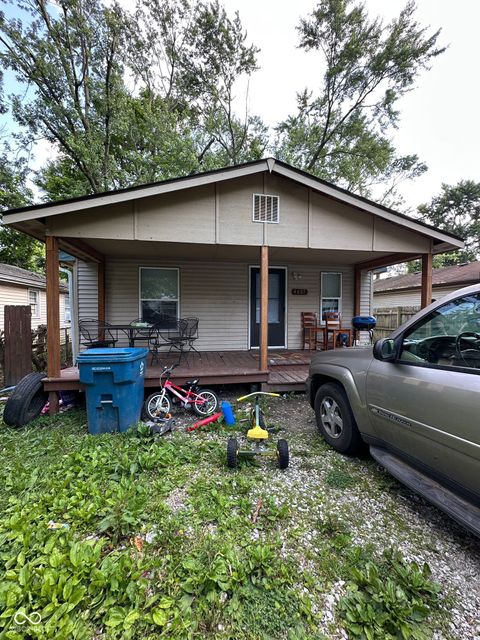
Active
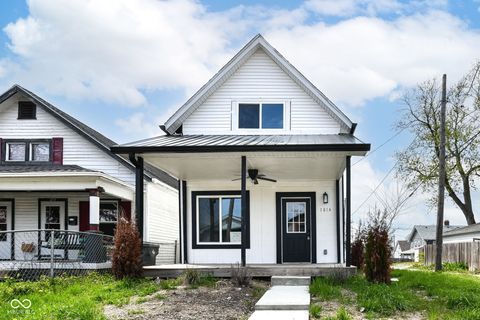
$125,000
2
bds
|
2
ba
|
1,162
sqft
|
built
1920
1938 N Dearborn St, Indianapolis, IN 46218
$326
Cash flow
13.6%
Cash-on-Cash Return
9.3%
Cap rate
1.1%
Rent to Value Ratio
Active
$245,000
3
bds
|
1
ba
|
1,584
sqft
|
built
1926
113 N Munsie St, Indianapolis, IN 46229
$-289
Cash flow
-6.2%
Cash-on-Cash Return
4.7%
Cap rate
0.6%
Rent to Value Ratio
Active
$259,900
4
bds
|
2
ba
|
1,464
sqft
|
built
1973
8920 Caminito Rd, Indianapolis, IN 46234
$-20
Cash flow
-0.4%
Cash-on-Cash Return
6.1%
Cap rate
0.7%
Rent to Value Ratio
Active
$334,900
4
bds
|
3
ba
|
1,878
sqft
|
built
1960
1605 Westlane Rd, Indianapolis, IN 46260
$-336
Cash flow
-5.2%
Cash-on-Cash Return
4.9%
Cap rate
0.6%
Rent to Value Ratio
Active
$325,000
2
bds
|
1
ba
|
756
sqft
|
built
1986
2021 Columbia Ave, Indianapolis, IN 46202
$-561
Cash flow
-9.0%
Cash-on-Cash Return
4.1%
Cap rate
0.5%
Rent to Value Ratio
Active
$340,000
2
bds
|
2
ba
|
1,482
sqft
|
built
1950
5736 Primrose Ave, Indianapolis, IN 46220
$-155
Cash flow
-2.4%
Cash-on-Cash Return
5.6%
Cap rate
0.7%
Rent to Value Ratio
Active
$150,000
3
bds
|
1
ba
|
1,056
sqft
|
built
1951
4607 Melrose Ave, Indianapolis, IN 46241
$-9
Cash flow
-0.3%
Cash-on-Cash Return
6.1%
Cap rate
0.7%
Rent to Value Ratio
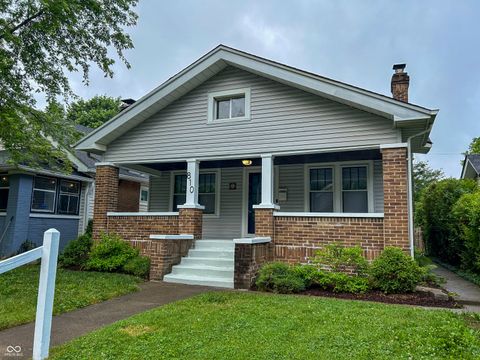
Active
$209,000
2
bds
|
1
ba
|
1,092
sqft
|
built
1922
810 N Bosart Ave, Indianapolis, IN 46201
$-105
Cash flow
-2.6%
Cash-on-Cash Return
5.5%
Cap rate
0.7%
Rent to Value Ratio
Active
$285,000
3
bds
|
2
ba
|
1,364
sqft
|
built
1991
7239 N Orchard Dr, Indianapolis, IN 46236
$-80
Cash flow
-1.5%
Cash-on-Cash Return
5.8%
Cap rate
0.7%
Rent to Value Ratio