Jackson, MS Investment Properties for Sale
Browse homes for sale and investment properties in Jackson, MS. Refine your search by price, property type, or more.
Best cash flowing properties in Jackson, MS

Active
$69,900
3
bds
|
2
ba
|
0
sqft
|
built
1957
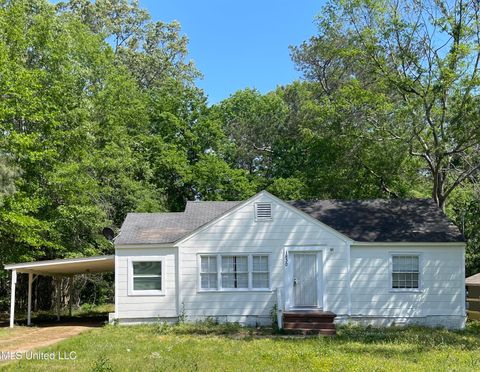
3171 Bilgray Dr, Jackson, MS 39212
$907
Cash flow
15.1%
Cash-on-Cash Return
15.6%
Cap rate
2.0%
Rent to Value Ratio
Active
$59,900
3
bds
|
2
ba
|
0
sqft
|
built
1968
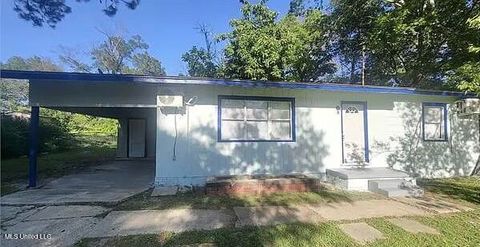
2943 Suncrest Dr, Jackson, MS 39212
$826
Cash flow
16.1%
Cash-on-Cash Return
16.5%
Cap rate
2.3%
Rent to Value Ratio
281 out of 291 properties for sale in Jackson, MS
Limited Results Shown
Create a free account, or log in to reveal all property listings and enjoy the complete experience.
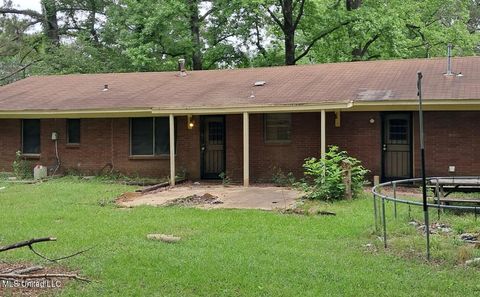
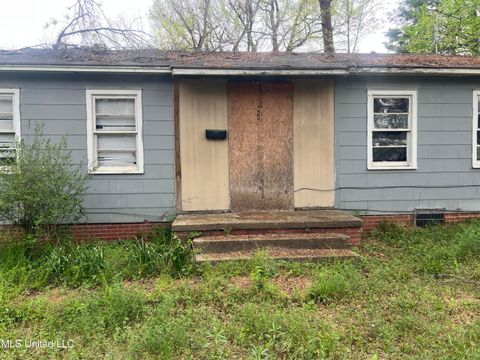
Active
$35,000
3
bds
|
2
ba
|
0
sqft
|
built
1959
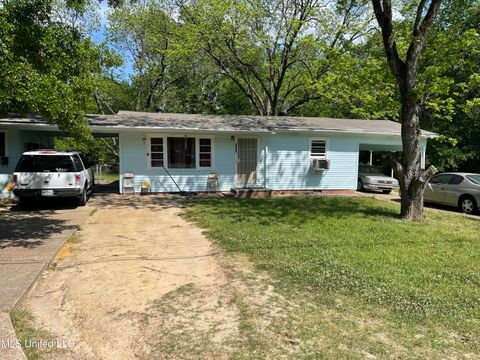
5103 Robinson Rd, Jackson, MS 39204
$824
Cash flow
27.4%
Cash-on-Cash Return
28.3%
Cap rate
4.0%
Rent to Value Ratio

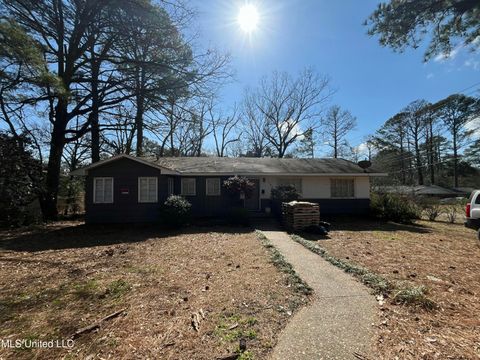
Active
$65,000
4
bds
|
2
ba
|
0
sqft
|
built
1968
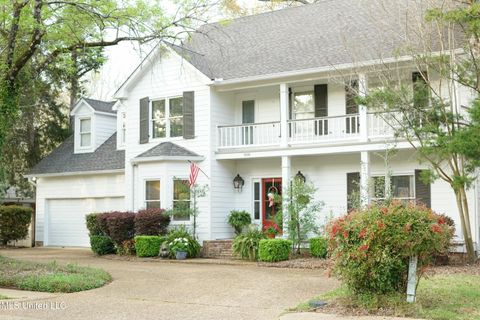
114 California Pl, Jackson, MS 39213
$799
Cash flow
14.3%
Cash-on-Cash Return
14.8%
Cap rate
2.3%
Rent to Value Ratio

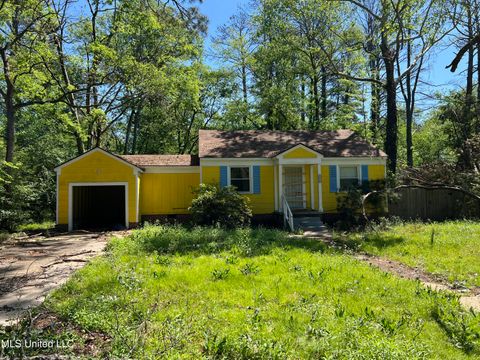
Active
$165,000
3
bds
|
2
ba
|
0
sqft
|
built
1991
15 Stanford Ct, Jackson, MS 39211
$325
Cash flow
10.3%
Cash-on-Cash Return
8.0%
Cap rate
1.1%
Rent to Value Ratio

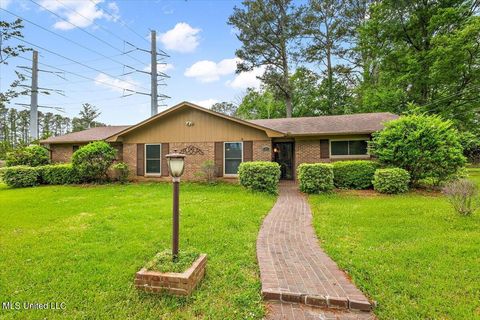
Active
$694,000
4
bds
|
4
ba
|
0
sqft
|
built
1994
340 Sherborne Pl, Jackson, MS 39232
$-1,396
Cash flow
-10.5%
Cash-on-Cash Return
3.3%
Cap rate
0.5%
Rent to Value Ratio

Active
$5,900
4
bds
|
2
ba
|
0
sqft
|
built
1955
953 Woody Dr, Jackson, MS 39212
$808
Cash flow
159.6%
Cash-on-Cash Return
164.3%
Cap rate
23.7%
Rent to Value Ratio

Active
$149,000
3
bds
|
3
ba
|
0
sqft
|
built
1956
235 Daniel Lake Blvd, Jackson, MS 39212
$437
Cash flow
15.3%
Cash-on-Cash Return
9.2%
Cap rate
1.2%
Rent to Value Ratio

Active
$265,000
3
bds
|
2
ba
|
0
sqft
|
built
1968
1842 Lake Trace Dr, Jackson, MS 39211
$59
Cash flow
1.2%
Cash-on-Cash Return
5.9%
Cap rate
0.8%
Rent to Value Ratio

Active
$45,000
3
bds
|
2
ba
|
0
sqft
|
built
1959
341 Savanna St, Jackson, MS 39212
$800
Cash flow
20.7%
Cash-on-Cash Return
21.3%
Cap rate
2.9%
Rent to Value Ratio

Active
$34,900
3
bds
|
1
ba
|
0
sqft
|
built
1955
280 Savanna St, Jackson, MS 39212
$652
Cash flow
21.8%
Cash-on-Cash Return
22.4%
Cap rate
2.9%
Rent to Value Ratio
Active
$7,500
3
bds
|
2
ba
|
0
sqft
|
built
1970
308 N Flag Chapel Rd, Jackson, MS 39209
$808
Cash flow
125.5%
Cash-on-Cash Return
129.3%
Cap rate
17.3%
Rent to Value Ratio
Active
$267,000
3
bds
|
2
ba
|
0
sqft
|
built
1993
122 Sugaloch Cv, Jackson, MS 39211
$-302
Cash flow
-5.9%
Cash-on-Cash Return
4.3%
Cap rate
0.8%
Rent to Value Ratio
Active
$25,000
3
bds
|
1
ba
|
0
sqft
|
built
1947
2602 Latimer Ave, Jackson, MS 39209
$638
Cash flow
29.7%
Cash-on-Cash Return
30.6%
Cap rate
4.0%
Rent to Value Ratio
Active
$70,000
3
bds
|
1
ba
|
0
sqft
|
built
1925
170 Galvez St, Jackson, MS 39209
$652
Cash flow
10.9%
Cash-on-Cash Return
11.2%
Cap rate
1.4%
Rent to Value Ratio
Active
$25,000
3
bds
|
1
ba
|
0
sqft
|
built
1947
2629 Latimer Ave, Jackson, MS 39209
$698
Cash flow
32.5%
Cash-on-Cash Return
33.5%
Cap rate
4.4%
Rent to Value Ratio
Active
$340,000
5
bds
|
4
ba
|
0
sqft
|
built
1981
4824 Brookwood Pl, Jackson, MS 39272
$38
Cash flow
0.6%
Cash-on-Cash Return
5.8%
Cap rate
0.8%
Rent to Value Ratio
Active
$23,500
3
bds
|
2
ba
|
0
sqft
|
built
1954
731 Hillmont Dr, Jackson, MS 39209
$633
Cash flow
31.4%
Cash-on-Cash Return
32.3%
Cap rate
4.3%
Rent to Value Ratio

Active
$520,000
5
bds
|
5
ba
|
0
sqft
|
built
1970
3830 Forest Hill Rd, Jackson, MS 39212
$-885
Cash flow
-8.9%
Cash-on-Cash Return
3.6%
Cap rate
0.5%
Rent to Value Ratio

Active
$29,900
4
bds
|
1
ba
|
0
sqft
|
built
1970
2214 Prosperity St, Jackson, MS 39213
$591
Cash flow
23.0%
Cash-on-Cash Return
23.7%
Cap rate
3.0%
Rent to Value Ratio
Active
$68,000
3
bds
|
2
ba
|
0
sqft
|
built
1955
263 Shady Cir, Jackson, MS 39204
$767
Cash flow
13.1%
Cash-on-Cash Return
13.5%
Cap rate
1.9%
Rent to Value Ratio

Active
$60,000
3
bds
|
1
ba
|
0
sqft
|
built
1958
2805 Engleside Dr, Jackson, MS 39212
$717
Cash flow
13.9%
Cash-on-Cash Return
14.3%
Cap rate
1.8%
Rent to Value Ratio
Active
$35,000
3
bds
|
2
ba
|
0
sqft
|
built
1950
1918 East Dr, Jackson, MS 39204
$539
Cash flow
17.9%
Cash-on-Cash Return
18.5%
Cap rate
2.6%
Rent to Value Ratio

Active
$105,000
2
bds
|
1
ba
|
0
sqft
|
built
1949
361 E Northside Dr, Jackson, MS 39206
$364
Cash flow
18.1%
Cash-on-Cash Return
9.8%
Cap rate
1.3%
Rent to Value Ratio
Active
$164,000
3
bds
|
2
ba
|
0
sqft
|
built
1968
101 Lake Of Pines Dr, Jackson, MS 39206
$213
Cash flow
6.8%
Cash-on-Cash Return
7.2%
Cap rate
1.0%
Rent to Value Ratio

Active
$525,000
5
bds
|
4
ba
|
0
sqft
|
built
1981
1844 Eastover Dr, Jackson, MS 39211
$-431
Cash flow
-4.3%
Cash-on-Cash Return
4.7%
Cap rate
0.8%
Rent to Value Ratio
Active
$60,000
4
bds
|
1
ba
|
0
sqft
|
built
1950
1752 Hampton St, Jackson, MS 39209
$718
Cash flow
13.9%
Cash-on-Cash Return
14.4%
Cap rate
2.0%
Rent to Value Ratio
Active
$28,000
2
bds
|
1
ba
|
0
sqft
|
built
1955
241 Lea Cir, Jackson, MS 39204
$551
Cash flow
22.9%
Cash-on-Cash Return
23.6%
Cap rate
3.2%
Rent to Value Ratio
Active
$89,900
3
bds
|
2
ba
|
0
sqft
|
built
1955
721 Glenmont Dr, Jackson, MS 39209
$225
Cash flow
13.1%
Cash-on-Cash Return
8.7%
Cap rate
1.1%
Rent to Value Ratio
Active
$69,500
4
bds
|
2
ba
|
0
sqft
|
built
1950
2826 Donaldson Dr, Jackson, MS 39212
$474
Cash flow
7.9%
Cash-on-Cash Return
8.2%
Cap rate
1.2%
Rent to Value Ratio

Active
$75,000
2
bds
|
2
ba
|
0
sqft
|
built
1946
1325 Fourth Ave, Jackson, MS 39203
$495
Cash flow
34.4%
Cash-on-Cash Return
13.6%
Cap rate
1.7%
Rent to Value Ratio
Active
$69,000
3
bds
|
1
ba
|
0
sqft
|
built
1950
1830 Westover St, Jackson, MS 39209
$692
Cash flow
11.7%
Cash-on-Cash Return
12.0%
Cap rate
1.6%
Rent to Value Ratio
Active
$79,000
3
bds
|
1
ba
|
0
sqft
|
built
1958
1714 Hampton St, Jackson, MS 39209
$312
Cash flow
20.6%
Cash-on-Cash Return
10.4%
Cap rate
1.4%
Rent to Value Ratio
Active
$79,000
4
bds
|
2
ba
|
0
sqft
|
built
1953
1740 Dixie Dr, Jackson, MS 39209
$490
Cash flow
32.4%
Cash-on-Cash Return
13.1%
Cap rate
1.8%
Rent to Value Ratio

Active
$115,000
3
bds
|
3
ba
|
0
sqft
|
built
1970
5155 Wayneland Dr, Jackson, MS 39211
$-96
Cash flow
-4.4%
Cash-on-Cash Return
4.7%
Cap rate
1.3%
Rent to Value Ratio
Active
$405,000
5
bds
|
4
ba
|
0
sqft
|
built
1985
908 Newland St, Jackson, MS 39211
$-335
Cash flow
-4.3%
Cash-on-Cash Return
4.7%
Cap rate
0.7%
Rent to Value Ratio
Active
$149,900
3
bds
|
2
ba
|
0
sqft
|
built
1965
6037 Floral Dr, Jackson, MS 39206
$72
Cash flow
2.5%
Cash-on-Cash Return
6.3%
Cap rate
0.9%
Rent to Value Ratio

Active
$85,900
3
bds
|
2
ba
|
0
sqft
|
built
1955
3251 Corey Dr, Jackson, MS 39212
$179
Cash flow
10.9%
Cash-on-Cash Return
8.2%
Cap rate
1.2%
Rent to Value Ratio

Active
$95,000
1
bds
|
2
ba
|
0
sqft
|
built
1967
5025 Wayneland Dr, Jackson, MS 39211
$145
Cash flow
8.0%
Cash-on-Cash Return
7.5%
Cap rate
1.5%
Rent to Value Ratio

Active
$250,000
3
bds
|
2
ba
|
0
sqft
|
built
1979
4800 Brookwood Pl, Jackson, MS 39272
$150
Cash flow
3.1%
Cash-on-Cash Return
6.4%
Cap rate
1.0%
Rent to Value Ratio