Barnstable County Investment Properties for Sale
Browse homes for sale and investment properties in Barnstable County. Refine your search by price, property type, or more.
Best cash flowing properties in Barnstable County
Active
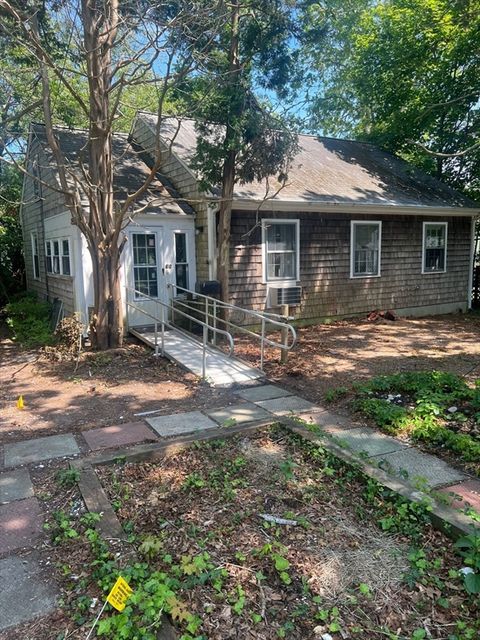
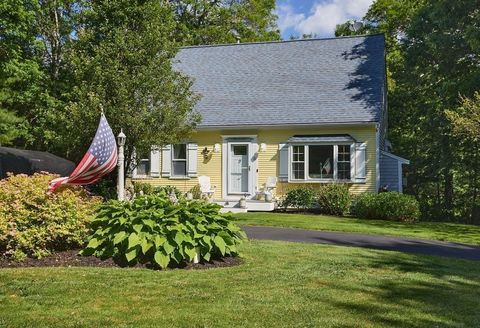
$449,000
3
bds
|
1
ba
|
928
sqft
|
built
1949
60 Baxter Ave, West Yarmouth, MA 02673
$-604
Cash flow
-7.0%
Cash-on-Cash Return
4.1%
Cap rate
0.6%
Rent to Value Ratio
Active
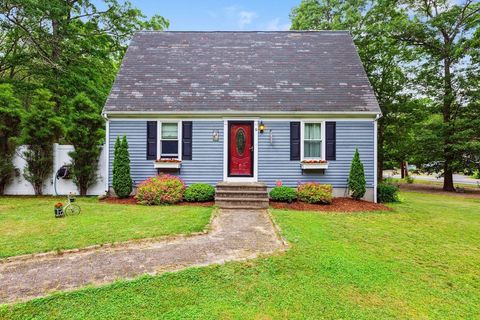
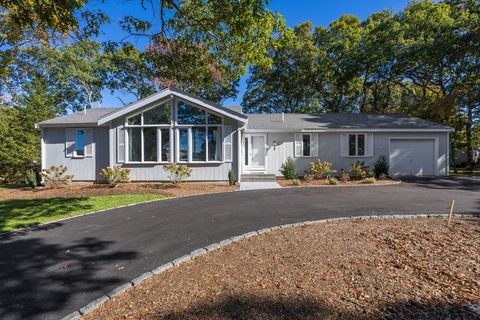
$574,900
3
bds
|
2
ba
|
1,424
sqft
|
built
1985
9 Jones Rd, Mashpee, MA 02649
$-839
Cash flow
-7.6%
Cash-on-Cash Return
3.9%
Cap rate
0.5%
Rent to Value Ratio
480 out of 721 properties for sale in Barnstable County
Limited Results Shown
Create a free account, or log in to reveal all property listings and enjoy the complete experience.
Active
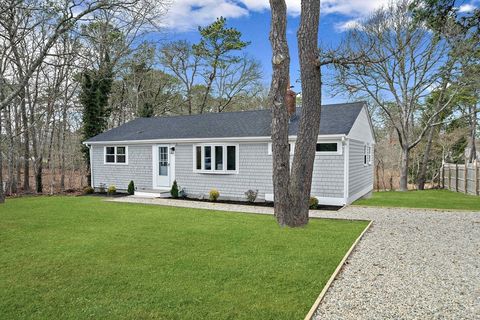
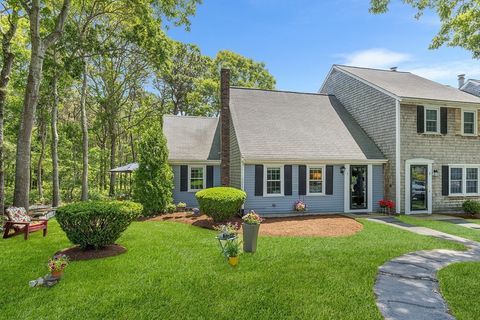
$599,000
3
bds
|
2
ba
|
968
sqft
|
built
1962
6 Raintree Rd, Dennis Port, MA 02639
$-1,255
Cash flow
-10.9%
Cash-on-Cash Return
3.2%
Cap rate
0.4%
Rent to Value Ratio
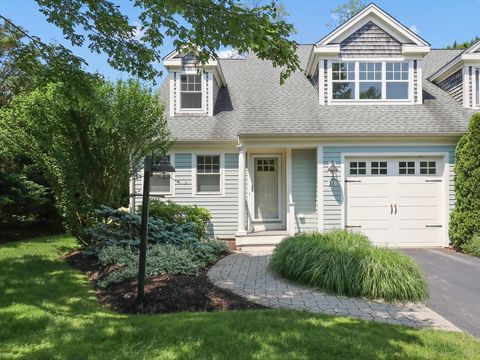
Active
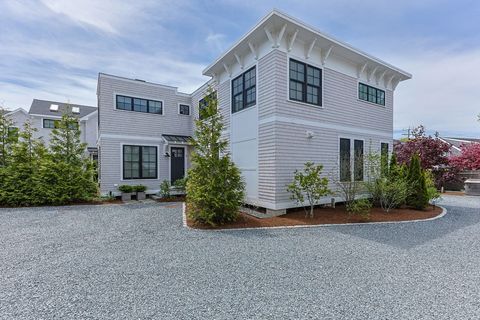
$1,399,000
2
bds
|
3
ba
|
1,192
sqft
|
built
2018
350 Bradford St, Provincetown, MA 02657
$-4,167
Cash flow
-15.5%
Cash-on-Cash Return
2.1%
Cap rate
0.4%
Rent to Value Ratio
Active
$799,000
3
bds
|
2
ba
|
1,806
sqft
|
built
1990
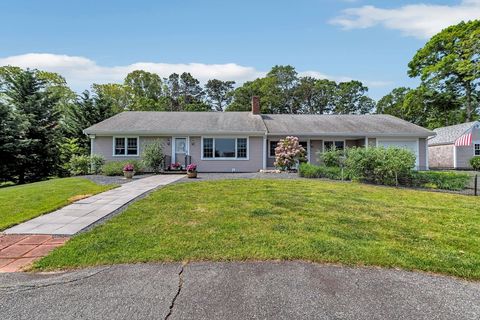
17 Claus Way, Marstons Mills, MA 02648
$-1,635
Cash flow
-10.7%
Cash-on-Cash Return
3.2%
Cap rate
0.4%
Rent to Value Ratio
Active
$1,450,000
2
bds
|
2
ba
|
888
sqft
|
built
2006
125 Bradford Street Ext, Provincetown, MA 02657
$-4,976
Cash flow
-17.9%
Cash-on-Cash Return
1.6%
Cap rate
0.3%
Rent to Value Ratio
Active
$2,600,000
3
bds
|
3
ba
|
2,756
sqft
|
built
1982
4 Asas Lndg, Orleans, MA 02653
$-10,166
Cash flow
-20.4%
Cash-on-Cash Return
1.0%
Cap rate
0.2%
Rent to Value Ratio
Active
$799,000
5
bds
|
4
ba
|
2,850
sqft
|
built
1918
60 Sandwich Rd, Bourne, MA 02532
$-1,696
Cash flow
-11.1%
Cash-on-Cash Return
3.1%
Cap rate
0.5%
Rent to Value Ratio
Active
$669,000
3
bds
|
2
ba
|
1,547
sqft
|
built
1994
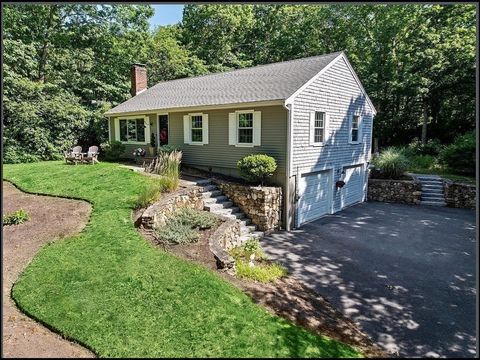
10 Ryder Cir, Sandwich, MA 02563
$-1,439
Cash flow
-11.2%
Cash-on-Cash Return
3.7%
Cap rate
0.5%
Rent to Value Ratio
Active
$975,000
3
bds
|
2
ba
|
1,800
sqft
|
built
1979
131 Portside Cir, East Falmouth, MA 02536
$-1,617
Cash flow
-8.7%
Cash-on-Cash Return
3.7%
Cap rate
0.5%
Rent to Value Ratio
Active
$425,000
1
bds
|
1
ba
|
948
sqft
|
built
1982
441 Buck Island Rd, West Yarmouth, MA 02673
$-1,236
Cash flow
-15.2%
Cash-on-Cash Return
2.2%
Cap rate
0.5%
Rent to Value Ratio
Active
$889,000
3
bds
|
3
ba
|
1,799
sqft
|
built
2012
21 Pine St, North Falmouth, MA 02556
$-2,742
Cash flow
-16.1%
Cash-on-Cash Return
2.0%
Cap rate
0.4%
Rent to Value Ratio
Active
$699,000
3
bds
|
2
ba
|
1,144
sqft
|
built
1976
15 Surrey Ln, Sandwich, MA 02563
$-1,517
Cash flow
-11.3%
Cash-on-Cash Return
3.1%
Cap rate
0.5%
Rent to Value Ratio
Active
$1,495,000
2
bds
|
1
ba
|
736
sqft
|
built
1900
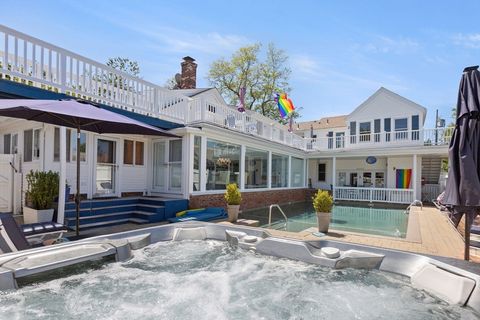
15 Mechanic St, Provincetown, MA 02657
$-5,364
Cash flow
-18.7%
Cash-on-Cash Return
1.9%
Cap rate
0.3%
Rent to Value Ratio
Active
$3,949,000
3
bds
|
3
ba
|
2,120
sqft
|
built
1920
777 Commercial St, Provincetown, MA 02657
$-15,740
Cash flow
-20.8%
Cash-on-Cash Return
0.9%
Cap rate
0.2%
Rent to Value Ratio
Active
$849,900
2
bds
|
2
ba
|
1,822
sqft
|
built
1993
344 Mayfair Rd, South Dennis, MA 02660
$-1,640
Cash flow
-10.1%
Cash-on-Cash Return
3.4%
Cap rate
0.5%
Rent to Value Ratio
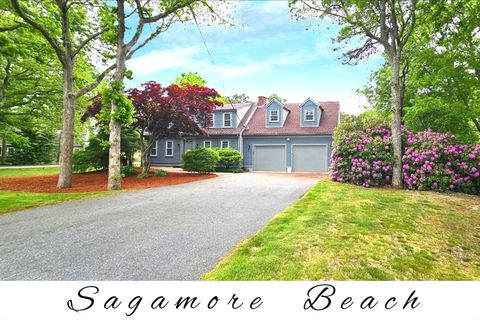
Active
$799,000
3
bds
|
4
ba
|
2,418
sqft
|
built
1974
5 Tecumseh Rd, Sagamore Beach, MA 02562
$-1,798
Cash flow
-11.7%
Cash-on-Cash Return
3.0%
Cap rate
0.4%
Rent to Value Ratio
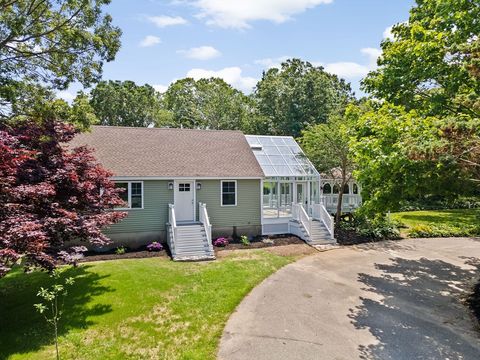
Active
$899,900
4
bds
|
4
ba
|
2,128
sqft
|
built
1978
38 Siasconset Dr, Sagamore Beach, MA 02562
$-2,484
Cash flow
-14.4%
Cash-on-Cash Return
2.4%
Cap rate
0.3%
Rent to Value Ratio
Active
$3,195,000
3
bds
|
4
ba
|
3,133
sqft
|
built
2001
25 Richard Ln, Eastham, MA 02642
$-11,610
Cash flow
-19.0%
Cash-on-Cash Return
1.3%
Cap rate
0.2%
Rent to Value Ratio
Active
$330,000
1
bds
|
1
ba
|
579
sqft
|
built
1987
82 Fletcher Ln, Brewster, MA 02631
$-903
Cash flow
-14.3%
Cash-on-Cash Return
2.4%
Cap rate
0.6%
Rent to Value Ratio
Active
$899,000
2
bds
|
1
ba
|
586
sqft
|
built
1850
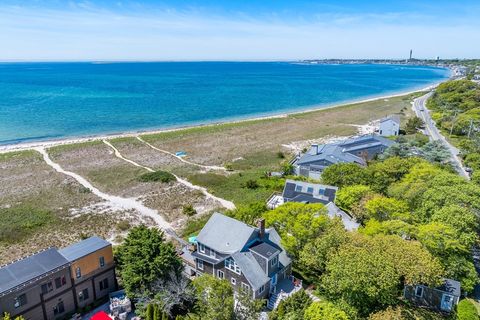
381 Commercial St, Provincetown, MA 02657
$-2,636
Cash flow
-15.3%
Cash-on-Cash Return
2.2%
Cap rate
0.4%
Rent to Value Ratio

Active
$799,900
3
bds
|
2
ba
|
1,872
sqft
|
built
1987
160 Toland Dr, Eastham, MA 02642
$-1,732
Cash flow
-11.3%
Cash-on-Cash Return
3.1%
Cap rate
0.5%
Rent to Value Ratio
Active
$699,000
3
bds
|
2
ba
|
1,572
sqft
|
built
1991
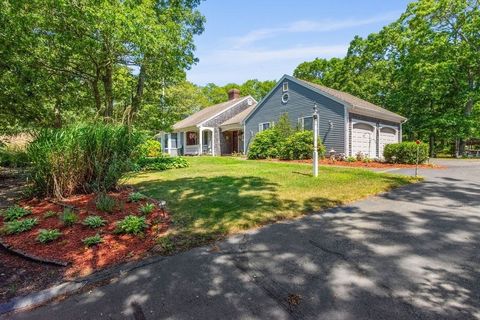
241 Olde Homestead Dr, Marstons Mills, MA 02648
$-1,264
Cash flow
-9.4%
Cash-on-Cash Return
3.5%
Cap rate
0.5%
Rent to Value Ratio
Active
$629,000
2
bds
|
1
ba
|
1,366
sqft
|
built
1964
128 S Sea Ave, West Yarmouth, MA 02673
$-1,368
Cash flow
-11.3%
Cash-on-Cash Return
3.1%
Cap rate
0.4%
Rent to Value Ratio
Active
$850,000
3
bds
|
3
ba
|
3,040
sqft
|
built
1999
152 Algonquin Ave, Mashpee, MA 02649
$-1,704
Cash flow
-10.5%
Cash-on-Cash Return
3.3%
Cap rate
0.5%
Rent to Value Ratio
Active
$799,500
3
bds
|
2
ba
|
1,368
sqft
|
built
1960
110 Teaticket Path, Teaticket, MA 02536
$-2,272
Cash flow
-14.8%
Cash-on-Cash Return
2.3%
Cap rate
0.3%
Rent to Value Ratio
Active
$575,000
2
bds
|
1
ba
|
1,340
sqft
|
built
1961
40 Joan Rd, Centerville, MA 02632
$-1,312
Cash flow
-11.9%
Cash-on-Cash Return
2.9%
Cap rate
0.4%
Rent to Value Ratio

Active
$1,375,000
2
bds
|
3
ba
|
2,049
sqft
|
built
2015
66 Simons Rd, Mashpee, MA 02649
$-4,489
Cash flow
-17.0%
Cash-on-Cash Return
2.3%
Cap rate
0.5%
Rent to Value Ratio
Active
$849,900
4
bds
|
2
ba
|
2,314
sqft
|
built
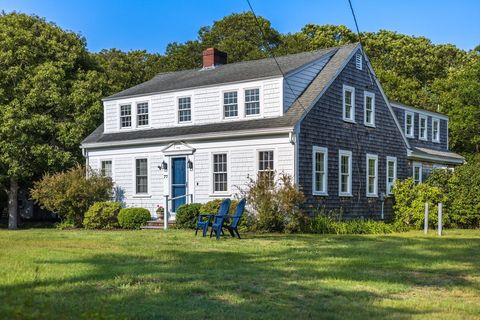
1930
34 Kenwood Rd, Pocasset, MA 02559
$-2,323
Cash flow
-14.3%
Cash-on-Cash Return
2.4%
Cap rate
0.4%
Rent to Value Ratio
Active
$1,980,000
3
bds
|
4
ba
|
2,633
sqft
|
built
2024
79 Neshobe Rd, Mashpee, MA 02649
$-6,066
Cash flow
-16.0%
Cash-on-Cash Return
2.6%
Cap rate
0.3%
Rent to Value Ratio
Active
$469,000
2
bds
|
1
ba
|
582
sqft
|
built
1960
290 Old Wharf Rd, Wellfleet, MA 02667
$-905
Cash flow
-10.1%
Cash-on-Cash Return
3.4%
Cap rate
0.5%
Rent to Value Ratio
Active
$1,785,000
4
bds
|
3
ba
|
2,406
sqft
|
built
1930
147 Bradford Street Ext, Provincetown, MA 02657
$-5,382
Cash flow
-15.7%
Cash-on-Cash Return
2.1%
Cap rate
0.3%
Rent to Value Ratio
Active
$3,295,000
3
bds
|
3
ba
|
2,304
sqft
|
built
1978
107 Channel Point Rd, Hyannis, MA 02601
$-10,537
Cash flow
-16.7%
Cash-on-Cash Return
1.8%
Cap rate
0.3%
Rent to Value Ratio
Active
$1,925,000
5
bds
|
3
ba
|
2,456
sqft
|
built
1962
5 Great Hills Rd, Truro, MA 02666
$-5,772
Cash flow
-15.6%
Cash-on-Cash Return
2.1%
Cap rate
0.3%
Rent to Value Ratio
Active
$3,750,000
4
bds
|
6
ba
|
6,918
sqft
|
built
2022
77 Highwood Ln, East Falmouth, MA 02536
$-13,687
Cash flow
-19.0%
Cash-on-Cash Return
1.3%
Cap rate
0.2%
Rent to Value Ratio
Active
$1,335,000
4
bds
|
4
ba
|
2,662
sqft
|
built
1852
5 Putnam Ave, Cotuit, MA 02635
$-4,048
Cash flow
-15.8%
Cash-on-Cash Return
2.0%
Cap rate
0.3%
Rent to Value Ratio
Active
$1,590,000
3
bds
|
5
ba
|
5,013
sqft
|
built
2007
19 Angus Way, Centerville, MA 02632
$-5,407
Cash flow
-17.7%
Cash-on-Cash Return
1.6%
Cap rate
0.3%
Rent to Value Ratio
Active
$1,749,000
3
bds
|
2
ba
|
2,511
sqft
|
built
1975
72 Highland Rd, Truro, MA 02666
$-5,077
Cash flow
-15.1%
Cash-on-Cash Return
2.2%
Cap rate
0.3%
Rent to Value Ratio
Active
$899,000
3
bds
|
2
ba
|
1,982
sqft
|
built
1972
25 Pheasant Cove Cir, Yarmouth Port, MA 02675
$-1,988
Cash flow
-11.5%
Cash-on-Cash Return
3.0%
Cap rate
0.4%
Rent to Value Ratio
Active
$1,150,000
5
bds
|
2
ba
|
2,560
sqft
|
built
1925
77 Pleasant Rd, West Harwich, MA 02671
$-3,013
Cash flow
-13.7%
Cash-on-Cash Return
2.5%
Cap rate
0.4%
Rent to Value Ratio