Barnstable County Investment Properties for Sale
Browse homes for sale and investment properties in Barnstable County. Refine your search by price, property type, or more.
Best cash flowing properties in Barnstable County
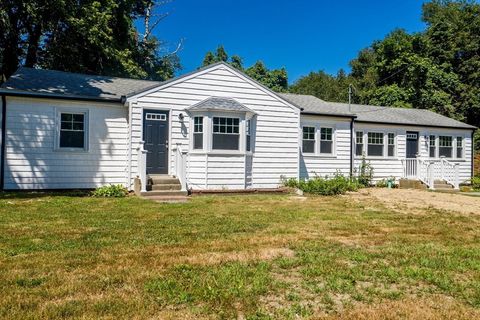
Active
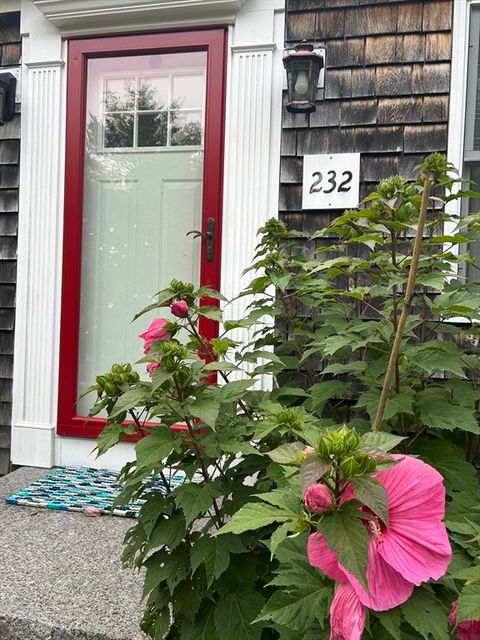
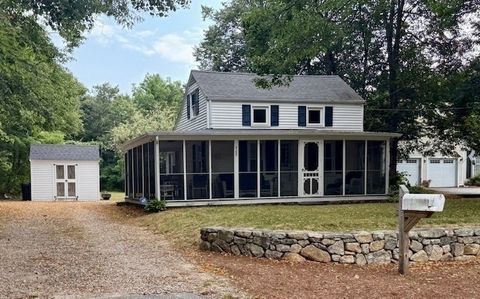
$504,900
3
bds
|
2
ba
|
1,460
sqft
|
built
1946
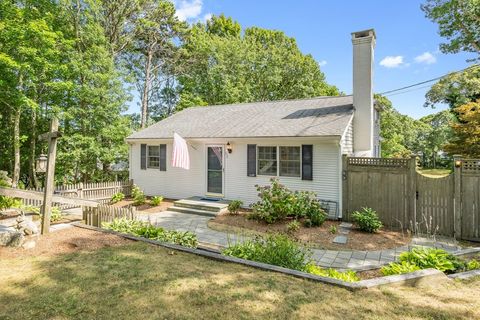
232 County Rd, Bourne, MA 02532
$-270
Cash flow
-2.8%
Cash-on-Cash Return
5.0%
Cap rate
0.7%
Rent to Value Ratio
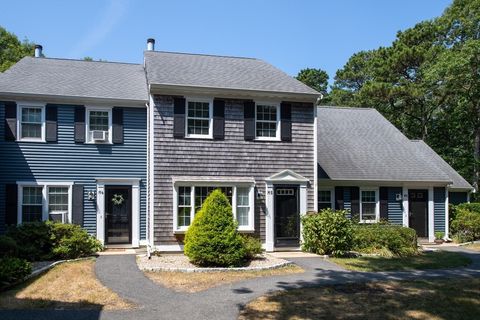
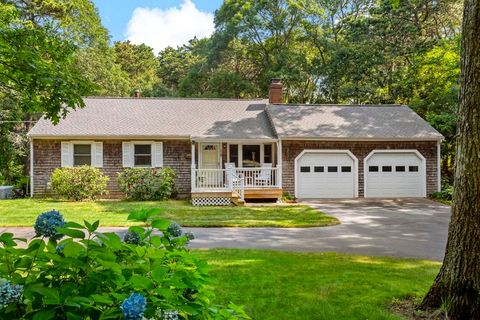
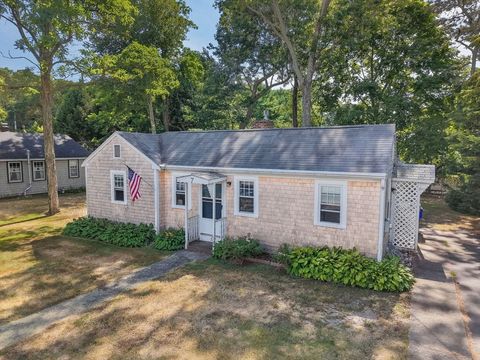
Active
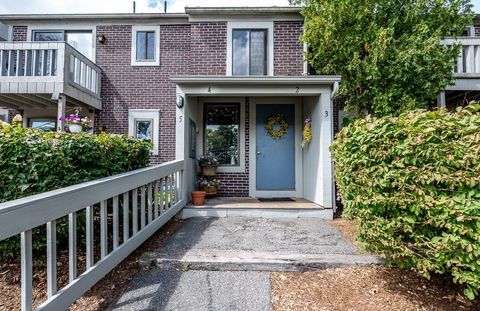
$364,900
2
bds
|
2
ba
|
868
sqft
|
built
1974
825 W Main St, Hyannis, MA 02601
$-519
Cash flow
-7.4%
Cash-on-Cash Return
4.0%
Cap rate
0.7%
Rent to Value Ratio
378 out of 556 properties for sale in Barnstable County
Limited Results Shown
Create a free account, or log in to reveal all property listings and enjoy the complete experience.
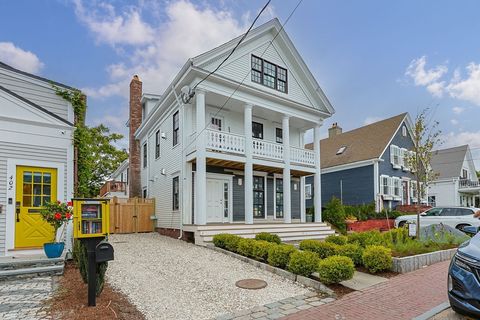
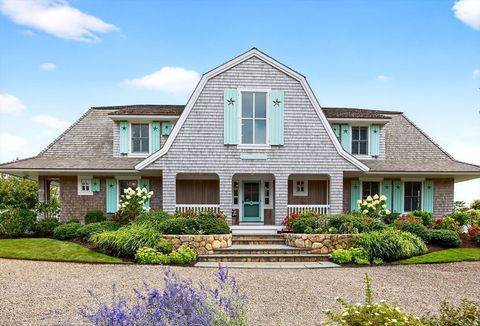
Active
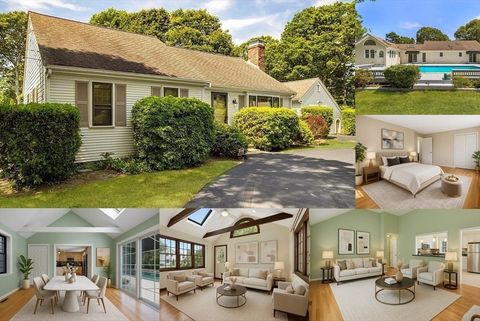
$769,000
3
bds
|
3
ba
|
1,654
sqft
|
built
1984
179 Sudbury Ln, Hyannis, MA 02601
$-1,056
Cash flow
-7.2%
Cash-on-Cash Return
4.0%
Cap rate
0.6%
Rent to Value Ratio

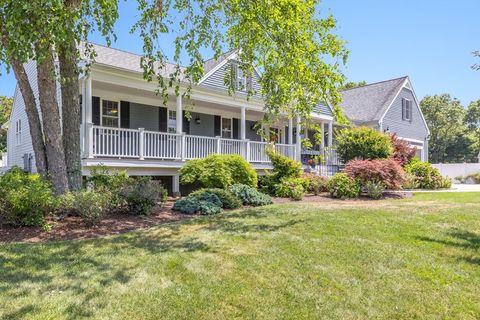
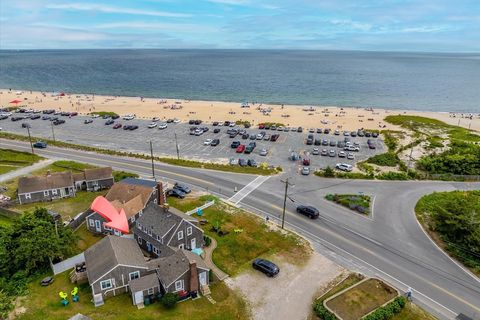
Active
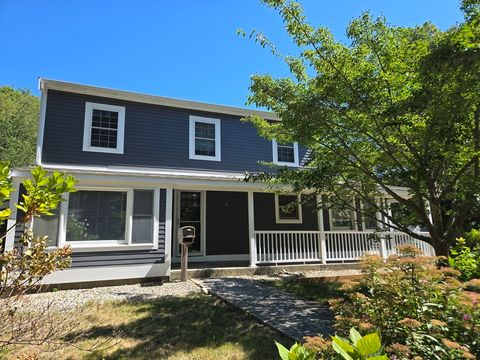
$1,100,000
3
bds
|
3
ba
|
1,622
sqft
|
built
1978
33 Dexter Ave, Sandwich, MA 02563
$-2,667
Cash flow
-12.6%
Cash-on-Cash Return
2.8%
Cap rate
0.4%
Rent to Value Ratio
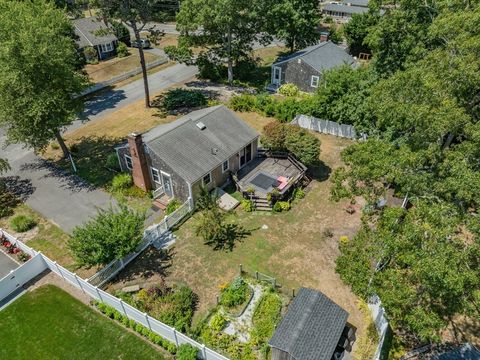
Active
$899,000
3
bds
|
2
ba
|
1,500
sqft
|
built
1959
82 Yacht Club Rd, Centerville, MA 02632
$-2,497
Cash flow
-14.5%
Cash-on-Cash Return
2.3%
Cap rate
0.4%
Rent to Value Ratio
Active
$979,000
3
bds
|
2
ba
|
1,403
sqft
|
built
1923
20 Namskaket Rd, Orleans, MA 02653
$-2,534
Cash flow
-13.5%
Cash-on-Cash Return
2.6%
Cap rate
0.4%
Rent to Value Ratio
Active
$1,500,000
3
bds
|
4
ba
|
2,363
sqft
|
built
2017
24 Chase St, West Harwich, MA 02671
$-4,847
Cash flow
-16.9%
Cash-on-Cash Return
1.8%
Cap rate
0.3%
Rent to Value Ratio
Active
$1,495,000
4
bds
|
4
ba
|
1,800
sqft
|
built
1950
80 4th St, Wellfleet, MA 02667
$-4,056
Cash flow
-14.2%
Cash-on-Cash Return
2.4%
Cap rate
0.4%
Rent to Value Ratio
Active
$1,250,000
5
bds
|
2
ba
|
2,290
sqft
|
built
1974
69 Reynolds St, Teaticket, MA 02536
$-3,640
Cash flow
-15.2%
Cash-on-Cash Return
2.2%
Cap rate
0.3%
Rent to Value Ratio
Active
$825,000
3
bds
|
3
ba
|
1,556
sqft
|
built
1984
28 Sheila Way, East Falmouth, MA 02536
$-1,718
Cash flow
-10.9%
Cash-on-Cash Return
3.2%
Cap rate
0.4%
Rent to Value Ratio
Active
$2,375,000
4
bds
|
4
ba
|
3,634
sqft
|
built
2024
24 Valley Rd, West Yarmouth, MA 02673
$-5,334
Cash flow
-11.7%
Cash-on-Cash Return
3.0%
Cap rate
0.4%
Rent to Value Ratio
Active
$3,250,000
5
bds
|
6
ba
|
4,848
sqft
|
built
2017
149 Old Stage Rd, Centerville, MA 02632
$-12,907
Cash flow
-20.7%
Cash-on-Cash Return
0.9%
Cap rate
0.1%
Rent to Value Ratio
Active
$345,000
2
bds
|
1
ba
|
864
sqft
|
built
1984
35 Ashumet Rd, Mashpee, MA 02649
$-769
Cash flow
-11.6%
Cash-on-Cash Return
3.0%
Cap rate
0.6%
Rent to Value Ratio
Active
$739,000
3
bds
|
2
ba
|
1,484
sqft
|
built
1972
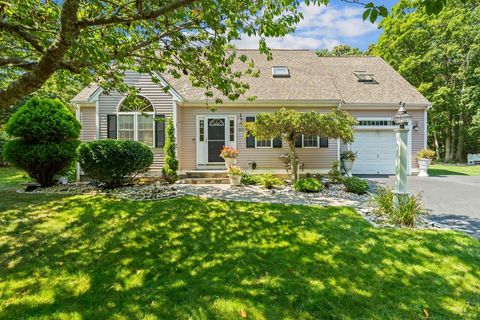
4 Royal Cir, Sandwich, MA 02563
$-1,795
Cash flow
-12.7%
Cash-on-Cash Return
2.8%
Cap rate
0.4%
Rent to Value Ratio
Active
$950,000
4
bds
|
3
ba
|
2,372
sqft
|
built
1985
15 Follins Pond Rd, Yarmouth Port, MA 02675
$-2,195
Cash flow
-12.1%
Cash-on-Cash Return
2.9%
Cap rate
0.4%
Rent to Value Ratio
Active
$1,720,000
3
bds
|
3
ba
|
2,179
sqft
|
built
2011
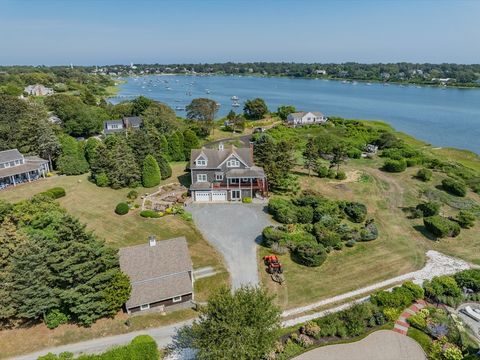
110 Commerce Rd, Barnstable, MA 02630
$-5,997
Cash flow
-18.2%
Cash-on-Cash Return
1.5%
Cap rate
0.3%
Rent to Value Ratio
Active
$4,850,000
4
bds
|
6
ba
|
5,045
sqft
|
built
2023
94 Highwood Ln, East Falmouth, MA 02536
$-20,152
Cash flow
-21.7%
Cash-on-Cash Return
0.7%
Cap rate
0.1%
Rent to Value Ratio
Active
$830,000
3
bds
|
3
ba
|
1,805
sqft
|
built
2000
1 Leveridge Ln, Sandwich, MA 02563
$-2,281
Cash flow
-14.3%
Cash-on-Cash Return
2.4%
Cap rate
0.4%
Rent to Value Ratio
Active
$2,695,000
4
bds
|
6
ba
|
5,021
sqft
|
built
2002
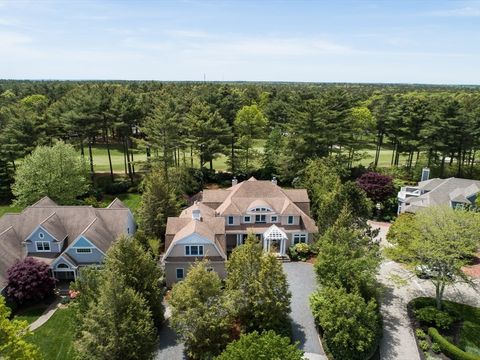
431 Baxters Neck Rd, Marstons Mills, MA 02648
$-7,712
Cash flow
-14.9%
Cash-on-Cash Return
2.2%
Cap rate
0.4%
Rent to Value Ratio
Active
$1,100,000
2
bds
|
3
ba
|
3,195
sqft
|
built
1998
111 Reflection Dr, Sandwich, MA 02563
$-4,600
Cash flow
-21.8%
Cash-on-Cash Return
0.7%
Cap rate
0.3%
Rent to Value Ratio
Active
$949,900
3
bds
|
1
ba
|
1,332
sqft
|
built
1958
5 Massasoit St, Teaticket, MA 02536
$-2,415
Cash flow
-13.3%
Cash-on-Cash Return
2.6%
Cap rate
0.4%
Rent to Value Ratio
Active
$649,000
4
bds
|
2
ba
|
946
sqft
|
built
1985
66 Braxton Rd, East Falmouth, MA 02536
$-1,140
Cash flow
-9.2%
Cash-on-Cash Return
3.6%
Cap rate
0.5%
Rent to Value Ratio
Active
$1,350,000
4
bds
|
4
ba
|
2,425
sqft
|
built
1981
23 Topping Lift, Mashpee, MA 02649
$-4,162
Cash flow
-16.1%
Cash-on-Cash Return
2.0%
Cap rate
0.3%
Rent to Value Ratio
Active
$499,000
2
bds
|
3
ba
|
1,520
sqft
|
built
1985
195 Falmouth Rd, Mashpee, MA 02649
$-1,003
Cash flow
-10.5%
Cash-on-Cash Return
3.3%
Cap rate
0.6%
Rent to Value Ratio
Active
$2,500,000
3
bds
|
2
ba
|
1,530
sqft
|
built
1920
27 Sycamore St, Teaticket, MA 02536
$-9,052
Cash flow
-18.9%
Cash-on-Cash Return
1.3%
Cap rate
0.2%
Rent to Value Ratio
Active
$350,000
2
bds
|
2
ba
|
1,152
sqft
|
built
1986
248 Camp St, West Yarmouth, MA 02673
$-579
Cash flow
-8.6%
Cash-on-Cash Return
3.7%
Cap rate
0.7%
Rent to Value Ratio
Active
$3,250,000
3
bds
|
4
ba
|
2,250
sqft
|
built
2025
404 Commercial St, Provincetown, MA 02657
$-12,498
Cash flow
-20.1%
Cash-on-Cash Return
1.1%
Cap rate
0.2%
Rent to Value Ratio
Active
$1,400,000
3
bds
|
4
ba
|
3,979
sqft
|
built
2007
97 Altons Ln, East Falmouth, MA 02536
$-4,125
Cash flow
-15.4%
Cash-on-Cash Return
2.1%
Cap rate
0.3%
Rent to Value Ratio
Active
$485,000
2
bds
|
1
ba
|
804
sqft
|
built
1960
6 Checkerberry Ln, West Yarmouth, MA 02673
$-1,109
Cash flow
-11.9%
Cash-on-Cash Return
2.9%
Cap rate
0.4%
Rent to Value Ratio
Active
$829,000
3
bds
|
2
ba
|
1,767
sqft
|
built
2001
306 Trotting Park Rd, Teaticket, MA 02536
$-1,784
Cash flow
-11.2%
Cash-on-Cash Return
3.1%
Cap rate
0.4%
Rent to Value Ratio
Active
$1,200,000
4
bds
|
3
ba
|
2,064
sqft
|
built
1963
53 Great Oak Rd, Orleans, MA 02653
$-3,072
Cash flow
-13.4%
Cash-on-Cash Return
2.6%
Cap rate
0.4%
Rent to Value Ratio
Active
$5,900,000
2
bds
|
3
ba
|
1,850
sqft
|
built
2004
99 Uncle Alberts Drive Ext, Chatham, MA 02633
$-23,505
Cash flow
-20.8%
Cash-on-Cash Return
0.9%
Cap rate
0.1%
Rent to Value Ratio
Active
$2,499,000
4
bds
|
5
ba
|
4,689
sqft
|
built
2001
68 The Hts, Mashpee, MA 02649
$-7,304
Cash flow
-15.2%
Cash-on-Cash Return
2.2%
Cap rate
0.3%
Rent to Value Ratio
Active
$679,900
4
bds
|
2
ba
|
1,367
sqft
|
built
1940
282 Parker Rd, West Barnstable, MA 02668
$-1,500
Cash flow
-11.5%
Cash-on-Cash Return
3.0%
Cap rate
0.5%
Rent to Value Ratio
Active
$725,000
3
bds
|
3
ba
|
1,864
sqft
|
built
1983
294 Salt Rock Rd, Barnstable, MA 02630
$-1,310
Cash flow
-9.4%
Cash-on-Cash Return
3.5%
Cap rate
0.5%
Rent to Value Ratio
Active
$6,695,000
4
bds
|
5
ba
|
3,225
sqft
|
built
2010
101 Morris Island Rd, Chatham, MA 02633
$-28,325
Cash flow
-22.1%
Cash-on-Cash Return
0.6%
Cap rate
0.1%
Rent to Value Ratio
Active
$1,795,000
6
bds
|
4
ba
|
2,726
sqft
|
built
1930
1060 Craigville Beach Rd, Centerville, MA 02632
$-4,050
Cash flow
-11.8%
Cash-on-Cash Return
3.0%
Cap rate
0.4%
Rent to Value Ratio
Active
$849,000
4
bds
|
1
ba
|
720
sqft
|
built
1900
428 Main St, Cotuit, MA 02635
$-2,187
Cash flow
-13.4%
Cash-on-Cash Return
2.6%
Cap rate
0.4%
Rent to Value Ratio
Active
$499,000
2
bds
|
1
ba
|
698
sqft
|
built
1948
7 Freeman St, Bourne, MA 02532
$-1,074
Cash flow
-11.2%
Cash-on-Cash Return
3.1%
Cap rate
0.4%
Rent to Value Ratio

Active
$650,000
2
bds
|
1
ba
|
2,698
sqft
|
built
1960
64 Ellsworth Dr, East Falmouth, MA 02536
$-1,238
Cash flow
-9.9%
Cash-on-Cash Return
3.4%
Cap rate
0.5%
Rent to Value Ratio