Hampden County Investment Properties for Sale
Browse homes for sale and investment properties in Hampden County. Refine your search by price, property type, or more.
Best cash flowing properties in Hampden County
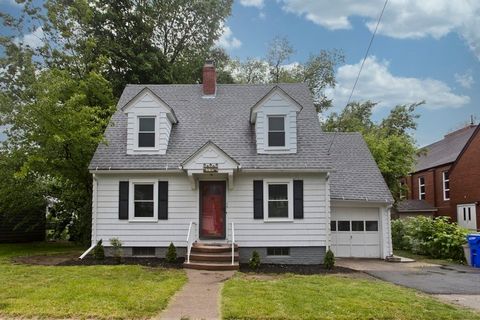
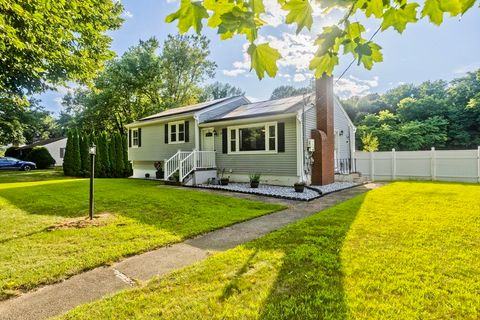
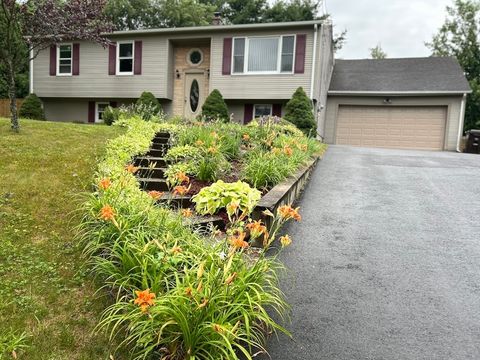
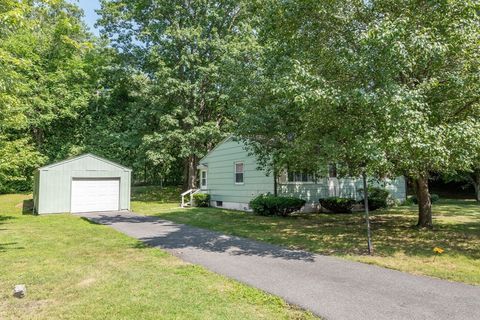
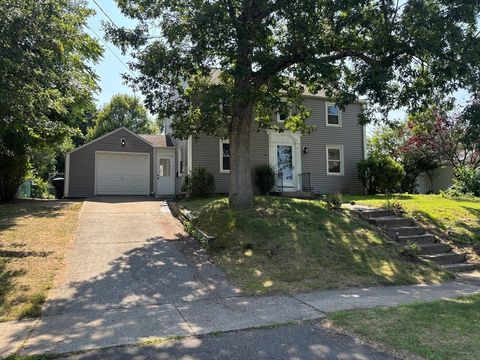
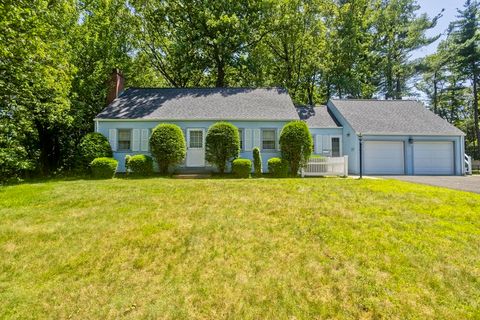
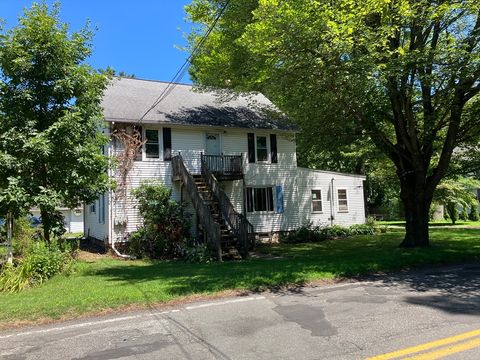
Active
$320,000
3
bds
|
2
ba
|
1,939
sqft
|
built
1936
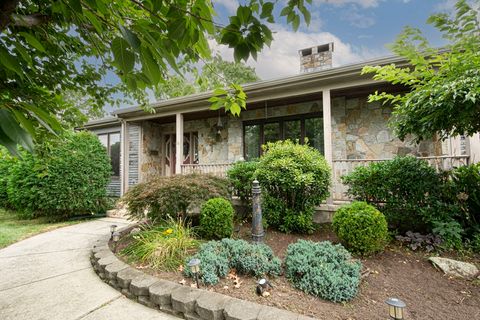
19 Roosevelt Ave, Springfield, MA 01118
$60
Cash flow
1.0%
Cash-on-Cash Return
5.9%
Cap rate
0.9%
Rent to Value Ratio
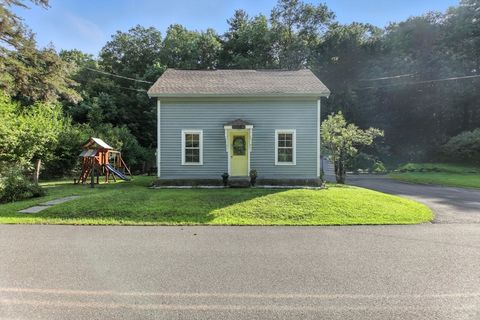
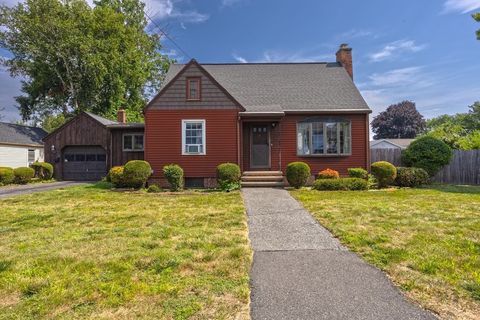
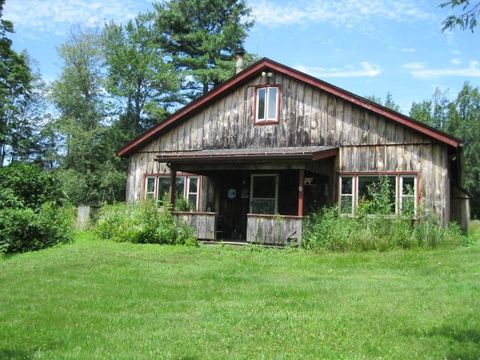
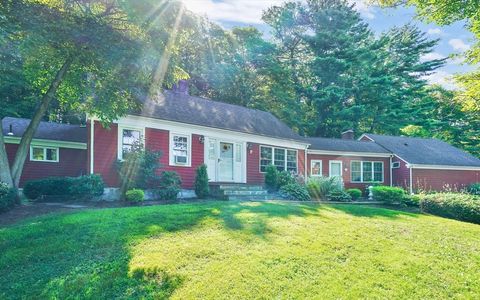
Active
$260,000
3
bds
|
1
ba
|
1,048
sqft
|
built
1880
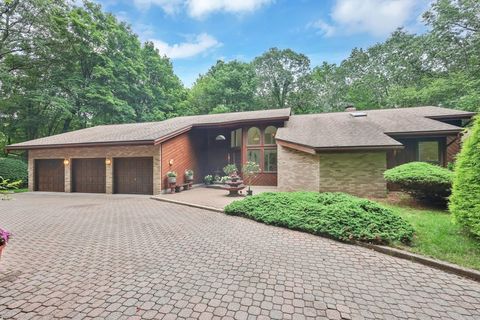
76 Hampden St, Chester, MA 01011
$51
Cash flow
1.0%
Cash-on-Cash Return
5.9%
Cap rate
0.9%
Rent to Value Ratio
350 out of 450 properties for sale in Hampden County
Limited Results Shown
Create a free account, or log in to reveal all property listings and enjoy the complete experience.
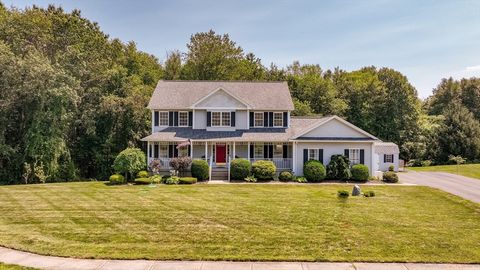
Active
$657,000
4
bds
|
4
ba
|
3,577
sqft
|
built
1996
57 Jessie Ln, Westfield, MA 01085
$-1,328
Cash flow
-10.5%
Cash-on-Cash Return
3.3%
Cap rate
0.5%
Rent to Value Ratio
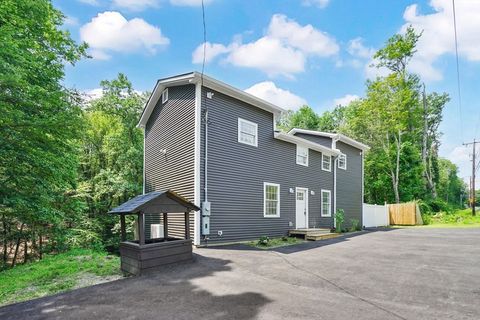
Active
$400,000
3
bds
|
3
ba
|
2,244
sqft
|
built
1935
481 Blandford Rd, Russell, MA 01071
$-864
Cash flow
-11.3%
Cash-on-Cash Return
3.1%
Cap rate
0.4%
Rent to Value Ratio
Active
$395,000
3
bds
|
2
ba
|
1,156
sqft
|
built
1965
52 Peros Dr, Agawam, MA 01001
$-572
Cash flow
-7.6%
Cash-on-Cash Return
3.9%
Cap rate
0.6%
Rent to Value Ratio
Active
$325,000
3
bds
|
2
ba
|
1,380
sqft
|
built
1950
70 Empire St, Chicopee, MA 01013
$-254
Cash flow
-4.1%
Cash-on-Cash Return
4.7%
Cap rate
0.7%
Rent to Value Ratio
Active
$437,000
4
bds
|
3
ba
|
1,650
sqft
|
built
1920
16 Spruce St, Westfield, MA 01085
$-464
Cash flow
-5.5%
Cash-on-Cash Return
4.4%
Cap rate
0.7%
Rent to Value Ratio
Active
$319,900
4
bds
|
4
ba
|
1,764
sqft
|
built
1986
28-30 Aster St, Springfield, MA 01109
$-78
Cash flow
-1.3%
Cash-on-Cash Return
5.4%
Cap rate
0.8%
Rent to Value Ratio
Active
$239,900
2
bds
|
2
ba
|
1,214
sqft
|
built
1987
51 Morse St, Ludlow, MA 01056
$-252
Cash flow
-5.5%
Cash-on-Cash Return
4.4%
Cap rate
0.8%
Rent to Value Ratio
Active
$325,000
3
bds
|
2
ba
|
1,160
sqft
|
built
1959
98 Mildred Ave, Springfield, MA 01104
$-149
Cash flow
-2.4%
Cash-on-Cash Return
5.1%
Cap rate
0.8%
Rent to Value Ratio
Active
$309,900
2
bds
|
2
ba
|
1,165
sqft
|
built
1999
665 Center St, Ludlow, MA 01056
$-735
Cash flow
-12.4%
Cash-on-Cash Return
2.8%
Cap rate
0.7%
Rent to Value Ratio
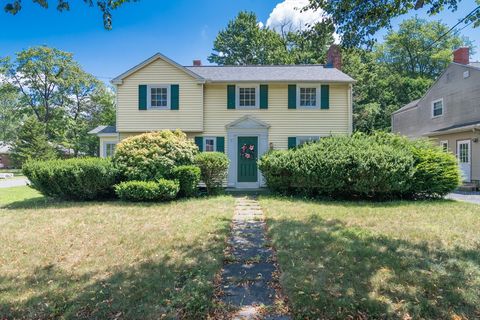
Active
$375,000
4
bds
|
2
ba
|
1,778
sqft
|
built
1922
53 Bronson Ter, Springfield, MA 01108
$-195
Cash flow
-2.7%
Cash-on-Cash Return
5.1%
Cap rate
0.7%
Rent to Value Ratio
Active
$474,900
4
bds
|
2
ba
|
2,150
sqft
|
built
1986
1085 N Street Ext, Feeding Hills, MA 01030
$-898
Cash flow
-9.9%
Cash-on-Cash Return
3.4%
Cap rate
0.5%
Rent to Value Ratio
Active
$425,000
2
bds
|
1
ba
|
1,350
sqft
|
built
1973
73 Ingell Rd, Chester, MA 01011
$-676
Cash flow
-8.3%
Cash-on-Cash Return
3.8%
Cap rate
0.6%
Rent to Value Ratio
Active
$269,900
2
bds
|
1
ba
|
864
sqft
|
built
1950
24 Blanchard St, Chicopee, MA 01020
$-112
Cash flow
-2.2%
Cash-on-Cash Return
5.2%
Cap rate
0.8%
Rent to Value Ratio
Active
$570,000
5
bds
|
2
ba
|
2,886
sqft
|
built
1984
291 Pochassic Rd, Westfield, MA 01085
$-884
Cash flow
-8.1%
Cash-on-Cash Return
3.8%
Cap rate
0.6%
Rent to Value Ratio
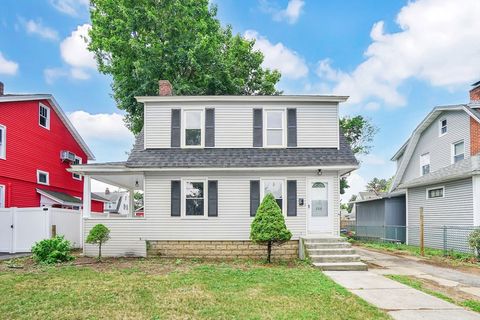
Active
$293,500
3
bds
|
1
ba
|
1,053
sqft
|
built
1971
17 Jeanne Marie St, Springfield, MA 01129
$-201
Cash flow
-3.6%
Cash-on-Cash Return
4.9%
Cap rate
0.7%
Rent to Value Ratio
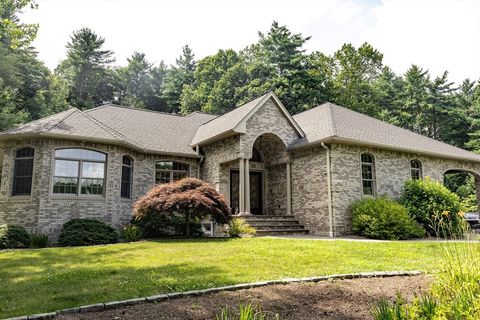
Active
$599,000
4
bds
|
4
ba
|
2,690
sqft
|
built
1947
68 Monson Rd, Wilbraham, MA 01095
$-1,491
Cash flow
-13.0%
Cash-on-Cash Return
2.7%
Cap rate
0.5%
Rent to Value Ratio
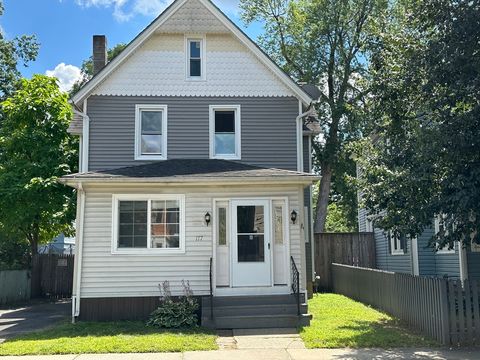
Active
$269,900
3
bds
|
2
ba
|
1,276
sqft
|
built
1896
177 Johnson St, Springfield, MA 01108
$-25
Cash flow
-0.5%
Cash-on-Cash Return
5.6%
Cap rate
0.8%
Rent to Value Ratio
Active
$400,000
7
bds
|
3
ba
|
2,872
sqft
|
built
1900
14 Squier St, Palmer, MA 01069
$-179
Cash flow
-2.3%
Cash-on-Cash Return
5.1%
Cap rate
0.8%
Rent to Value Ratio
Active
$384,900
3
bds
|
2
ba
|
1,788
sqft
|
built
1947
445 Roosevelt Ave, Springfield, MA 01118
$-411
Cash flow
-5.6%
Cash-on-Cash Return
4.4%
Cap rate
0.7%
Rent to Value Ratio
Active
$284,999
3
bds
|
1
ba
|
1,562
sqft
|
built
1919
40 Eldridge St, Springfield, MA 01108
$-86
Cash flow
-1.6%
Cash-on-Cash Return
5.3%
Cap rate
0.8%
Rent to Value Ratio
Active
$349,950
4
bds
|
2
ba
|
1,742
sqft
|
built
1920
17 Sunnymeade Ave, Chicopee, MA 01020
$-463
Cash flow
-6.9%
Cash-on-Cash Return
4.1%
Cap rate
0.6%
Rent to Value Ratio
Active
$595,000
7
bds
|
7
ba
|
3,606
sqft
|
built
1900
265 Union St, Springfield, MA 01105
$-1,611
Cash flow
-14.1%
Cash-on-Cash Return
2.4%
Cap rate
0.4%
Rent to Value Ratio
Active
$399,000
3
bds
|
2
ba
|
2,136
sqft
|
built
1960
102 W Meadowview Rd, Holyoke, MA 01040
$-465
Cash flow
-6.1%
Cash-on-Cash Return
4.3%
Cap rate
0.7%
Rent to Value Ratio
Active
$314,900
3
bds
|
2
ba
|
1,332
sqft
|
built
1928
208 Osborne Ter, Springfield, MA 01104
$-125
Cash flow
-2.1%
Cash-on-Cash Return
5.2%
Cap rate
0.8%
Rent to Value Ratio
Active
$274,500
2
bds
|
1
ba
|
1,113
sqft
|
built
1941
14 Norman St, Chicopee, MA 01013
$-198
Cash flow
-3.8%
Cash-on-Cash Return
4.8%
Cap rate
0.7%
Rent to Value Ratio
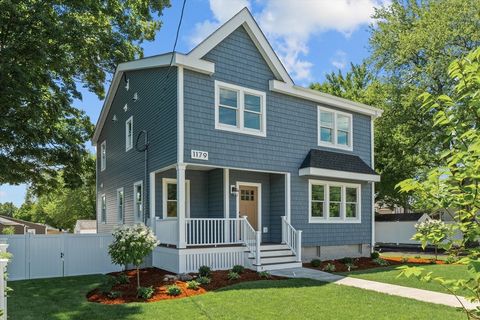
Active
$599,900
5
bds
|
3
ba
|
3,235
sqft
|
built
2025
1179 Bay St, Springfield, MA 01109
$-1,193
Cash flow
-10.4%
Cash-on-Cash Return
3.3%
Cap rate
0.4%
Rent to Value Ratio
Active
$369,900
5
bds
|
2
ba
|
2,272
sqft
|
built
1925
148 Point Grove Rd, Southwick, MA 01077
$-333
Cash flow
-4.7%
Cash-on-Cash Return
4.6%
Cap rate
0.8%
Rent to Value Ratio
Active
$779,000
3
bds
|
2
ba
|
2,680
sqft
|
built
2007
357 Westerly Cir, Ludlow, MA 01056
$-2,118
Cash flow
-14.2%
Cash-on-Cash Return
2.4%
Cap rate
0.4%
Rent to Value Ratio
Active
$305,000
3
bds
|
2
ba
|
1,424
sqft
|
built
1937
115 Abbott St, Springfield, MA 01118
$-113
Cash flow
-1.9%
Cash-on-Cash Return
5.2%
Cap rate
0.8%
Rent to Value Ratio
Active
$369,987
4
bds
|
2
ba
|
1,880
sqft
|
built
1911
50-52 Sycamore St, Springfield, MA 01109
$-321
Cash flow
-4.5%
Cash-on-Cash Return
4.6%
Cap rate
0.7%
Rent to Value Ratio
Active
$499,900
3
bds
|
3
ba
|
1,977
sqft
|
built
1988
74 Ray St, Ludlow, MA 01056
$-911
Cash flow
-9.5%
Cash-on-Cash Return
3.5%
Cap rate
0.6%
Rent to Value Ratio
Active
$899,500
3
bds
|
2
ba
|
2,427
sqft
|
built
1987
780 Birnie Ave, West Springfield, MA 01089
$-2,662
Cash flow
-15.4%
Cash-on-Cash Return
2.1%
Cap rate
0.4%
Rent to Value Ratio
Active
$419,900
3
bds
|
2
ba
|
1,700
sqft
|
built
1969
86 Birnie Ave, West Springfield, MA 01089
$-802
Cash flow
-10.0%
Cash-on-Cash Return
3.4%
Cap rate
0.5%
Rent to Value Ratio
Active
$665,000
4
bds
|
4
ba
|
3,105
sqft
|
built
1967
59 Lawrence Dr, Longmeadow, MA 01106
$-1,602
Cash flow
-12.6%
Cash-on-Cash Return
2.8%
Cap rate
0.6%
Rent to Value Ratio
Active
$899,900
3
bds
|
3
ba
|
3,564
sqft
|
built
1950
92 Eton Rd, Longmeadow, MA 01106
$-2,643
Cash flow
-15.3%
Cash-on-Cash Return
2.2%
Cap rate
0.5%
Rent to Value Ratio
Active
$689,900
3
bds
|
3
ba
|
2,071
sqft
|
built
1964
355 Miller St, Ludlow, MA 01056
$-1,515
Cash flow
-11.5%
Cash-on-Cash Return
3.0%
Cap rate
0.5%
Rent to Value Ratio

Active
$250,000
2
bds
|
1
ba
|
890
sqft
|
built
1928
177 Jamaica St, Springfield, MA 01119
$24
Cash flow
0.5%
Cash-on-Cash Return
5.8%
Cap rate
0.8%
Rent to Value Ratio
Active
$339,987
6
bds
|
2
ba
|
2,592
sqft
|
built
1923
392-394 Carew St, Springfield, MA 01104
$-13
Cash flow
-0.2%
Cash-on-Cash Return
5.6%
Cap rate
0.8%
Rent to Value Ratio