Suffolk County Investment Properties for Sale
Browse homes for sale and investment properties in Suffolk County. Refine your search by price, property type, or more.
Best cash flowing properties in Suffolk County
Active
$290,000
2
bds
|
1
ba
|
810
sqft
|
built
1960
175 Clare Ave, Boston, MA 02136
$-363
Cash flow
-6.5%
Cash-on-Cash Return
4.2%
Cap rate
0.9%
Rent to Value Ratio

Active
$465,000
2
bds
|
1
ba
|
755
sqft
|
built
1973
357 Faneuil St, Boston, MA 02135
$-379
Cash flow
-4.3%
Cash-on-Cash Return
4.7%
Cap rate
0.7%
Rent to Value Ratio
505 out of 847 properties for sale in Suffolk County
Limited Results Shown
Create a free account, or log in to reveal all property listings and enjoy the complete experience.
Active
$1,300,000
5
bds
|
3
ba
|
3,493
sqft
|
built
1950
21 Glenley Ter, Boston, MA 02135
$-2,293
Cash flow
-9.2%
Cash-on-Cash Return
3.6%
Cap rate
0.6%
Rent to Value Ratio

Active
$629,000
4
bds
|
3
ba
|
1,690
sqft
|
built
1885
114 Wrentham St, Boston, MA 02124
$-1,176
Cash flow
-9.8%
Cash-on-Cash Return
3.4%
Cap rate
0.6%
Rent to Value Ratio
Active
$3,195,000
3
bds
|
3
ba
|
2,113
sqft
|
built
2018
10 Farnsworth St, Boston, MA 02210
$-11,690
Cash flow
-19.1%
Cash-on-Cash Return
1.3%
Cap rate
0.3%
Rent to Value Ratio
Active
$1,495,000
2
bds
|
2
ba
|
1,300
sqft
|
built
2013
580 Washington St, Boston, MA 02111
$-5,880
Cash flow
-20.5%
Cash-on-Cash Return
1.0%
Cap rate
0.4%
Rent to Value Ratio
Active
$799,000
3
bds
|
1
ba
|
986
sqft
|
built
1900
705 Massachusetts Ave, Boston, MA 02118
$-1,944
Cash flow
-12.7%
Cash-on-Cash Return
2.8%
Cap rate
0.6%
Rent to Value Ratio
Active
$469,900
0
bds
|
1
ba
|
500
sqft
|
built
2015
45 1st Ave, Boston, MA 02129
$-1,352
Cash flow
-15.0%
Cash-on-Cash Return
2.2%
Cap rate
0.5%
Rent to Value Ratio
Active
$485,000
1
bds
|
1
ba
|
400
sqft
|
built
1976
12 Stoneholm St, Boston, MA 02115
$-1,445
Cash flow
-15.5%
Cash-on-Cash Return
2.1%
Cap rate
0.5%
Rent to Value Ratio

Active
$625,000
3
bds
|
1
ba
|
1,096
sqft
|
built
1900
700 Broadway, Revere, MA 02151
$-877
Cash flow
-7.3%
Cash-on-Cash Return
4.0%
Cap rate
0.6%
Rent to Value Ratio
Active
$640,000
3
bds
|
2
ba
|
1,373
sqft
|
built
1890
10 Elwood Pl, Revere, MA 02151
$-956
Cash flow
-7.8%
Cash-on-Cash Return
3.9%
Cap rate
0.6%
Rent to Value Ratio
Active
$595,000
3
bds
|
1
ba
|
1,260
sqft
|
built
1905
381 Adams St, Boston, MA 02122
$-1,215
Cash flow
-10.7%
Cash-on-Cash Return
3.2%
Cap rate
0.5%
Rent to Value Ratio
Active
$1,150,000
7
bds
|
3
ba
|
2,670
sqft
|
built
1905
161 Westville St, Boston, MA 02122
$-3,862
Cash flow
-17.5%
Cash-on-Cash Return
1.6%
Cap rate
0.3%
Rent to Value Ratio
Active
$1,089,000
2
bds
|
2
ba
|
1,800
sqft
|
built
1890
90 South St, Boston, MA 02111
$-2,601
Cash flow
-12.5%
Cash-on-Cash Return
2.8%
Cap rate
0.5%
Rent to Value Ratio
Active
$775,000
4
bds
|
3
ba
|
2,216
sqft
|
built
1883
101 Mount Pleasant Ave, Boston, MA 02119
$-769
Cash flow
-5.2%
Cash-on-Cash Return
4.5%
Cap rate
0.6%
Rent to Value Ratio
Active
$515,000
1
bds
|
1
ba
|
500
sqft
|
built
1920
39 Hemenway St, Boston, MA 02115
$-1,269
Cash flow
-12.9%
Cash-on-Cash Return
2.7%
Cap rate
0.6%
Rent to Value Ratio
Active
$949,999
6
bds
|
3
ba
|
4,291
sqft
|
built
1900
151 Blue Hill Ave, Boston, MA 02119
$-1,234
Cash flow
-6.8%
Cash-on-Cash Return
4.1%
Cap rate
0.6%
Rent to Value Ratio
Active
$2,350,000
2
bds
|
3
ba
|
1,375
sqft
|
built
1880
273 Commonwealth Ave, Boston, MA 02116
$-8,375
Cash flow
-18.6%
Cash-on-Cash Return
1.4%
Cap rate
0.3%
Rent to Value Ratio
Active
$1,099,900
5
bds
|
3
ba
|
2,253
sqft
|
built
1910
82 Bremen St, Boston, MA 02128
$-3,496
Cash flow
-16.6%
Cash-on-Cash Return
1.9%
Cap rate
0.3%
Rent to Value Ratio
Active
$1,449,999
3
bds
|
3
ba
|
1,580
sqft
|
built
1890
597 E 2nd St, Boston, MA 02127
$-4,835
Cash flow
-17.4%
Cash-on-Cash Return
1.7%
Cap rate
0.3%
Rent to Value Ratio
Active
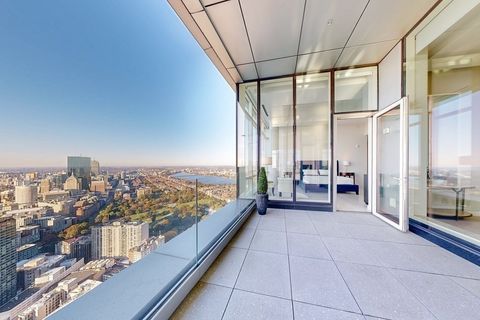
$1,749,000
2
bds
|
2
ba
|
1,024
sqft
|
built
2018
135 Seaport Blvd, Boston, MA 02210
$-6,057
Cash flow
-18.1%
Cash-on-Cash Return
1.5%
Cap rate
0.5%
Rent to Value Ratio
Active
$750,000
2
bds
|
2
ba
|
860
sqft
|
built
1905
42 Vinton St, Boston, MA 02127
$-2,154
Cash flow
-15.0%
Cash-on-Cash Return
2.2%
Cap rate
0.5%
Rent to Value Ratio
Active
$799,999
5
bds
|
2
ba
|
2,392
sqft
|
built
1895
30 Massasoit St, Boston, MA 02136
$-893
Cash flow
-5.8%
Cash-on-Cash Return
4.3%
Cap rate
0.6%
Rent to Value Ratio
Active
$729,000
3
bds
|
2
ba
|
1,250
sqft
|
built
1960
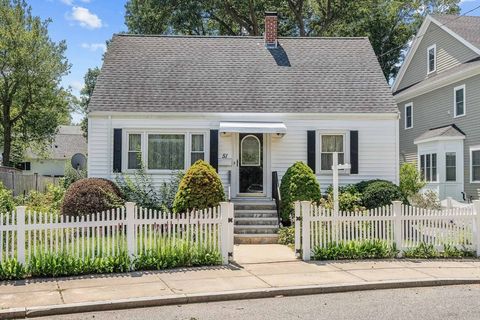
51 Ledge Hill Rd, Boston, MA 02132
$-1,095
Cash flow
-7.8%
Cash-on-Cash Return
3.9%
Cap rate
0.5%
Rent to Value Ratio
Active
$7,495,000
3
bds
|
5
ba
|
3,435
sqft
|
built
2016
1 Franklin St, Boston, MA 02110
$-44,140
Cash flow
-30.7%
Cash-on-Cash Return
-1.4%
Cap rate
0.1%
Rent to Value Ratio
Active
$729,000
3
bds
|
3
ba
|
2,137
sqft
|
built
1940
116 Almont St, Boston, MA 02126
$-1,682
Cash flow
-12.0%
Cash-on-Cash Return
2.9%
Cap rate
0.4%
Rent to Value Ratio
Active
$949,000
2
bds
|
1
ba
|
892
sqft
|
built
1900
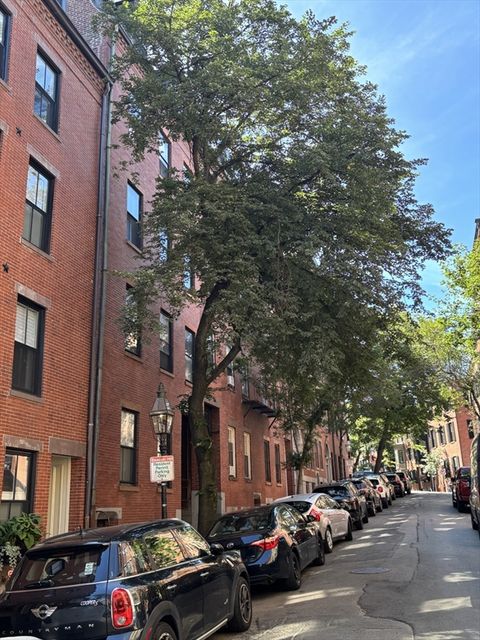
59 W Cedar St, Boston, MA 02114
$-2,685
Cash flow
-14.8%
Cash-on-Cash Return
2.3%
Cap rate
0.5%
Rent to Value Ratio
Active
$338,900
1
bds
|
1
ba
|
283
sqft
|
built
1920
88 Gordon St, Boston, MA 02135
$-782
Cash flow
-12.0%
Cash-on-Cash Return
2.9%
Cap rate
0.6%
Rent to Value Ratio
Active
$1,400,000
9
bds
|
3
ba
|
3,114
sqft
|
built
1905
29 Torrey St, Boston, MA 02124
$-4,833
Cash flow
-18.0%
Cash-on-Cash Return
1.5%
Cap rate
0.3%
Rent to Value Ratio

Active
$1,499,000
6
bds
|
4
ba
|
3,479
sqft
|
built
1889
31 Alaska St, Boston, MA 02119
$-4,924
Cash flow
-17.1%
Cash-on-Cash Return
1.7%
Cap rate
0.3%
Rent to Value Ratio
Active
$465,000
2
bds
|
2
ba
|
1,055
sqft
|
built
1986
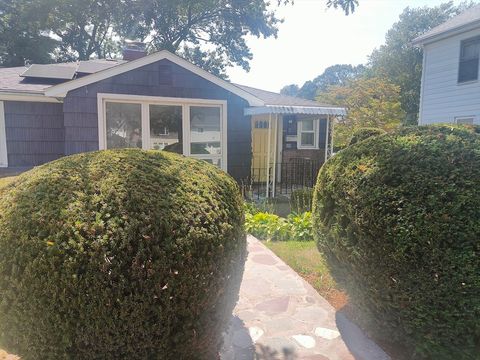
4975 Washington St, Boston, MA 02132
$-1,157
Cash flow
-13.0%
Cash-on-Cash Return
2.7%
Cap rate
0.6%
Rent to Value Ratio
Active
$6,295,000
2
bds
|
3
ba
|
2,226
sqft
|
built
2015
1 Dalton St, Boston, MA 02115
$-32,947
Cash flow
-27.3%
Cash-on-Cash Return
-0.6%
Cap rate
0.1%
Rent to Value Ratio
Active
$1,600,000
7
bds
|
3
ba
|
3,416
sqft
|
built
1890
77 Bailey St, Boston, MA 02124
$-6,053
Cash flow
-19.7%
Cash-on-Cash Return
1.1%
Cap rate
0.2%
Rent to Value Ratio
Active
$779,995
3
bds
|
2
ba
|
1,548
sqft
|
built
1910
15 Madison St, Boston, MA 02136
$-1,957
Cash flow
-13.1%
Cash-on-Cash Return
2.7%
Cap rate
0.4%
Rent to Value Ratio

Active
$444,900
1
bds
|
1
ba
|
600
sqft
|
built
1930
137 Englewood Ave, Boston, MA 02135
$-1,353
Cash flow
-15.9%
Cash-on-Cash Return
2.0%
Cap rate
0.6%
Rent to Value Ratio
Active
$375,000
2
bds
|
1
ba
|
660
sqft
|
built
1920
57 Brighton Ave, Boston, MA 02134
$-672
Cash flow
-9.3%
Cash-on-Cash Return
3.5%
Cap rate
0.7%
Rent to Value Ratio
Active
$820,000
5
bds
|
3
ba
|
2,264
sqft
|
built
1920
44 Evans St, Boston, MA 02124
$-1,238
Cash flow
-7.9%
Cash-on-Cash Return
3.9%
Cap rate
0.6%
Rent to Value Ratio
Active
$949,000
6
bds
|
2
ba
|
3,634
sqft
|
built
1900
330 Washington Ave, Chelsea, MA 02150
$-3,166
Cash flow
-17.4%
Cash-on-Cash Return
1.7%
Cap rate
0.3%
Rent to Value Ratio
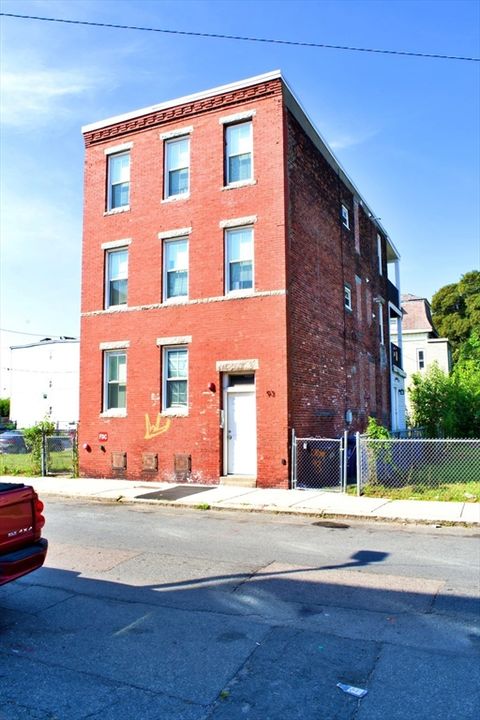
Active
$1,250,000
8
bds
|
3
ba
|
2,560
sqft
|
built
1891
93 George St, Boston, MA 02119
$-4,000
Cash flow
-16.7%
Cash-on-Cash Return
1.8%
Cap rate
0.3%
Rent to Value Ratio
Active
$2,400,000
4
bds
|
4
ba
|
3,200
sqft
|
built
2025
2 Brownson Ter, Boston, MA 02130
$-5,512
Cash flow
-12.0%
Cash-on-Cash Return
2.9%
Cap rate
0.4%
Rent to Value Ratio