Suffolk County Investment Properties for Sale
Browse homes for sale and investment properties in Suffolk County. Refine your search by price, property type, or more.
Best cash flowing properties in Suffolk County

Active
$688,000
5
bds
|
2
ba
|
1,640
sqft
|
built
1900
93 Bellingham Ave, Revere, MA 02151
$-615
Cash flow
-4.7%
Cash-on-Cash Return
4.6%
Cap rate
0.7%
Rent to Value Ratio
Active
$469,999
1
bds
|
1
ba
|
570
sqft
|
built
1910
838 E Broadway, Boston, MA 02127
$-786
Cash flow
-8.7%
Cash-on-Cash Return
3.7%
Cap rate
0.6%
Rent to Value Ratio
660 out of 1,152 properties for sale in Suffolk County
Limited Results Shown
Create a free account, or log in to reveal all property listings and enjoy the complete experience.
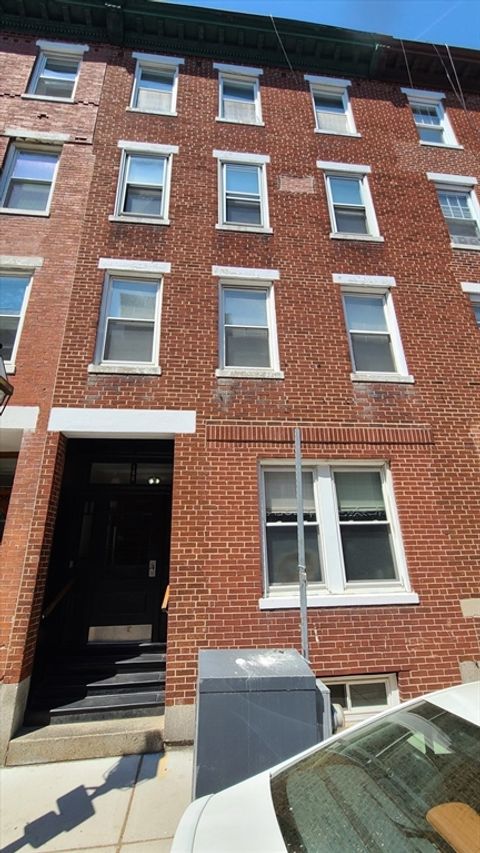
Active
$1,050,000
8
bds
|
2
ba
|
3,624
sqft
|
built
1880
88 Trenton St, Boston, MA 02128
$-3,681
Cash flow
-18.3%
Cash-on-Cash Return
1.5%
Cap rate
0.3%
Rent to Value Ratio

Active
$625,000
1
bds
|
1
ba
|
594
sqft
|
built
2019
65 Lewis St, Boston, MA 02128
$-1,532
Cash flow
-12.8%
Cash-on-Cash Return
2.7%
Cap rate
0.6%
Rent to Value Ratio

Active
$1,825,000
2
bds
|
2
ba
|
1,445
sqft
|
built
1880
116 Commonwealth Ave, Boston, MA 02116
$-5,855
Cash flow
-16.7%
Cash-on-Cash Return
1.8%
Cap rate
0.4%
Rent to Value Ratio
Active
$1,250,000
3
bds
|
3
ba
|
2,385
sqft
|
built
1912
198 Byron St, Boston, MA 02128
$-3,794
Cash flow
-15.8%
Cash-on-Cash Return
2.0%
Cap rate
0.4%
Rent to Value Ratio
Active
$1,349,000
2
bds
|
2
ba
|
1,040
sqft
|
built
2009
110 Stuart St, Boston, MA 02116
$-4,498
Cash flow
-17.4%
Cash-on-Cash Return
1.7%
Cap rate
0.4%
Rent to Value Ratio
Active
$649,900
2
bds
|
2
ba
|
1,268
sqft
|
built
1923
336 Saratoga St, Boston, MA 02128
$-1,541
Cash flow
-12.4%
Cash-on-Cash Return
2.8%
Cap rate
0.5%
Rent to Value Ratio
Active
$1,075,000
2
bds
|
3
ba
|
1,784
sqft
|
built
2006
3 Avery St, Boston, MA 02111
$-1,115
Cash flow
-5.4%
Cash-on-Cash Return
4.4%
Cap rate
0.7%
Rent to Value Ratio
Active
$1,495,000
2
bds
|
3
ba
|
1,402
sqft
|
built
2000
1 Avery St, Boston, MA 02111
$-5,466
Cash flow
-19.1%
Cash-on-Cash Return
1.3%
Cap rate
0.5%
Rent to Value Ratio

Active
$1,795,000
2
bds
|
2
ba
|
1,719
sqft
|
built
1920
437 D St, Boston, MA 02210
$-6,290
Cash flow
-18.3%
Cash-on-Cash Return
1.5%
Cap rate
0.4%
Rent to Value Ratio

Active
$5,499,000
2
bds
|
3
ba
|
2,440
sqft
|
built
1988
300 Boylston St, Boston, MA 02116
$-30,089
Cash flow
-28.5%
Cash-on-Cash Return
-0.9%
Cap rate
0.1%
Rent to Value Ratio

Active
$515,000
1
bds
|
1
ba
|
415
sqft
|
built
1910
8 Garrison St, Boston, MA 02116
$-1,349
Cash flow
-13.7%
Cash-on-Cash Return
2.5%
Cap rate
0.5%
Rent to Value Ratio
Active
$1,750,000
8
bds
|
3
ba
|
2,808
sqft
|
built
1910
54 I St, Boston, MA 02127
$-6,171
Cash flow
-18.4%
Cash-on-Cash Return
1.4%
Cap rate
0.3%
Rent to Value Ratio
Active
$8,800,000
6
bds
|
10
ba
|
5,556
sqft
|
built
1899
101 Pinckney St, Boston, MA 02114
$-41,569
Cash flow
-24.6%
Cash-on-Cash Return
0.0%
Cap rate
0.1%
Rent to Value Ratio
Active
$1,300,000
11
bds
|
4
ba
|
3,480
sqft
|
built
1912
98 Topliff St, Boston, MA 02122
$-4,533
Cash flow
-18.2%
Cash-on-Cash Return
1.5%
Cap rate
0.3%
Rent to Value Ratio
Active
$1,200,000
9
bds
|
4
ba
|
3,091
sqft
|
built
1920
64 Stockton St, Boston, MA 02124
$-3,707
Cash flow
-16.1%
Cash-on-Cash Return
2.0%
Cap rate
0.3%
Rent to Value Ratio
Active
$924,900
6
bds
|
3
ba
|
3,672
sqft
|
built
1915
12 Spencer St, Boston, MA 02124
$-2,426
Cash flow
-13.7%
Cash-on-Cash Return
2.5%
Cap rate
0.4%
Rent to Value Ratio

Active
$2,250,000
2
bds
|
3
ba
|
1,423
sqft
|
built
2016
1 Franklin St, Boston, MA 02110
$-8,385
Cash flow
-19.4%
Cash-on-Cash Return
1.2%
Cap rate
0.4%
Rent to Value Ratio
Active
$8,977,500
3
bds
|
5
ba
|
4,110
sqft
|
built
2016
1 Franklin St, Boston, MA 02110
$-52,090
Cash flow
-30.3%
Cash-on-Cash Return
-1.3%
Cap rate
0.1%
Rent to Value Ratio
Active
$1,425,000
2
bds
|
2
ba
|
1,019
sqft
|
built
2003
165 Tremont St, Boston, MA 02111
$-5,477
Cash flow
-20.1%
Cash-on-Cash Return
1.1%
Cap rate
0.4%
Rent to Value Ratio

Active
$415,000
1
bds
|
1
ba
|
527
sqft
|
built
1930
1669 Commonwealth Ave, Boston, MA 02135
$-959
Cash flow
-12.1%
Cash-on-Cash Return
2.9%
Cap rate
0.6%
Rent to Value Ratio
Active
$1,229,000
11
bds
|
3
ba
|
4,010
sqft
|
built
1925
44 Floyd St, Boston, MA 02124
$-4,836
Cash flow
-20.5%
Cash-on-Cash Return
1.0%
Cap rate
0.2%
Rent to Value Ratio

Active
$399,000
2
bds
|
1
ba
|
677
sqft
|
built
1900
221 Shurtleff St, Chelsea, MA 02150
$-910
Cash flow
-11.9%
Cash-on-Cash Return
2.9%
Cap rate
0.6%
Rent to Value Ratio
Active
$659,000
2
bds
|
2
ba
|
1,212
sqft
|
built
1987
376 Ocean Ave, Revere, MA 02151
$-2,218
Cash flow
-17.6%
Cash-on-Cash Return
1.6%
Cap rate
0.5%
Rent to Value Ratio
Active
$699,000
3
bds
|
3
ba
|
1,513
sqft
|
built
1924
33 Shannon St, Boston, MA 02135
$-1,860
Cash flow
-13.9%
Cash-on-Cash Return
2.5%
Cap rate
0.5%
Rent to Value Ratio
Active
$1,795,000
2
bds
|
3
ba
|
1,557
sqft
|
built
2006
500 Atlantic Ave, Boston, MA 02210
$-6,913
Cash flow
-20.1%
Cash-on-Cash Return
1.1%
Cap rate
0.5%
Rent to Value Ratio
Active
$2,995,000
3
bds
|
3
ba
|
1,860
sqft
|
built
1930
113 Commonwealth Ave, Boston, MA 02116
$-11,398
Cash flow
-19.9%
Cash-on-Cash Return
1.1%
Cap rate
0.3%
Rent to Value Ratio
Active
$1,769,000
2
bds
|
3
ba
|
2,037
sqft
|
built
2017
469 E 4th St, Boston, MA 02127
$-4,275
Cash flow
-12.6%
Cash-on-Cash Return
2.8%
Cap rate
0.4%
Rent to Value Ratio

Active
$710,000
1
bds
|
1
ba
|
732
sqft
|
built
2020
50 Hichborn St, Boston, MA 02135
$-2,295
Cash flow
-16.9%
Cash-on-Cash Return
1.8%
Cap rate
0.4%
Rent to Value Ratio
Active
$4,990,000
3
bds
|
5
ba
|
3,102
sqft
|
built
1999
1 Huntington Ave, Boston, MA 02116
$-27,843
Cash flow
-29.1%
Cash-on-Cash Return
-1.0%
Cap rate
0.2%
Rent to Value Ratio
Active
$3,125,000
12
bds
|
5
ba
|
3,700
sqft
|
built
1900
168 Endicott St, Boston, MA 02113
$-140,303
Cash flow
-234.2%
Cash-on-Cash Return
-48.2%
Cap rate
0.2%
Rent to Value Ratio
Active
$1,755,000
2
bds
|
2
ba
|
1,161
sqft
|
built
2016
1 Franklin St, Boston, MA 02110
$-4,900
Cash flow
-14.6%
Cash-on-Cash Return
2.3%
Cap rate
0.4%
Rent to Value Ratio
Active
$1,100,000
1
bds
|
1
ba
|
670
sqft
|
built
2019
135 Seaport Blvd, Boston, MA 02210
$-4,313
Cash flow
-20.5%
Cash-on-Cash Return
1.0%
Cap rate
0.4%
Rent to Value Ratio
Active
$4,500,000
3
bds
|
3
ba
|
2,590
sqft
|
built
1899
392 Marlborough St, Boston, MA 02115
$-19,423
Cash flow
-22.5%
Cash-on-Cash Return
0.5%
Cap rate
0.2%
Rent to Value Ratio
Active
$2,395,000
2
bds
|
2
ba
|
1,296
sqft
|
built
2018
188 Brookline Ave, Boston, MA 02215
$-7,992
Cash flow
-17.4%
Cash-on-Cash Return
1.7%
Cap rate
0.4%
Rent to Value Ratio
Active
$1,650,000
9
bds
|
6
ba
|
3,552
sqft
|
built
1890
35 Adamson St, Boston, MA 02134
$-5,741
Cash flow
-18.2%
Cash-on-Cash Return
1.5%
Cap rate
0.3%
Rent to Value Ratio

Active
$3,400,000
2
bds
|
3
ba
|
1,745
sqft
|
built
2016
1 Franklin St, Boston, MA 02110
$-15,225
Cash flow
-23.4%
Cash-on-Cash Return
0.3%
Cap rate
0.3%
Rent to Value Ratio
Active
$998,888
1
bds
|
1
ba
|
798
sqft
|
built
2016
1 Franklin St, Boston, MA 02110
$-3,401
Cash flow
-17.8%
Cash-on-Cash Return
1.6%
Cap rate
0.4%
Rent to Value Ratio
Active
$2,090,000
2
bds
|
3
ba
|
1,794
sqft
|
built
2008
110 Stuart St, Boston, MA 02116
$-7,107
Cash flow
-17.7%
Cash-on-Cash Return
1.6%
Cap rate
0.5%
Rent to Value Ratio