Suffolk County Investment Properties for Sale
Browse homes for sale and investment properties in Suffolk County. Refine your search by price, property type, or more.
Best cash flowing properties in Suffolk County
Active
$150,000
bds
|
0
ba
|
180
sqft
|
built
1900
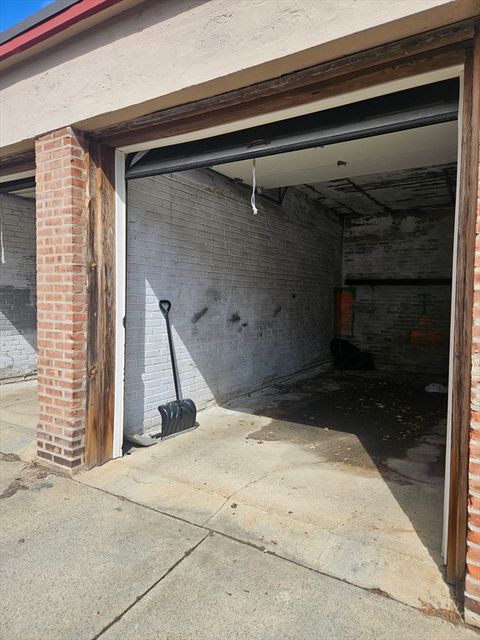
400-R K, Boston, MA 02127
$0
Cash flow
n/a
Cash-on-Cash Return
n/a
Cap rate
n/a
Rent to Value Ratio
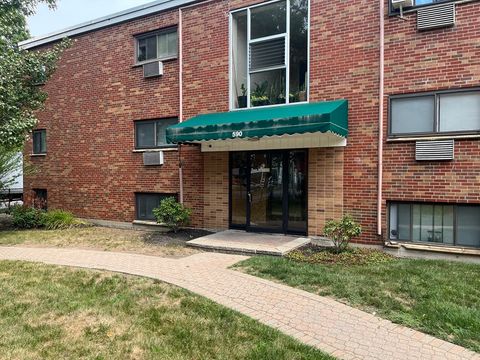
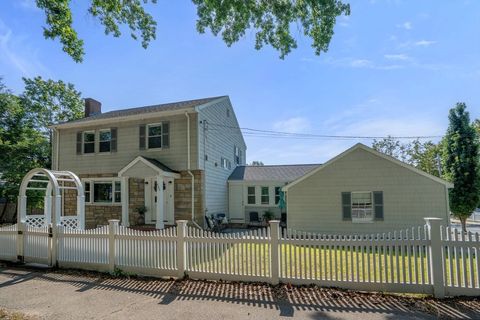
Active
$410,000
2
bds
|
1
ba
|
720
sqft
|
built
1965
590 American Legion Hwy, Boston, MA 02131
$-877
Cash flow
-11.2%
Cash-on-Cash Return
3.1%
Cap rate
0.6%
Rent to Value Ratio
589 out of 1,004 properties for sale in Suffolk County
Limited Results Shown
Create a free account, or log in to reveal all property listings and enjoy the complete experience.
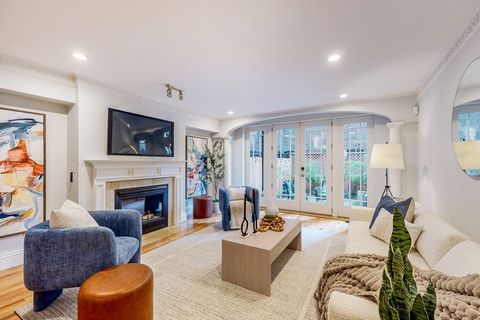
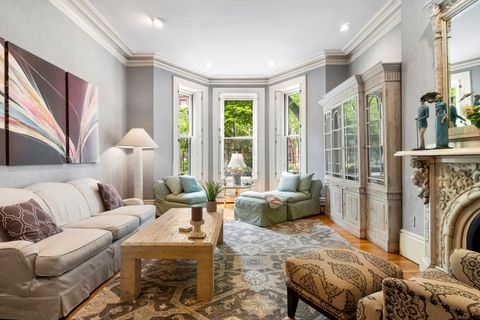
Active
$1,599,000
2
bds
|
3
ba
|
1,405
sqft
|
built
1910
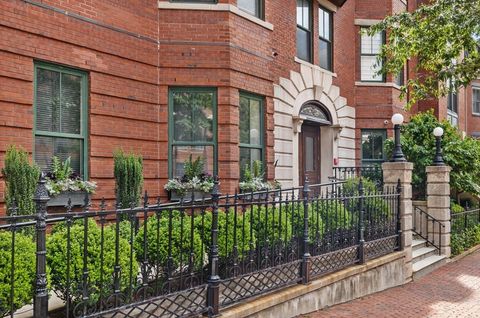
44 Dartmouth St, Boston, MA 02116
$-4,112
Cash flow
-13.4%
Cash-on-Cash Return
2.6%
Cap rate
0.4%
Rent to Value Ratio
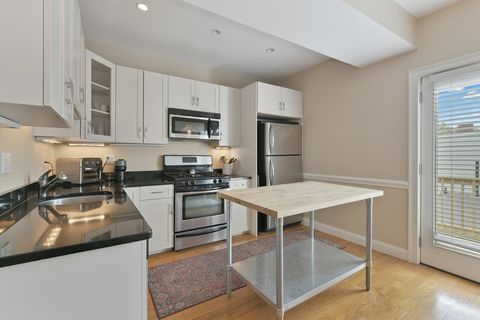
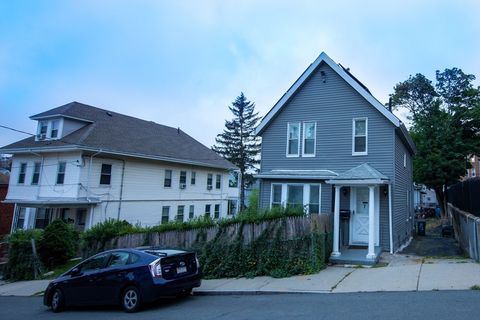
Active
$739,000
2
bds
|
1
ba
|
710
sqft
|
built
1900
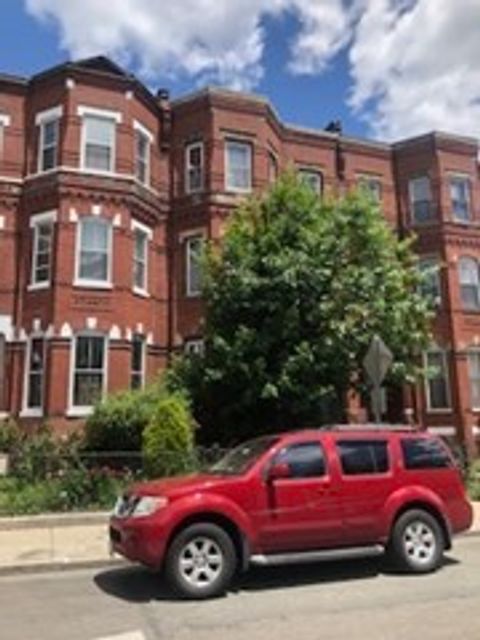
161 H St, Boston, MA 02127
$-1,730
Cash flow
-12.2%
Cash-on-Cash Return
2.9%
Cap rate
0.5%
Rent to Value Ratio
Active
$795,000
3
bds
|
3
ba
|
1,956
sqft
|
built
1935
840 Vfw Pkwy, Boston, MA 02132
$-1,692
Cash flow
-11.1%
Cash-on-Cash Return
3.1%
Cap rate
0.5%
Rent to Value Ratio
Active
$642,700
4
bds
|
2
ba
|
1,335
sqft
|
built
1910
7 Ingleside Ave, Chelsea, MA 02150
$-1,273
Cash flow
-10.3%
Cash-on-Cash Return
3.3%
Cap rate
0.5%
Rent to Value Ratio
Active
$2,900,000
3
bds
|
3
ba
|
1,809
sqft
|
built
1890
319 Marlborough St, Boston, MA 02116
$-9,615
Cash flow
-17.3%
Cash-on-Cash Return
1.7%
Cap rate
0.3%
Rent to Value Ratio
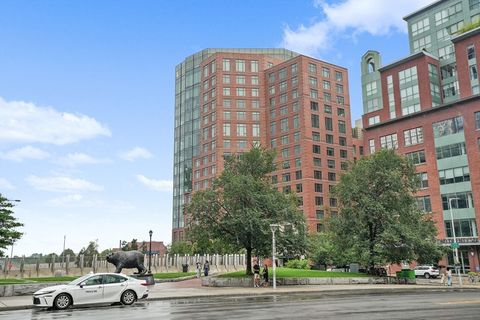
Active
$775,000
1
bds
|
1
ba
|
736
sqft
|
built
2017
100 Lovejoy Wharf, Boston, MA 02114
$-2,569
Cash flow
-17.3%
Cash-on-Cash Return
1.7%
Cap rate
0.5%
Rent to Value Ratio
Active
$370,000
1
bds
|
1
ba
|
296
sqft
|
built
1920
51 Park Dr, Boston, MA 02215
$-1,037
Cash flow
-14.6%
Cash-on-Cash Return
2.3%
Cap rate
0.5%
Rent to Value Ratio
Active
$675,000
2
bds
|
1
ba
|
988
sqft
|
built
1920
76-78 Brookley Rd, Boston, MA 02130
$-1,799
Cash flow
-13.9%
Cash-on-Cash Return
2.5%
Cap rate
0.5%
Rent to Value Ratio
Active
$699,888
3
bds
|
3
ba
|
1,164
sqft
|
built
1920
40 Newburg St, Boston, MA 02131
$-1,849
Cash flow
-13.8%
Cash-on-Cash Return
2.5%
Cap rate
0.5%
Rent to Value Ratio
Active
$1,499,900
9
bds
|
3
ba
|
3,663
sqft
|
built
1921
43 Iffley Rd, Boston, MA 02130
$-5,260
Cash flow
-18.3%
Cash-on-Cash Return
1.5%
Cap rate
0.3%
Rent to Value Ratio
Active
$739,999
3
bds
|
2
ba
|
1,994
sqft
|
built
1915
25 Charles St, Winthrop, MA 02152
$-1,390
Cash flow
-9.8%
Cash-on-Cash Return
3.4%
Cap rate
0.5%
Rent to Value Ratio
Active
$1,000,000
4
bds
|
3
ba
|
1,814
sqft
|
built
1960
78 Litchfield St, Boston, MA 02135
$-2,102
Cash flow
-11.0%
Cash-on-Cash Return
3.2%
Cap rate
0.4%
Rent to Value Ratio
Active
$374,900
1
bds
|
1
ba
|
585
sqft
|
built
1960
1030 Bennington St, Boston, MA 02128
$-1,022
Cash flow
-14.2%
Cash-on-Cash Return
2.4%
Cap rate
0.5%
Rent to Value Ratio
Active
$1,169,000
2
bds
|
2
ba
|
1,222
sqft
|
built
2003
234 Causeway St, Boston, MA 02114
$-4,437
Cash flow
-19.8%
Cash-on-Cash Return
1.1%
Cap rate
0.4%
Rent to Value Ratio
Active
$849,900
1
bds
|
2
ba
|
938
sqft
|
built
2006
40 Fay St, Boston, MA 02118
$-2,875
Cash flow
-17.6%
Cash-on-Cash Return
1.6%
Cap rate
0.5%
Rent to Value Ratio
Active
$725,000
1
bds
|
2
ba
|
980
sqft
|
built
2011
37 Old Harbor St, Boston, MA 02127
$-2,082
Cash flow
-15.0%
Cash-on-Cash Return
2.2%
Cap rate
0.5%
Rent to Value Ratio
Active
$879,000
5
bds
|
2
ba
|
2,870
sqft
|
built
1900
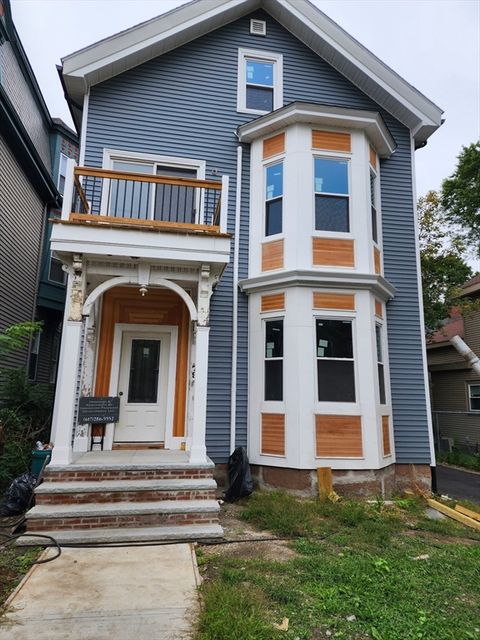
72 Bailey St, Boston, MA 02124
$-2,193
Cash flow
-13.0%
Cash-on-Cash Return
2.7%
Cap rate
0.4%
Rent to Value Ratio
Active
$1,425,000
7
bds
|
3
ba
|
3,795
sqft
|
built
1900
242 Belgrade Ave, Boston, MA 02131
$-5,445
Cash flow
-19.9%
Cash-on-Cash Return
1.1%
Cap rate
0.2%
Rent to Value Ratio
Active
$949,900
5
bds
|
3
ba
|
2,268
sqft
|
built
1900
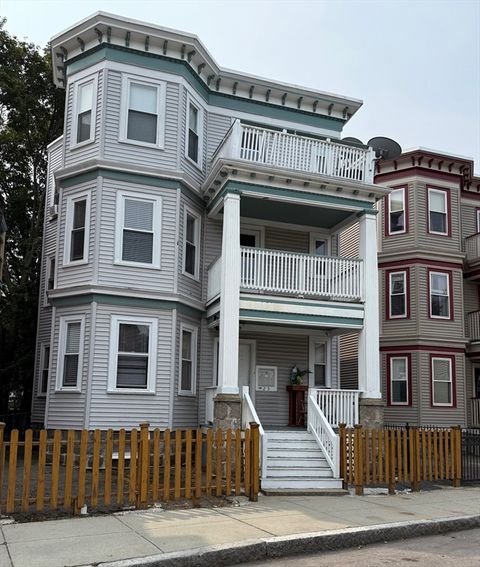
18 Holborn St, Boston, MA 02121
$-2,202
Cash flow
-12.1%
Cash-on-Cash Return
2.9%
Cap rate
0.5%
Rent to Value Ratio
Active
$959,900
2
bds
|
2
ba
|
1,763
sqft
|
built
1890
779 E 6th St, Boston, MA 02127
$-2,466
Cash flow
-13.4%
Cash-on-Cash Return
2.6%
Cap rate
0.5%
Rent to Value Ratio
Active
$2,150,000
12
bds
|
7
ba
|
4,267
sqft
|
built
1905
66 Mozart St, Boston, MA 02130
$-9,646
Cash flow
-23.4%
Cash-on-Cash Return
0.3%
Cap rate
0.1%
Rent to Value Ratio
Active
$1,999,999
4
bds
|
4
ba
|
3,387
sqft
|
built
1920
35 Wren St, Boston, MA 02132
$-6,787
Cash flow
-17.7%
Cash-on-Cash Return
1.6%
Cap rate
0.3%
Rent to Value Ratio
Active
$825,000
6
bds
|
3
ba
|
2,943
sqft
|
built
1890
30 Alaska St, Boston, MA 02119
$-2,845
Cash flow
-18.0%
Cash-on-Cash Return
1.5%
Cap rate
0.3%
Rent to Value Ratio
Active
$1,599,000
2
bds
|
1
ba
|
930
sqft
|
built
1989
75 Clarendon St, Boston, MA 02116
$-5,884
Cash flow
-19.2%
Cash-on-Cash Return
1.3%
Cap rate
0.4%
Rent to Value Ratio
Active
$1,200,000
6
bds
|
3
ba
|
3,223
sqft
|
built
1885
79 W Cottage St, Boston, MA 02125
$-3,449
Cash flow
-15.0%
Cash-on-Cash Return
2.2%
Cap rate
0.4%
Rent to Value Ratio
Active
$1,400,000
6
bds
|
3
ba
|
3,330
sqft
|
built
1902
23 Roseland St, Boston, MA 02124
$-4,783
Cash flow
-17.8%
Cash-on-Cash Return
1.6%
Cap rate
0.3%
Rent to Value Ratio
Active
$1,200,000
8
bds
|
5
ba
|
3,776
sqft
|
built
1900
238 Norfolk St, Boston, MA 02124
$-4,429
Cash flow
-19.3%
Cash-on-Cash Return
1.3%
Cap rate
0.2%
Rent to Value Ratio
Active
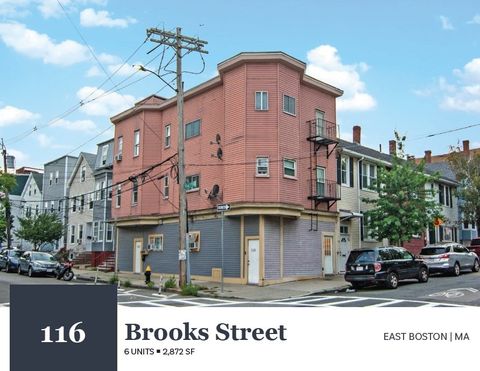
$1,700,000
6
bds
|
6
ba
|
2,872
sqft
|
built
1899
116 Brooks St, Boston, MA 02128
$-6,188
Cash flow
-19.0%
Cash-on-Cash Return
1.3%
Cap rate
0.2%
Rent to Value Ratio
Active
$1,250,000
6
bds
|
5
ba
|
3,752
sqft
|
built
2005
15 Ellington St, Boston, MA 02121
$-4,735
Cash flow
-19.8%
Cash-on-Cash Return
1.1%
Cap rate
0.2%
Rent to Value Ratio
Active
$1,150,000
2
bds
|
1
ba
|
995
sqft
|
built
1920
70 Fenway, Boston, MA 02115
$-3,852
Cash flow
-17.5%
Cash-on-Cash Return
1.7%
Cap rate
0.4%
Rent to Value Ratio
Active
$1,500,000
9
bds
|
6
ba
|
4,386
sqft
|
built
1900
240 Norfolk St, Boston, MA 02124
$-5,680
Cash flow
-19.8%
Cash-on-Cash Return
1.1%
Cap rate
0.2%
Rent to Value Ratio
Active
$750,000
1
bds
|
1
ba
|
675
sqft
|
built
2020
100 Shawmut Ave, Boston, MA 02118
$-1,766
Cash flow
-12.3%
Cash-on-Cash Return
2.9%
Cap rate
0.6%
Rent to Value Ratio
Active
$479,000
1
bds
|
1
ba
|
560
sqft
|
built
1950
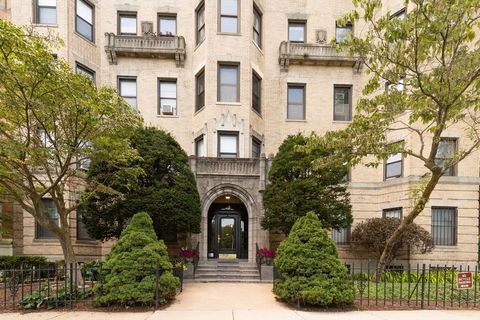
501 Beacon St, Boston, MA 02215
$-1,175
Cash flow
-12.8%
Cash-on-Cash Return
2.7%
Cap rate
0.6%
Rent to Value Ratio
Active
$1,380,000
1
bds
|
1
ba
|
821
sqft
|
built
2016
1 Franklin St, Boston, MA 02110
$-5,735
Cash flow
-21.7%
Cash-on-Cash Return
0.7%
Cap rate
0.4%
Rent to Value Ratio
Active
$624,000
2
bds
|
2
ba
|
1,160
sqft
|
built
1895
28 Dix St, Boston, MA 02122
$-1,708
Cash flow
-14.3%
Cash-on-Cash Return
2.4%
Cap rate
0.5%
Rent to Value Ratio
Active
$795,000
1
bds
|
1
ba
|
576
sqft
|
built
1878
228 Commonwealth Ave, Boston, MA 02116
$-2,590
Cash flow
-17.0%
Cash-on-Cash Return
1.8%
Cap rate
0.5%
Rent to Value Ratio
Active
$1,350,000
4
bds
|
4
ba
|
2,649
sqft
|
built
1890
10 Pacific St, Boston, MA 02127
$-4,270
Cash flow
-16.5%
Cash-on-Cash Return
1.9%
Cap rate
0.4%
Rent to Value Ratio
Active
$1,100,000
4
bds
|
2
ba
|
2,093
sqft
|
built
1936
30 Snow St, Boston, MA 02135
$-2,960
Cash flow
-14.0%
Cash-on-Cash Return
2.5%
Cap rate
0.4%
Rent to Value Ratio