Miami, FL Investment Properties for Sale
Browse homes for sale and investment properties in Miami, FL. Refine your search by price, property type, or more.
Best cash flowing properties in Miami, FL
Active
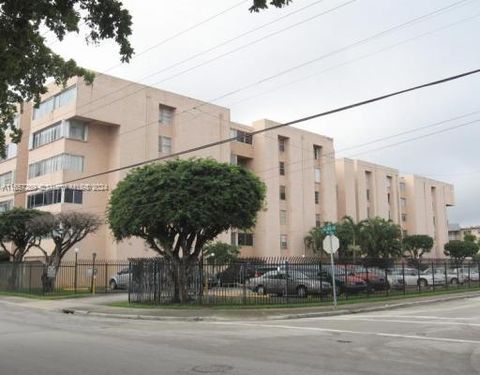
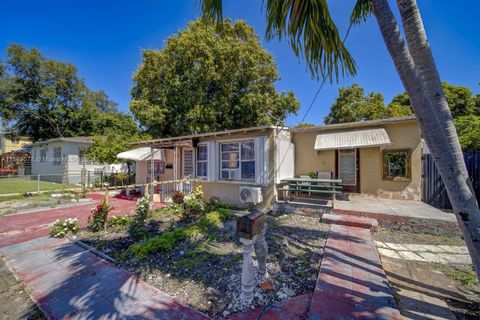
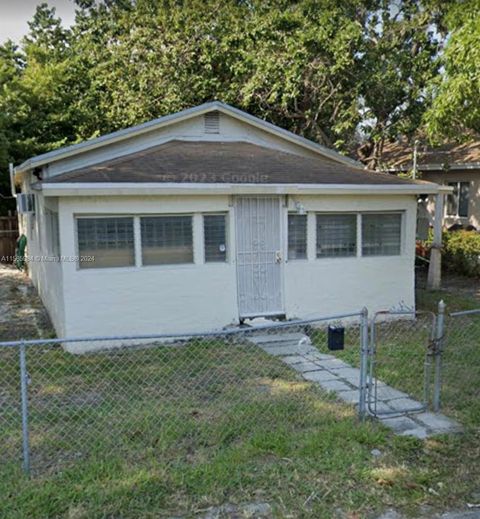
$229,000
2
bds
|
1
ba
|
685
sqft
|
built
1974
750 NW 43rd Ave, Miami, FL 33126
$-271
Cash flow
-6.2%
Cash-on-Cash Return
4.7%
Cap rate
0.9%
Rent to Value Ratio
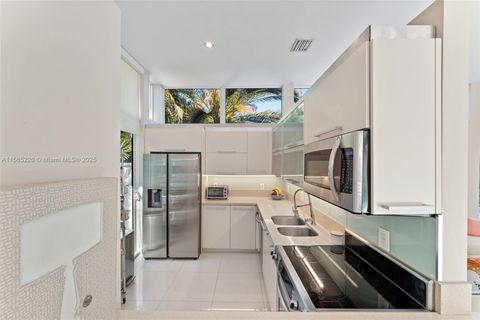
Active
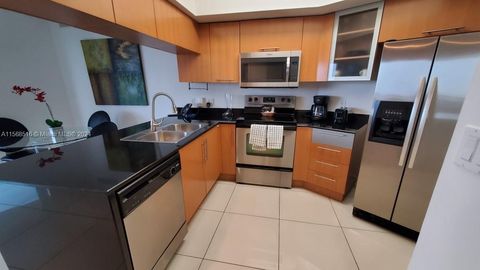
$260,000
2
bds
|
2
ba
|
1,170
sqft
|
built
1982
5900 SW 127th Ave, Miami, FL 33183
$-398
Cash flow
-8.0%
Cash-on-Cash Return
4.3%
Cap rate
1.0%
Rent to Value Ratio
6,071 out of 6,896 properties for sale in Miami, FL
Limited Results Shown
Create a free account, or log in to reveal all property listings and enjoy the complete experience.
Active
$260,000
2
bds
|
2
ba
|
1,170
sqft
|
built
1982
5900 SW 127th Ave, Miami, FL 33183
$-398
Cash flow
-8.0%
Cash-on-Cash Return
4.3%
Cap rate
1.0%
Rent to Value Ratio
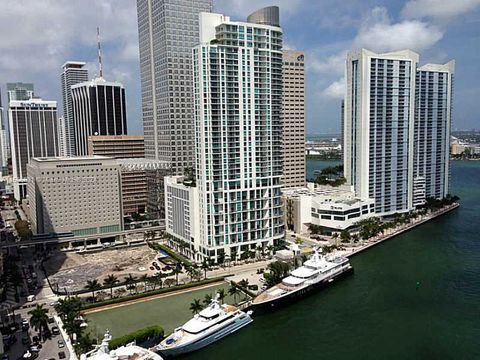
Active
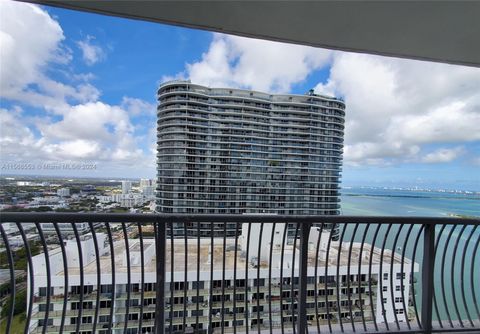
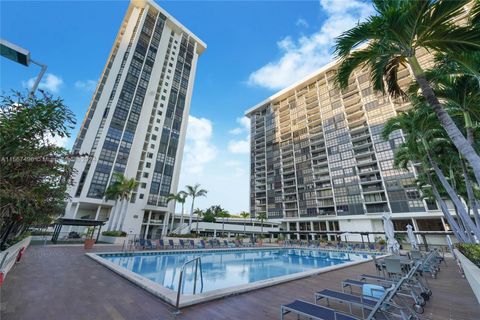
$399,000
1
bds
|
1
ba
|
821
sqft
|
built
2007
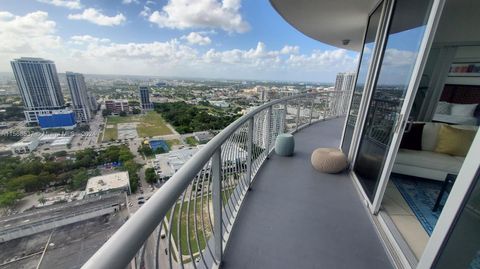
1750 N Bayshore Dr, Miami, FL 33132
$-1,288
Cash flow
-16.8%
Cash-on-Cash Return
2.3%
Cap rate
1.0%
Rent to Value Ratio

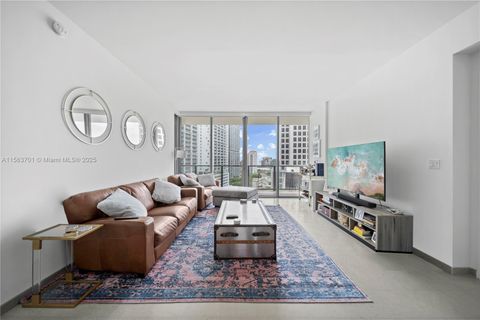
Active
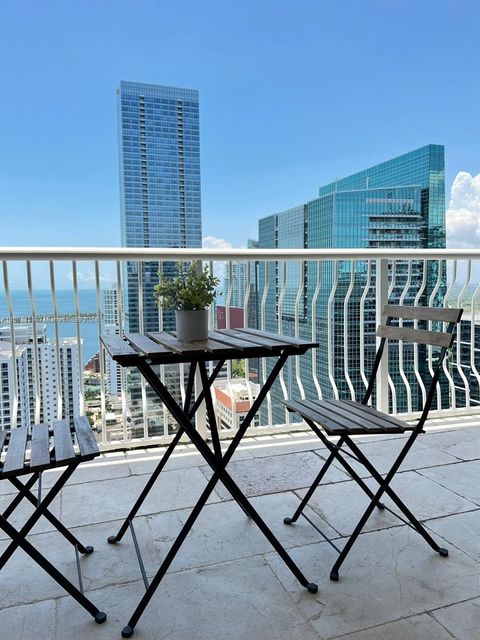
$585,000
2
bds
|
2
ba
|
999
sqft
|
built
2015
4250 Biscayne Blvd, Miami, FL 33137
$-2,754
Cash flow
-24.6%
Cash-on-Cash Return
0.5%
Cap rate
0.6%
Rent to Value Ratio
Active
$700,000
2
bds
|
2
ba
|
1,228
sqft
|
built
2015
999 SW 1st Ave, Miami, FL 33130
$-2,359
Cash flow
-17.6%
Cash-on-Cash Return
2.1%
Cap rate
0.7%
Rent to Value Ratio

Active
$689,000
3
bds
|
2
ba
|
844
sqft
|
built
1935
737 NW 30th St, Miami, FL 33127
$-1,583
Cash flow
-12.0%
Cash-on-Cash Return
3.4%
Cap rate
0.6%
Rent to Value Ratio
Active
$199,000
2
bds
|
2
ba
|
1,036
sqft
|
built
1972
496 NW 165th Street Rd, Miami, FL 33169
$-596
Cash flow
-15.6%
Cash-on-Cash Return
2.6%
Cap rate
1.1%
Rent to Value Ratio
Active
$699,000
3
bds
|
3
ba
|
1,204
sqft
|
built
1958
7945 SW 9th Ter, Miami, FL 33144
$-1,567
Cash flow
-11.7%
Cash-on-Cash Return
3.5%
Cap rate
0.5%
Rent to Value Ratio

Active
$780,000
2
bds
|
2
ba
|
1,183
sqft
|
built
2004
1200 Brickell Bay Dr, Miami, FL 33131
$-2,237
Cash flow
-15.0%
Cash-on-Cash Return
2.7%
Cap rate
0.6%
Rent to Value Ratio
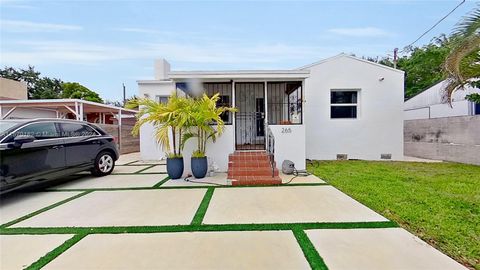
Active
$795,000
3
bds
|
2
ba
|
1,486
sqft
|
built
1949
265 NW 44th St, Miami, FL 33127
$-1,636
Cash flow
-10.7%
Cash-on-Cash Return
3.7%
Cap rate
0.6%
Rent to Value Ratio
Active
$720,000
3
bds
|
2
ba
|
1,493
sqft
|
built
1916
627 SW 11th Ave, Miami, FL 33130
$-1,607
Cash flow
-11.6%
Cash-on-Cash Return
3.5%
Cap rate
0.5%
Rent to Value Ratio
Active
$620,000
4
bds
|
2
ba
|
1,594
sqft
|
built
1940
1877 SW 6th St, Miami, FL 33135
$-1,368
Cash flow
-11.5%
Cash-on-Cash Return
3.5%
Cap rate
0.6%
Rent to Value Ratio

Active
$380,000
3
bds
|
2
ba
|
752
sqft
|
built
1940
2255 NW 63rd St, Miami, FL 33147
$-456
Cash flow
-6.3%
Cash-on-Cash Return
4.7%
Cap rate
0.7%
Rent to Value Ratio
Active
$574,698
2
bds
|
2
ba
|
1,048
sqft
|
built
2008
1750 N Bayshore Dr, Miami, FL 33132
$-2,826
Cash flow
-25.7%
Cash-on-Cash Return
0.2%
Cap rate
0.7%
Rent to Value Ratio

Active
$339,000
3
bds
|
2
ba
|
1,200
sqft
|
built
1999
870 NE 212th Ter, Miami, FL 33179
$-497
Cash flow
-7.6%
Cash-on-Cash Return
4.4%
Cap rate
0.7%
Rent to Value Ratio
Active
$310,045
bds
|
1
ba
|
508
sqft
|
built
2008
1750 N Bayshore Dr, Miami, FL 33132
$-1,436
Cash flow
-24.2%
Cash-on-Cash Return
0.6%
Cap rate
0.7%
Rent to Value Ratio

Active
$359,000
1
bds
|
1
ba
|
526
sqft
|
built
2016
151 SE 1st St, Miami, FL 33131
$-1,027
Cash flow
-14.9%
Cash-on-Cash Return
2.7%
Cap rate
0.7%
Rent to Value Ratio
Active
$599,000
1
bds
|
1
ba
|
836
sqft
|
built
2005
1200 Brickell Bay Dr, Miami, FL 33131
$-1,754
Cash flow
-15.3%
Cash-on-Cash Return
2.6%
Cap rate
0.6%
Rent to Value Ratio

Active
$735,000
4
bds
|
2
ba
|
2,285
sqft
|
built
1974
10835 SW 152nd Ter, Miami, FL 33157
$-1,609
Cash flow
-11.4%
Cash-on-Cash Return
3.5%
Cap rate
0.5%
Rent to Value Ratio
Active
$590,462
2
bds
|
2
ba
|
1,048
sqft
|
built
2008
1750 N Bayshore Dr, Miami, FL 33132
$-2,912
Cash flow
-25.7%
Cash-on-Cash Return
0.2%
Cap rate
0.7%
Rent to Value Ratio
Active
$437,000
1
bds
|
2
ba
|
868
sqft
|
built
1975
1901 Brickell Ave, Miami, FL 33129
$-1,258
Cash flow
-15.0%
Cash-on-Cash Return
2.7%
Cap rate
0.7%
Rent to Value Ratio
Active
$585,000
2
bds
|
2
ba
|
1,075
sqft
|
built
2008
350 S Miami Ave, Miami, FL 33130
$-2,124
Cash flow
-18.9%
Cash-on-Cash Return
1.8%
Cap rate
0.7%
Rent to Value Ratio
Active
$625,000
2
bds
|
2
ba
|
1,018
sqft
|
built
2018
1600 NE 1st Ave, Miami, FL 33132
$-1,672
Cash flow
-14.0%
Cash-on-Cash Return
2.9%
Cap rate
0.7%
Rent to Value Ratio
Active
$349,000
2
bds
|
2
ba
|
500
sqft
|
built
1948
8016 NW 9th Ave, Miami, FL 33150
$-1,043
Cash flow
-15.6%
Cash-on-Cash Return
2.6%
Cap rate
0.5%
Rent to Value Ratio

Active
$3,850,000
5
bds
|
4
ba
|
3,518
sqft
|
built
1994
3950 Hardie Ave, Miami, FL 33133
$-14,554
Cash flow
-19.7%
Cash-on-Cash Return
1.6%
Cap rate
0.3%
Rent to Value Ratio

Active
$10,000,000
4
bds
|
0
ba
|
1,400
sqft
|
built
1959
3151 Mc Donald St, Miami, FL 33133
$-50,569
Cash flow
-26.4%
Cash-on-Cash Return
0.1%
Cap rate
0.0%
Rent to Value Ratio

Active
$10,000,000
4
bds
|
0
ba
|
1,416
sqft
|
built
1955
3171 Mc Donald St, Miami, FL 33133
$-50,527
Cash flow
-26.4%
Cash-on-Cash Return
0.1%
Cap rate
0.0%
Rent to Value Ratio

Active
$10,000,000
4
bds
|
0
ba
|
1,500
sqft
|
built
1948
3181 Mc Donald St, Miami, FL 33133
$-50,359
Cash flow
-26.3%
Cash-on-Cash Return
0.1%
Cap rate
0.0%
Rent to Value Ratio

Active
$10,000,000
4
bds
|
0
ba
|
1,580
sqft
|
built
1948
3191 Day Ave, Miami, FL 33133
$-50,821
Cash flow
-26.5%
Cash-on-Cash Return
0.0%
Cap rate
0.0%
Rent to Value Ratio
Active
$1,500,000
4
bds
|
3
ba
|
2,448
sqft
|
built
2009
1884 SW 17th St, Miami, FL 33145
$-2,347
Cash flow
-8.2%
Cash-on-Cash Return
4.3%
Cap rate
0.6%
Rent to Value Ratio
Active
$229,000
2
bds
|
1
ba
|
685
sqft
|
built
1974
750 NW 43rd Ave, Miami, FL 33126
$-271
Cash flow
-6.2%
Cash-on-Cash Return
4.7%
Cap rate
0.9%
Rent to Value Ratio
Active
$950,000
2
bds
|
2
ba
|
0
sqft
|
built
2008
475 Brickell Ave, Miami, FL 33131
$-3,271
Cash flow
-18.0%
Cash-on-Cash Return
2.0%
Cap rate
0.6%
Rent to Value Ratio
Active
$1,050,000
2
bds
|
3
ba
|
1,244
sqft
|
built
2016
68 SE 6th St, Miami, FL 33131
$-4,459
Cash flow
-22.2%
Cash-on-Cash Return
1.1%
Cap rate
0.5%
Rent to Value Ratio

Active
$5,899,000
7
bds
|
7
ba
|
6,288
sqft
|
built
1939
1051 NE 89th St, Miami, FL 33138
$-27,977
Cash flow
-24.7%
Cash-on-Cash Return
0.5%
Cap rate
0.1%
Rent to Value Ratio
Active
$6,200,000
4
bds
|
6
ba
|
4,600
sqft
|
built
2019
1000 Biscayne Blvd, Miami, FL 33132
$-43,962
Cash flow
-37.0%
Cash-on-Cash Return
-2.4%
Cap rate
0.1%
Rent to Value Ratio
Active
$700,000
2
bds
|
3
ba
|
1,298
sqft
|
built
2008
60 SW 13th St, Miami, FL 33130
$-2,624
Cash flow
-19.6%
Cash-on-Cash Return
1.6%
Cap rate
0.7%
Rent to Value Ratio
Active
$1,300,000
2
bds
|
2
ba
|
1,269
sqft
|
built
2008
465 Brickell Ave, Miami, FL 33131
$-5,937
Cash flow
-23.8%
Cash-on-Cash Return
0.7%
Cap rate
0.4%
Rent to Value Ratio
Active
$3,500,000
3
bds
|
0
ba
|
4,956
sqft
|
built
1946
6255 NE Miami Pl, Miami, FL 33138
$-18,558
Cash flow
-27.7%
Cash-on-Cash Return
-0.2%
Cap rate
0.1%
Rent to Value Ratio
Active
$350,000
1
bds
|
1
ba
|
763
sqft
|
built
2005
275 NE 18th St, Miami, FL 33132
$-1,285
Cash flow
-19.2%
Cash-on-Cash Return
1.7%
Cap rate
0.7%
Rent to Value Ratio
Active
$615,000
2
bds
|
2
ba
|
1,105
sqft
|
built
2005
335 S Biscayne Blvd, Miami, FL 33131
$-2,739
Cash flow
-23.2%
Cash-on-Cash Return
0.8%
Cap rate
0.6%
Rent to Value Ratio
Active
$455,000
1
bds
|
1
ba
|
671
sqft
|
built
1990
770 Claughton Island Dr, Miami, FL 33131
$-2,113
Cash flow
-24.2%
Cash-on-Cash Return
0.6%
Cap rate
0.5%
Rent to Value Ratio