Miami, FL Investment Properties for Sale
Browse homes for sale and investment properties in Miami, FL. Refine your search by price, property type, or more.
Best cash flowing properties in Miami, FL
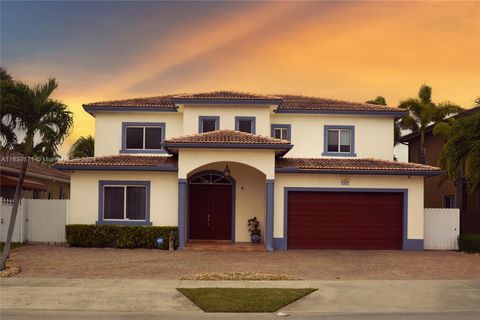
Active
$349,000
2
bds
|
1
ba
|
1,080
sqft
|
built
1943
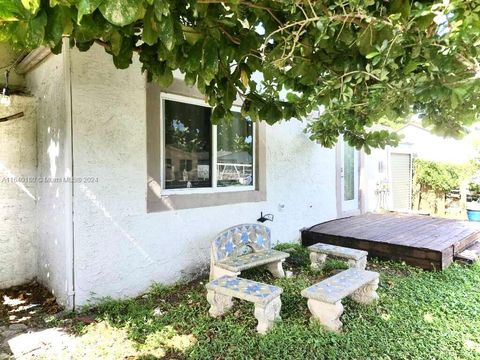
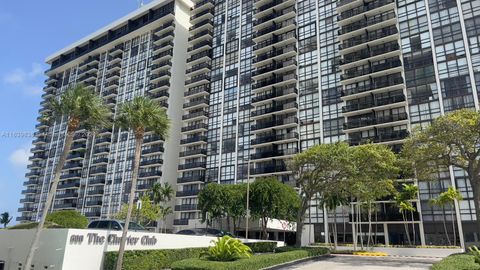
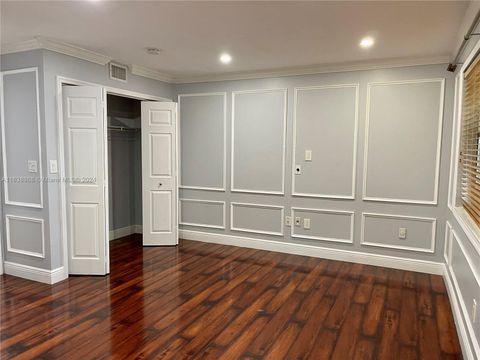
1851 NW 48th St, Miami, FL 33142
$-140
Cash flow
-2.1%
Cash-on-Cash Return
5.7%
Cap rate
0.7%
Rent to Value Ratio

Active
$304,900
2
bds
|
2
ba
|
1,131
sqft
|
built
1975
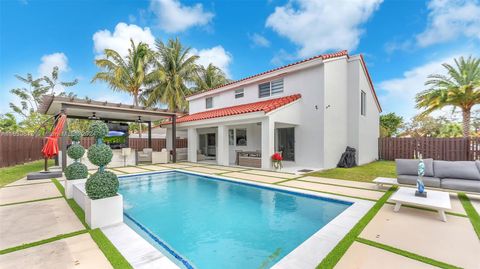
9150 Fontainebleau Blvd, Miami, FL 33172
$-247
Cash flow
-4.2%
Cash-on-Cash Return
5.2%
Cap rate
0.8%
Rent to Value Ratio
6,442 out of 7,297 properties for sale in Miami, FL
Limited Results Shown
Create a free account, or log in to reveal all property listings and enjoy the complete experience.
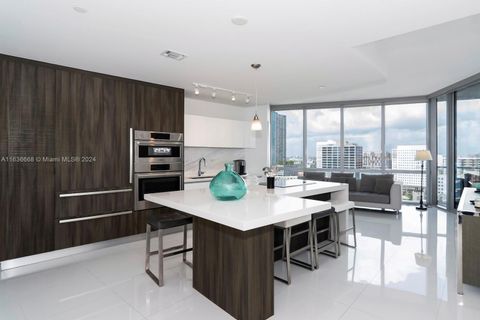
Active
$1,899,000
3
bds
|
4
ba
|
1,634
sqft
|
built
2018
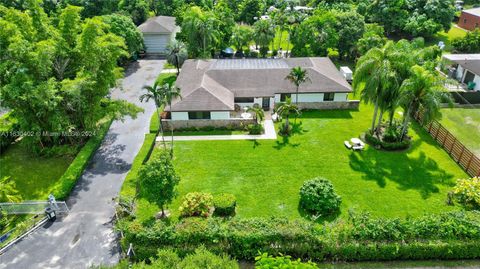
3131 NE 7th Ave, Miami, FL 33137
$-6,176
Cash flow
-17.0%
Cash-on-Cash Return
2.2%
Cap rate
0.6%
Rent to Value Ratio

Active
$220,000
1
bds
|
1
ba
|
796
sqft
|
built
1984
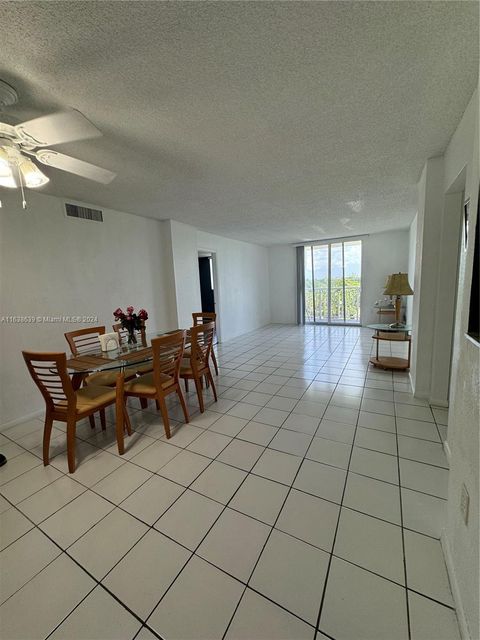
8215 SW 152nd Ave, Miami, FL 33193
$-519
Cash flow
-12.3%
Cash-on-Cash Return
3.3%
Cap rate
0.8%
Rent to Value Ratio
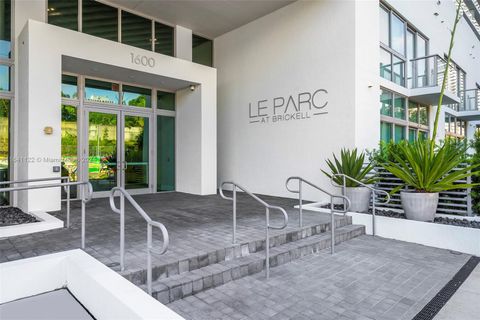
Active
$525,000
2
bds
|
2
ba
|
1,018
sqft
|
built
2018
1600 NE 1st Ave, Miami, FL 33132
$-1,689
Cash flow
-16.8%
Cash-on-Cash Return
2.3%
Cap rate
0.7%
Rent to Value Ratio
Active
$349,000
2
bds
|
1
ba
|
1,080
sqft
|
built
1943
1851 NW 48th St, Miami, FL 33142
$-140
Cash flow
-2.1%
Cash-on-Cash Return
5.7%
Cap rate
0.7%
Rent to Value Ratio

Active
$380,000
3
bds
|
3
ba
|
1,214
sqft
|
built
1988
13037 SW 88th Ln, Miami, FL 33186
$-770
Cash flow
-10.6%
Cash-on-Cash Return
3.7%
Cap rate
0.7%
Rent to Value Ratio
Active
$975,000
2
bds
|
3
ba
|
1,198
sqft
|
built
2018
650 NE 32nd St, Miami, FL 33137
$-4,058
Cash flow
-21.7%
Cash-on-Cash Return
1.2%
Cap rate
0.5%
Rent to Value Ratio
Active
$600,000
2
bds
|
2
ba
|
1,218
sqft
|
built
1973
600 NE 36th St, Miami, FL 33137
$-1,616
Cash flow
-14.1%
Cash-on-Cash Return
2.9%
Cap rate
0.6%
Rent to Value Ratio
Active
$899,999
4
bds
|
4
ba
|
2,216
sqft
|
built
1989
4260 SW 149th Ct, Miami, FL 33185
$-1,048
Cash flow
-6.1%
Cash-on-Cash Return
4.7%
Cap rate
0.7%
Rent to Value Ratio

Active
$1,800,000
5
bds
|
4
ba
|
3,224
sqft
|
built
1956
16255 SW 216th St, Miami, FL 33170
$-5,634
Cash flow
-16.3%
Cash-on-Cash Return
2.4%
Cap rate
0.4%
Rent to Value Ratio

Active
$1,249,999
5
bds
|
4
ba
|
3,319
sqft
|
built
2007
12969 SW 220th Ter, Miami, FL 33170
$-2,569
Cash flow
-10.7%
Cash-on-Cash Return
3.7%
Cap rate
0.5%
Rent to Value Ratio
Active
$1,150,000
5
bds
|
3
ba
|
3,260
sqft
|
built
1976
22455 SW 182nd Ave, Miami, FL 33170
$-3,376
Cash flow
-15.3%
Cash-on-Cash Return
2.6%
Cap rate
0.5%
Rent to Value Ratio

Active
$240,000
2
bds
|
2
ba
|
829
sqft
|
built
1990
468 NE 206th Ln, Miami, FL 33179
$-306
Cash flow
-6.7%
Cash-on-Cash Return
4.6%
Cap rate
1.0%
Rent to Value Ratio
Active
$299,000
2
bds
|
2
ba
|
970
sqft
|
built
1969
1251 NE 108th St, Miami, FL 33161
$-750
Cash flow
-13.1%
Cash-on-Cash Return
3.1%
Cap rate
0.8%
Rent to Value Ratio
Active
$440,000
2
bds
|
2
ba
|
1,262
sqft
|
built
1967
9456 SW 77th Ave, Miami, FL 33156
$-1,444
Cash flow
-17.1%
Cash-on-Cash Return
2.2%
Cap rate
0.6%
Rent to Value Ratio
Active
$2,350,000
4
bds
|
5
ba
|
2,349
sqft
|
built
2018
650 NE 32nd St, Miami, FL 33137
$-9,223
Cash flow
-20.5%
Cash-on-Cash Return
1.4%
Cap rate
0.5%
Rent to Value Ratio

Active
$849,000
2
bds
|
2
ba
|
1,048
sqft
|
built
2008
1750 N Bayshore Dr, Miami, FL 33132
$-3,857
Cash flow
-23.7%
Cash-on-Cash Return
0.7%
Cap rate
0.4%
Rent to Value Ratio
Active
$355,000
2
bds
|
2
ba
|
1,312
sqft
|
built
1987
9435 SW 140th Ct, Miami, FL 33186
$-1,009
Cash flow
-14.8%
Cash-on-Cash Return
2.7%
Cap rate
0.7%
Rent to Value Ratio
Active
$1,780,000
6
bds
|
3
ba
|
2,858
sqft
|
built
2016
6920 SW 96th Ct, Miami, FL 33173
$-4,678
Cash flow
-13.7%
Cash-on-Cash Return
3.0%
Cap rate
0.4%
Rent to Value Ratio
Active
$4,900,000
4
bds
|
5
ba
|
3,852
sqft
|
built
2019
851 NE 1st Ave, Miami, FL 33132
$-27,375
Cash flow
-29.1%
Cash-on-Cash Return
-0.6%
Cap rate
0.2%
Rent to Value Ratio

Active
$605,000
2
bds
|
2
ba
|
1,048
sqft
|
built
2008
1750 N Bayshore Dr, Miami, FL 33132
$-2,126
Cash flow
-18.3%
Cash-on-Cash Return
1.9%
Cap rate
0.7%
Rent to Value Ratio
Active
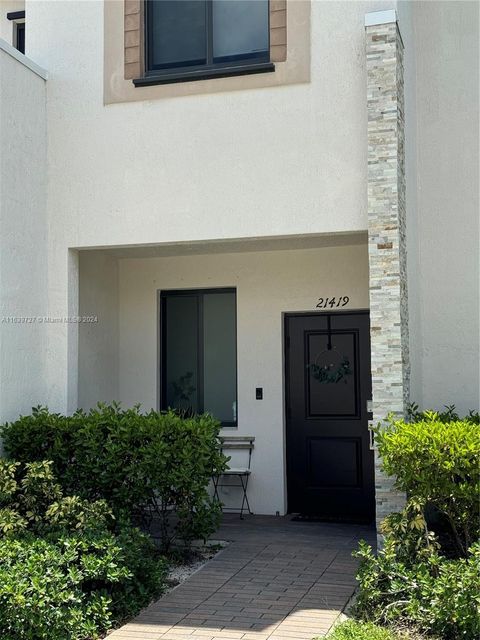
$455,000
3
bds
|
3
ba
|
1,485
sqft
|
built
2020
21419 NE 2nd Path, Miami, FL 33179
$-1,346
Cash flow
-15.4%
Cash-on-Cash Return
2.6%
Cap rate
0.6%
Rent to Value Ratio
Active
$499,500
1
bds
|
2
ba
|
610
sqft
|
built
2018
501 NE 31st St, Miami, FL 33137
$-1,699
Cash flow
-17.7%
Cash-on-Cash Return
2.1%
Cap rate
0.7%
Rent to Value Ratio

Active
$539,000
1
bds
|
1
ba
|
812
sqft
|
built
2016
601 NE 27th St, Miami, FL 33137
$-1,668
Cash flow
-16.1%
Cash-on-Cash Return
2.4%
Cap rate
0.7%
Rent to Value Ratio

Active
$1,270,000
2
bds
|
2
ba
|
1,313
sqft
|
built
2008
465 Brickell Ave, Miami, FL 33131
$-3,897
Cash flow
-16.0%
Cash-on-Cash Return
2.5%
Cap rate
0.6%
Rent to Value Ratio
Active
$495,000
1
bds
|
1
ba
|
738
sqft
|
built
2008
55 SE 6th St, Miami, FL 33131
$-2,065
Cash flow
-21.8%
Cash-on-Cash Return
1.1%
Cap rate
0.6%
Rent to Value Ratio
Active
$1,500,000
6
bds
|
4
ba
|
0
sqft
|
built
2005
2852 SW 139th Ct, Miami, FL 33175
$-4,097
Cash flow
-14.3%
Cash-on-Cash Return
2.9%
Cap rate
0.4%
Rent to Value Ratio
Active
$700,000
1
bds
|
2
ba
|
1,185
sqft
|
built
2019
851 NE 1st St, Miami, FL 33132
$-3,482
Cash flow
-26.0%
Cash-on-Cash Return
0.2%
Cap rate
0.6%
Rent to Value Ratio

Active
$400,000
3
bds
|
1
ba
|
764
sqft
|
built
1950
1434 NW 116th St, Miami, FL 33167
$-504
Cash flow
-6.6%
Cash-on-Cash Return
4.6%
Cap rate
0.7%
Rent to Value Ratio
Active
$304,900
2
bds
|
2
ba
|
1,131
sqft
|
built
1975
9150 Fontainebleau Blvd, Miami, FL 33172
$-247
Cash flow
-4.2%
Cash-on-Cash Return
5.2%
Cap rate
0.8%
Rent to Value Ratio

Active
$399,000
3
bds
|
1
ba
|
1,152
sqft
|
built
1947
1487 NW 100th St, Miami, FL 33147
$-582
Cash flow
-7.6%
Cash-on-Cash Return
4.4%
Cap rate
0.7%
Rent to Value Ratio
Active
$389,000
1
bds
|
1
ba
|
726
sqft
|
built
2004
2000 N Bayshore Dr, Miami, FL 33137
$-1,262
Cash flow
-16.9%
Cash-on-Cash Return
2.3%
Cap rate
0.7%
Rent to Value Ratio

Active
$845,000
5
bds
|
3
ba
|
2,567
sqft
|
built
2013
18302 SW 152nd Ct, Miami, FL 33187
$-1,283
Cash flow
-7.9%
Cash-on-Cash Return
4.3%
Cap rate
0.7%
Rent to Value Ratio
Active
$819,000
4
bds
|
3
ba
|
2,548
sqft
|
built
1981
12861 SW 149th St, Miami, FL 33186
$-1,044
Cash flow
-6.7%
Cash-on-Cash Return
4.6%
Cap rate
0.6%
Rent to Value Ratio
Active
$639,000
2
bds
|
2
ba
|
1,017
sqft
|
built
2016
1600 SW 1st Ave, Miami, FL 33129
$-2,186
Cash flow
-17.8%
Cash-on-Cash Return
2.0%
Cap rate
0.7%
Rent to Value Ratio

Active
$3,500,000
5
bds
|
5
ba
|
3,000
sqft
|
built
2001
279 NW 119th Ave, Miami, FL 33182
$-14,124
Cash flow
-21.1%
Cash-on-Cash Return
1.3%
Cap rate
0.2%
Rent to Value Ratio
Active
$245,000
2
bds
|
2
ba
|
1,197
sqft
|
built
1973
665 NE 195th St, Miami, FL 33179
$-537
Cash flow
-11.4%
Cash-on-Cash Return
3.5%
Cap rate
0.9%
Rent to Value Ratio

Active
$915,000
4
bds
|
2
ba
|
1,880
sqft
|
built
1973
2821 SW 65th Ave, Miami, FL 33155
$-2,096
Cash flow
-12.0%
Cash-on-Cash Return
3.4%
Cap rate
0.4%
Rent to Value Ratio
Active
$425,000
2
bds
|
2
ba
|
990
sqft
|
built
1972
777 NE 62nd St, Miami, FL 33138
$-1,705
Cash flow
-20.9%
Cash-on-Cash Return
1.3%
Cap rate
0.7%
Rent to Value Ratio
Active
$750,000
2
bds
|
2
ba
|
1,226
sqft
|
built
2016
601 NE 27th St, Miami, FL 33137
$-2,545
Cash flow
-17.7%
Cash-on-Cash Return
2.1%
Cap rate
0.6%
Rent to Value Ratio

Active
$739,000
2
bds
|
2
ba
|
788
sqft
|
built
2017
55 SW 9th St, Miami, FL 33130
$-2,638
Cash flow
-18.6%
Cash-on-Cash Return
1.9%
Cap rate
0.6%
Rent to Value Ratio