Miami, FL Investment Properties for Sale
Browse homes for sale and investment properties in Miami, FL. Refine your search by price, property type, or more.
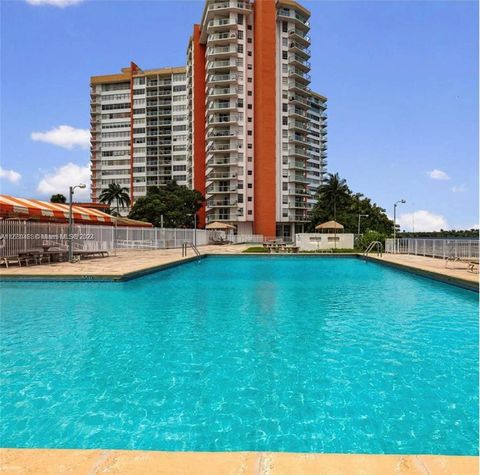
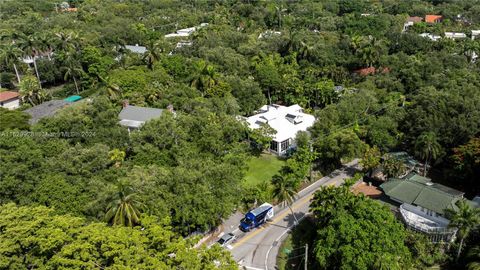
Best cash flowing properties in Miami, FL
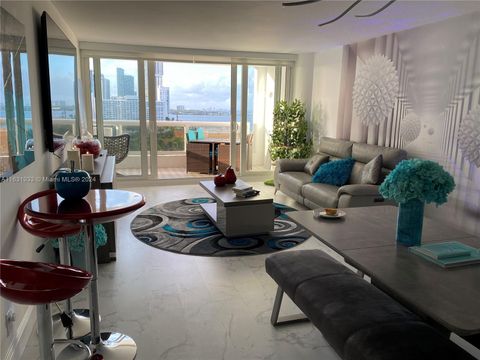
Active
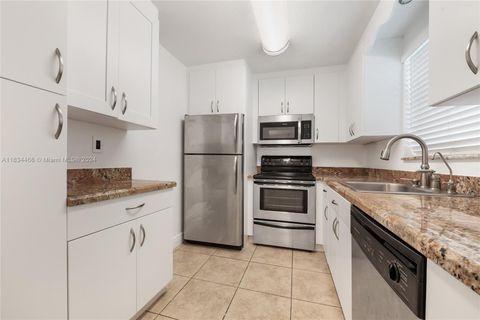
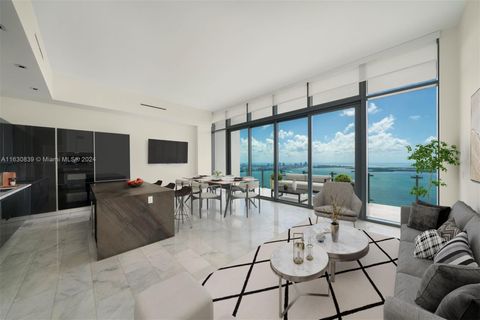
$325,000
2
bds
|
2
ba
|
1,502
sqft
|
built
1972
9367 Fontainebleau Blvd, Miami, FL 33172
$70
Cash flow
1.1%
Cash-on-Cash Return
6.4%
Cap rate
0.9%
Rent to Value Ratio
Active
$170,000
1
bds
|
1
ba
|
801
sqft
|
built
1969
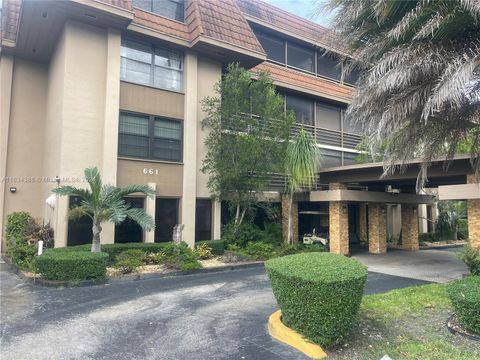
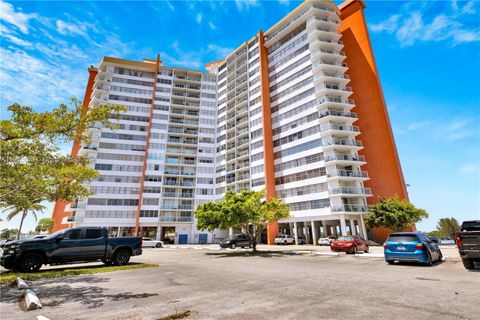
1351 NE Miami Gardens Dr, Miami, FL 33179
$-37
Cash flow
-1.1%
Cash-on-Cash Return
5.9%
Cap rate
1.1%
Rent to Value Ratio
6,442 out of 7,297 properties for sale in Miami, FL
Limited Results Shown
Create a free account, or log in to reveal all property listings and enjoy the complete experience.
Active
$250,000
2
bds
|
2
ba
|
1,197
sqft
|
built
1973
661 NE 195th St, Miami, FL 33179
$-504
Cash flow
-10.5%
Cash-on-Cash Return
3.7%
Cap rate
0.9%
Rent to Value Ratio
Active
$1,050,000
3
bds
|
4
ba
|
1,638
sqft
|
built
2016
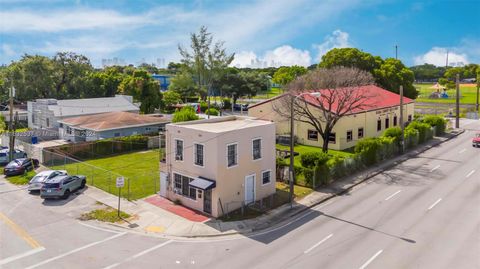
1010 SW 2nd Ave, Miami, FL 33130
$-2,649
Cash flow
-13.2%
Cash-on-Cash Return
3.1%
Cap rate
0.8%
Rent to Value Ratio

Active
$1,000,000
2
bds
|
3
ba
|
1,237
sqft
|
built
2008
200 Biscayne Boulevard Way, Miami, FL 33131
$-3,154
Cash flow
-16.5%
Cash-on-Cash Return
2.4%
Cap rate
0.6%
Rent to Value Ratio
Active
$325,000
2
bds
|
2
ba
|
1,502
sqft
|
built
1972
9367 Fontainebleau Blvd, Miami, FL 33172
$70
Cash flow
1.1%
Cash-on-Cash Return
6.4%
Cap rate
0.9%
Rent to Value Ratio
Active
$639,000
3
bds
|
3
ba
|
1,650
sqft
|
built
2005
3340 NE 190th St, Miami, FL 33180
$-1,838
Cash flow
-15.0%
Cash-on-Cash Return
2.7%
Cap rate
0.8%
Rent to Value Ratio
Active
$399,000
2
bds
|
2
ba
|
1,268
sqft
|
built
1982
4000 Towerside Ter, Miami, FL 33138
$-1,622
Cash flow
-21.2%
Cash-on-Cash Return
1.3%
Cap rate
0.9%
Rent to Value Ratio

Active
$1,380,000
3
bds
|
3
ba
|
1,040
sqft
|
built
2022
398 NE 5th St, Miami, FL 33132
$-4,578
Cash flow
-17.3%
Cash-on-Cash Return
2.2%
Cap rate
0.6%
Rent to Value Ratio
Active
$4,925,000
4
bds
|
6
ba
|
3,796
sqft
|
built
2023
700 NE 26th Ter, Miami, FL 33137
$-24,926
Cash flow
-26.4%
Cash-on-Cash Return
0.1%
Cap rate
0.2%
Rent to Value Ratio

Active
$315,000
bds
|
1
ba
|
503
sqft
|
built
2007
1750 N Bayshore Dr, Miami, FL 33132
$-994
Cash flow
-16.5%
Cash-on-Cash Return
2.4%
Cap rate
0.7%
Rent to Value Ratio
Active
$349,000
1
bds
|
2
ba
|
840
sqft
|
built
1980
555 NE 15th St, Miami, FL 33132
$-1,529
Cash flow
-22.9%
Cash-on-Cash Return
0.9%
Cap rate
0.7%
Rent to Value Ratio

Active
$2,490,000
3
bds
|
4
ba
|
3,060
sqft
|
built
1982
1581 Brickell Ave, Miami, FL 33129
$-12,554
Cash flow
-26.3%
Cash-on-Cash Return
0.1%
Cap rate
0.4%
Rent to Value Ratio
Active
$3,800,000
3
bds
|
4
ba
|
2,069
sqft
|
built
2017
1451 Brickell Ave, Miami, FL 33131
$-20,373
Cash flow
-28.0%
Cash-on-Cash Return
-0.3%
Cap rate
0.3%
Rent to Value Ratio

Active
$530,000
bds
|
1
ba
|
521
sqft
|
built
2019
3900 Biscayne Blvd, Miami, FL 33137
$-1,823
Cash flow
-17.9%
Cash-on-Cash Return
2.0%
Cap rate
0.6%
Rent to Value Ratio
Active
$170,000
1
bds
|
1
ba
|
801
sqft
|
built
1969
1351 NE Miami Gardens Dr, Miami, FL 33179
$-37
Cash flow
-1.1%
Cash-on-Cash Return
5.9%
Cap rate
1.1%
Rent to Value Ratio
Active
$420,000
2
bds
|
0
ba
|
1,066
sqft
|
built
1942
5695 NW 22nd Ave, Miami, FL 33142
$-889
Cash flow
-11.0%
Cash-on-Cash Return
3.6%
Cap rate
0.5%
Rent to Value Ratio
Active
$980,000
4
bds
|
4
ba
|
2,511
sqft
|
built
2020
13218 SW 230th St, Miami, FL 33170
$-1,598
Cash flow
-8.5%
Cash-on-Cash Return
4.2%
Cap rate
0.6%
Rent to Value Ratio

Active
$787,000
5
bds
|
3
ba
|
2,136
sqft
|
built
1984
598 SW 121st Ave, Miami, FL 33184
$-1,738
Cash flow
-11.5%
Cash-on-Cash Return
3.5%
Cap rate
0.5%
Rent to Value Ratio
Active
$185,000
1
bds
|
2
ba
|
861
sqft
|
built
1969
1351 NE Miami Gardens Dr, Miami, FL 33179
$-198
Cash flow
-5.6%
Cash-on-Cash Return
4.9%
Cap rate
1.1%
Rent to Value Ratio

Active
$288,000
3
bds
|
2
ba
|
1,065
sqft
|
built
1990
468 NE 206th Ln, Miami, FL 33179
$-378
Cash flow
-6.8%
Cash-on-Cash Return
4.6%
Cap rate
0.9%
Rent to Value Ratio
Active
$795,000
1
bds
|
2
ba
|
1,066
sqft
|
built
1986
1717 N Bayshore Dr, Miami, FL 33132
$-2,255
Cash flow
-14.8%
Cash-on-Cash Return
2.7%
Cap rate
0.5%
Rent to Value Ratio

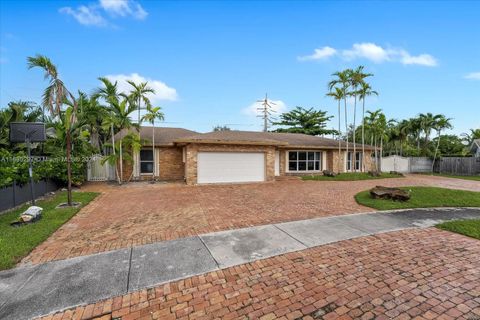
Active
$1,100,000
4
bds
|
0
ba
|
2,319
sqft
|
built
1954
2901 SW 21st St, Miami, FL 33145
$-4,030
Cash flow
-19.1%
Cash-on-Cash Return
1.8%
Cap rate
0.3%
Rent to Value Ratio

Active
$725,000
2
bds
|
2
ba
|
1,267
sqft
|
built
2006
41 SE 5th St, Miami, FL 33131
$-1,876
Cash flow
-13.5%
Cash-on-Cash Return
3.0%
Cap rate
0.8%
Rent to Value Ratio
Active
$1,790,000
4
bds
|
4
ba
|
3,147
sqft
|
built
1978
2061 NE 214th Ter, Miami, FL 33179
$-4,414
Cash flow
-12.9%
Cash-on-Cash Return
3.2%
Cap rate
0.5%
Rent to Value Ratio
Active
$189,900
1
bds
|
1
ba
|
801
sqft
|
built
1969
1351 NE Miami Gardens Dr, Miami, FL 33179
$-156
Cash flow
-4.3%
Cash-on-Cash Return
5.2%
Cap rate
0.9%
Rent to Value Ratio

Active
$1,020,000
2
bds
|
3
ba
|
1,119
sqft
|
built
2018
801 S Miami Ave, Miami, FL 33130
$-2,244
Cash flow
-11.5%
Cash-on-Cash Return
3.5%
Cap rate
0.6%
Rent to Value Ratio
Active
$4,750,000
4
bds
|
2
ba
|
2,467
sqft
|
built
1924
1701 S Bayshore Dr, Miami, FL 33133
$-22,069
Cash flow
-24.2%
Cash-on-Cash Return
0.6%
Cap rate
0.2%
Rent to Value Ratio

Active
$285,000
2
bds
|
2
ba
|
1,170
sqft
|
built
1981
5700 SW 127th Ave, Miami, FL 33183
$-526
Cash flow
-9.6%
Cash-on-Cash Return
3.9%
Cap rate
0.9%
Rent to Value Ratio
Active
$399,000
1
bds
|
1
ba
|
750
sqft
|
built
2001
1155 Brickell Bay Dr, Miami, FL 33131
$-1,506
Cash flow
-19.7%
Cash-on-Cash Return
1.6%
Cap rate
0.8%
Rent to Value Ratio

Active
$1,050,000
3
bds
|
3
ba
|
1,154
sqft
|
built
2016
1300 S Miami Ave, Miami, FL 33130
$-2,464
Cash flow
-12.2%
Cash-on-Cash Return
3.3%
Cap rate
0.5%
Rent to Value Ratio

Active
$245,000
2
bds
|
2
ba
|
1,470
sqft
|
built
1969
800 NE 195th St, Miami, FL 33179
$-553
Cash flow
-11.8%
Cash-on-Cash Return
3.4%
Cap rate
1.0%
Rent to Value Ratio
Active
$710,000
3
bds
|
2
ba
|
1,305
sqft
|
built
2005
275 NE 18th St, Miami, FL 33132
$-4,361
Cash flow
-32.0%
Cash-on-Cash Return
-1.2%
Cap rate
0.2%
Rent to Value Ratio
Active
$1,155,000
3
bds
|
2
ba
|
1,490
sqft
|
built
1955
3020 SW 57th Ave, Miami, FL 33155
$-1,889
Cash flow
-8.5%
Cash-on-Cash Return
4.2%
Cap rate
0.6%
Rent to Value Ratio
Active
$375,000
1
bds
|
1
ba
|
825
sqft
|
built
2007
1750 N Bayshore Dr, Miami, FL 33132
$-1,513
Cash flow
-21.1%
Cash-on-Cash Return
1.3%
Cap rate
0.9%
Rent to Value Ratio
Active
$624,999
2
bds
|
2
ba
|
1,117
sqft
|
built
2006
31 SE 5th St, Miami, FL 33131
$-2,377
Cash flow
-19.8%
Cash-on-Cash Return
1.6%
Cap rate
0.6%
Rent to Value Ratio
Active
$599,000
2
bds
|
2
ba
|
1,160
sqft
|
built
2004
2000 N Bayshore Dr, Miami, FL 33137
$-1,711
Cash flow
-14.9%
Cash-on-Cash Return
2.7%
Cap rate
0.7%
Rent to Value Ratio

Active
$4,995,000
3
bds
|
4
ba
|
3,459
sqft
|
built
2021
788 NE 23rd St, Miami, FL 33137
$-25,131
Cash flow
-26.2%
Cash-on-Cash Return
0.1%
Cap rate
0.2%
Rent to Value Ratio
Active
$950,000
2
bds
|
3
ba
|
1,143
sqft
|
built
2019
480 NE 31st St, Miami, FL 33137
$-2,671
Cash flow
-14.7%
Cash-on-Cash Return
2.8%
Cap rate
0.7%
Rent to Value Ratio
Active
$713,000
3
bds
|
2
ba
|
1,539
sqft
|
built
2004
12414 SW 213th St, Miami, FL 33177
$-1,406
Cash flow
-10.3%
Cash-on-Cash Return
3.8%
Cap rate
0.5%
Rent to Value Ratio
Active
$879,000
3
bds
|
3
ba
|
1,435
sqft
|
built
2015
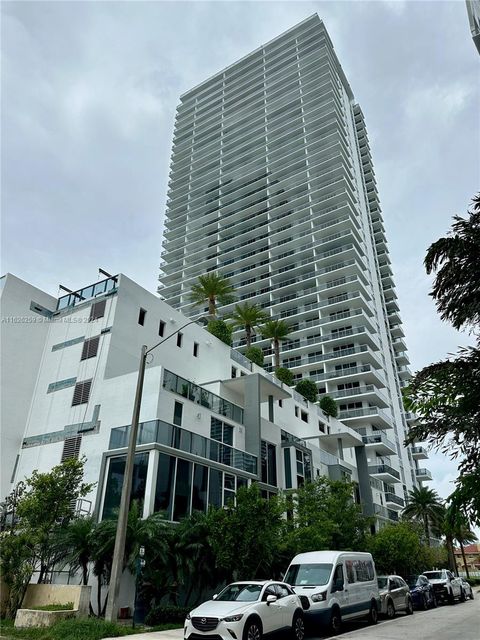
600 NE 27th St, Miami, FL 33137
$-2,818
Cash flow
-16.7%
Cash-on-Cash Return
2.3%
Cap rate
0.6%
Rent to Value Ratio

Active
$950,000
4
bds
|
0
ba
|
1,805
sqft
|
built
1939
300 NW 13th Ave, Miami, FL 33125
$-4,325
Cash flow
-23.8%
Cash-on-Cash Return
0.7%
Cap rate
0.2%
Rent to Value Ratio