Miami, FL Investment Properties for Sale
Browse homes for sale and investment properties in Miami, FL. Refine your search by price, property type, or more.
Best cash flowing properties in Miami, FL
Active
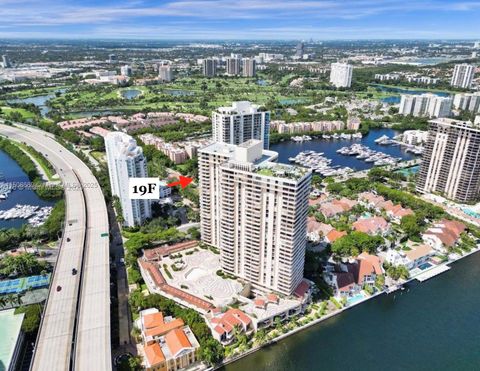
$459,000
2
bds
|
2
ba
|
1,677
sqft
|
built
1981
19355 Turnberry Way, Miami, FL 33180
$-245
Cash flow
-2.8%
Cash-on-Cash Return
5.5%
Cap rate
0.8%
Rent to Value Ratio
Active
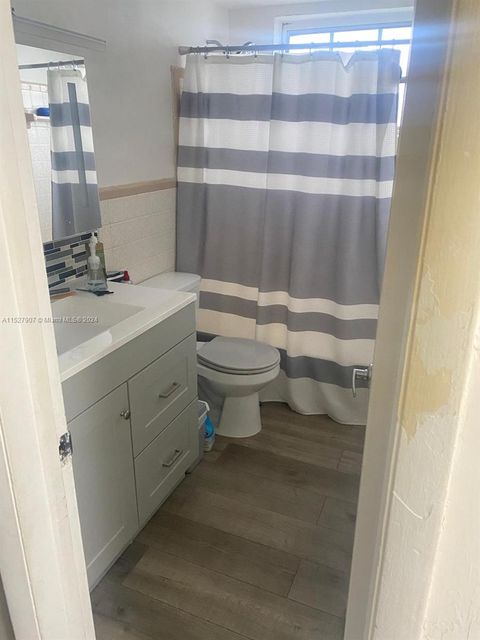
$255,000
2
bds
|
1
ba
|
800
sqft
|
built
1970
5500 SW 77th Ct, Miami, FL 33155
$-404
Cash flow
-8.3%
Cash-on-Cash Return
4.2%
Cap rate
0.9%
Rent to Value Ratio
6,071 out of 6,896 properties for sale in Miami, FL
Limited Results Shown
Create a free account, or log in to reveal all property listings and enjoy the complete experience.
Active
$620,000
bds
|
1
ba
|
357
sqft
|
built
2022
398 NE 5th St, Miami, FL 33132
$-1,368
Cash flow
-11.5%
Cash-on-Cash Return
3.5%
Cap rate
0.6%
Rent to Value Ratio
Active
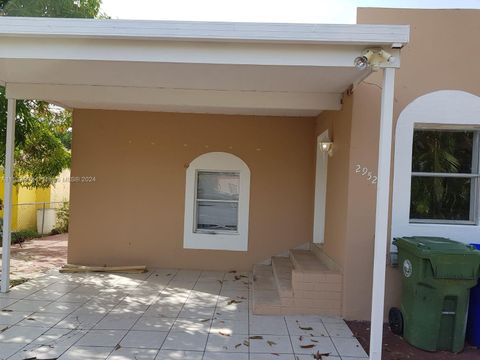
$850,000
4
bds
|
3
ba
|
1,408
sqft
|
built
1947
2952 SW 14th St, Miami, FL 33145
$-2,738
Cash flow
-16.8%
Cash-on-Cash Return
2.3%
Cap rate
0.4%
Rent to Value Ratio
Active
$1,649,000
2
bds
|
2
ba
|
0
sqft
|
built
2023
700 NE 26th Ter, Miami, FL 33137
$-39,824
Cash flow
-126.0%
Cash-on-Cash Return
-22.8%
Cap rate
0.4%
Rent to Value Ratio
Active
$6,750,000
5
bds
|
8
ba
|
6,952
sqft
|
built
2009
1100 Biscayne Blvd, Miami, FL 33132
$-46,463
Cash flow
-35.9%
Cash-on-Cash Return
-2.1%
Cap rate
0.1%
Rent to Value Ratio
Active
$205,000
1
bds
|
1
ba
|
710
sqft
|
built
1973
7900 Camino Cir, Miami, FL 33143
$-925
Cash flow
-23.5%
Cash-on-Cash Return
0.7%
Cap rate
0.8%
Rent to Value Ratio
Active
$1,050,000
2
bds
|
2
ba
|
1,219
sqft
|
built
2016
68 SE 6th St, Miami, FL 33131
$-4,159
Cash flow
-20.7%
Cash-on-Cash Return
1.4%
Cap rate
0.5%
Rent to Value Ratio

Active
$999,000
3
bds
|
0
ba
|
1,880
sqft
|
built
1936
994 NW 2nd St, Miami, FL 33128
$-3,255
Cash flow
-17.0%
Cash-on-Cash Return
2.2%
Cap rate
0.4%
Rent to Value Ratio
Active
$1,980,000
4
bds
|
3
ba
|
2,412
sqft
|
built
1981
1541 Brickell Ave, Miami, FL 33129
$-8,131
Cash flow
-21.4%
Cash-on-Cash Return
1.2%
Cap rate
0.6%
Rent to Value Ratio
Active
$459,000
1
bds
|
1
ba
|
683
sqft
|
built
2018
121 NE 34th St, Miami, FL 33137
$-2,088
Cash flow
-23.7%
Cash-on-Cash Return
0.7%
Cap rate
0.6%
Rent to Value Ratio
Active
$768,000
1
bds
|
2
ba
|
1,173
sqft
|
built
2019
851 NE 1st Ave, Miami, FL 33132
$-3,468
Cash flow
-23.6%
Cash-on-Cash Return
0.7%
Cap rate
0.6%
Rent to Value Ratio
Active
$2,599,000
3
bds
|
4
ba
|
2,855
sqft
|
built
1990
20225 NE 34th Ct, Miami, FL 33180
$-10,411
Cash flow
-20.9%
Cash-on-Cash Return
1.3%
Cap rate
0.3%
Rent to Value Ratio
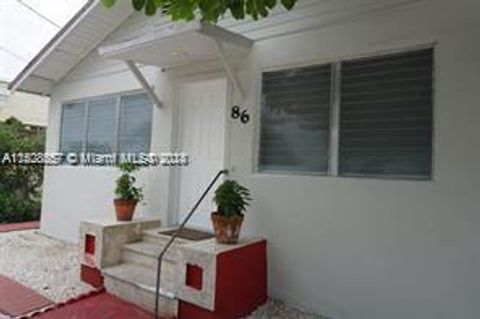
Active
$1,570,000
5
bds
|
3
ba
|
1,290
sqft
|
built
1927
86 NW 33rd St, Miami, FL 33127
$-7,263
Cash flow
-24.1%
Cash-on-Cash Return
0.6%
Cap rate
0.1%
Rent to Value Ratio
Active
$4,000,000
4
bds
|
5
ba
|
2,743
sqft
|
built
2021
788 NE 23rd St, Miami, FL 33137
$-19,044
Cash flow
-24.8%
Cash-on-Cash Return
0.4%
Cap rate
0.3%
Rent to Value Ratio
Active
$255,000
2
bds
|
1
ba
|
800
sqft
|
built
1970
5500 SW 77th Ct, Miami, FL 33155
$-404
Cash flow
-8.3%
Cash-on-Cash Return
4.2%
Cap rate
0.9%
Rent to Value Ratio
Active
$1,025,000
3
bds
|
2
ba
|
2,153
sqft
|
built
2003
23001 SW 167th Ave, Miami, FL 33170
$-2,487
Cash flow
-12.7%
Cash-on-Cash Return
3.2%
Cap rate
0.4%
Rent to Value Ratio
Active
$3,000,000
4
bds
|
3
ba
|
2,852
sqft
|
built
1964
8290 Sunset Dr, Miami, FL 33143
$-9,813
Cash flow
-17.1%
Cash-on-Cash Return
2.2%
Cap rate
0.3%
Rent to Value Ratio
Active
$1,569,000
4
bds
|
0
ba
|
3,630
sqft
|
built
1925
2915 SW 24th Ter, Miami, FL 33145
$-5,501
Cash flow
-18.3%
Cash-on-Cash Return
1.9%
Cap rate
0.3%
Rent to Value Ratio
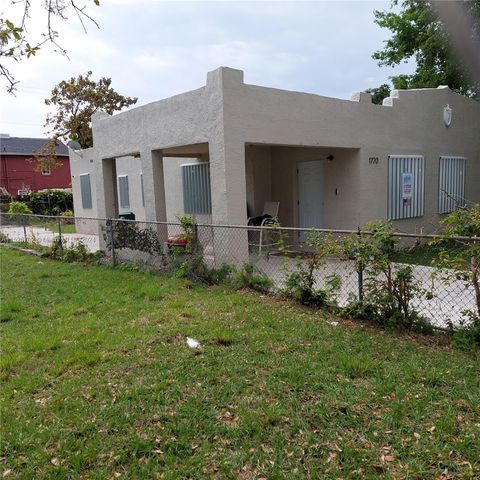
Active
$519,900
4
bds
|
2
ba
|
1,385
sqft
|
built
1924
1770 NW 44th St, Miami, FL 33142
$-1,034
Cash flow
-10.4%
Cash-on-Cash Return
3.8%
Cap rate
0.6%
Rent to Value Ratio
Active
$930,000
2
bds
|
2
ba
|
1,253
sqft
|
built
2018
801 S Miami Ave, Miami, FL 33130
$-2,959
Cash flow
-16.6%
Cash-on-Cash Return
2.3%
Cap rate
0.8%
Rent to Value Ratio

Active
$780,000
2
bds
|
3
ba
|
1,421
sqft
|
built
2007
3250 NE 1st Ave, Miami, FL 33137
$-3,900
Cash flow
-26.1%
Cash-on-Cash Return
0.1%
Cap rate
0.6%
Rent to Value Ratio
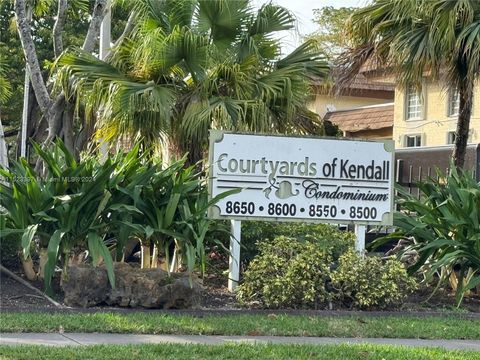
Active
$275,000
2
bds
|
2
ba
|
1,140
sqft
|
built
1969
8600 SW 109th Ave, Miami, FL 33173
$-531
Cash flow
-10.1%
Cash-on-Cash Return
3.8%
Cap rate
0.8%
Rent to Value Ratio
Active
$590,000
2
bds
|
1
ba
|
1,135
sqft
|
built
1951
451 NW 30th Pl, Miami, FL 33125
$-1,526
Cash flow
-13.5%
Cash-on-Cash Return
3.0%
Cap rate
0.5%
Rent to Value Ratio
Active
$745,000
2
bds
|
2
ba
|
1,030
sqft
|
built
2004
1200 Brickell Bay Dr, Miami, FL 33131
$-1,127
Cash flow
-7.9%
Cash-on-Cash Return
4.3%
Cap rate
0.7%
Rent to Value Ratio

Active
$930,000
2
bds
|
3
ba
|
1,377
sqft
|
built
1982
520 Brickell Key Dr, Miami, FL 33131
$-1,618
Cash flow
-9.1%
Cash-on-Cash Return
4.1%
Cap rate
0.8%
Rent to Value Ratio
Active
$575,000
3
bds
|
2
ba
|
1,832
sqft
|
built
1961
1450 NE 117th St, Miami, FL 33161
$-612
Cash flow
-5.6%
Cash-on-Cash Return
4.9%
Cap rate
0.6%
Rent to Value Ratio
Active
$23,750,000
5
bds
|
7
ba
|
9,200
sqft
|
built
2019
1000 Biscayne Blvd, Miami, FL 33132
$-158,732
Cash flow
-34.9%
Cash-on-Cash Return
-1.9%
Cap rate
0.0%
Rent to Value Ratio
Active
$498,000
2
bds
|
2
ba
|
1,060
sqft
|
built
1968
905 Brickell Bay Dr, Miami, FL 33131
$-1,640
Cash flow
-17.2%
Cash-on-Cash Return
2.2%
Cap rate
0.6%
Rent to Value Ratio

Active
$850,000
2
bds
|
1
ba
|
1,638
sqft
|
built
1925
1765 NW 5th St, Miami, FL 33125
$-2,850
Cash flow
-17.5%
Cash-on-Cash Return
2.1%
Cap rate
0.4%
Rent to Value Ratio

Active
$1,950,000
4
bds
|
0
ba
|
4,532
sqft
|
built
1978
1355 SW 12th St, Miami, FL 33135
$-9,277
Cash flow
-24.8%
Cash-on-Cash Return
0.4%
Cap rate
0.1%
Rent to Value Ratio
Active
$2,495,000
6
bds
|
4
ba
|
2,698
sqft
|
built
1967
19860 NE 24th Ct, Miami, FL 33180
$-119,522
Cash flow
-249.9%
Cash-on-Cash Return
-51.3%
Cap rate
0.4%
Rent to Value Ratio
Active
$2,450,000
2
bds
|
4
ba
|
2,348
sqft
|
built
2023
700 NE 26th Ter, Miami, FL 33137
$-12,402
Cash flow
-26.4%
Cash-on-Cash Return
0.1%
Cap rate
0.4%
Rent to Value Ratio
Active
$460,000
1
bds
|
1
ba
|
846
sqft
|
built
2005
335 S Biscayne Blvd, Miami, FL 33131
$-1,693
Cash flow
-19.2%
Cash-on-Cash Return
1.7%
Cap rate
0.6%
Rent to Value Ratio
Active
$449,000
2
bds
|
2
ba
|
1,316
sqft
|
built
1982
780 NE 69th St, Miami, FL 33138
$-1,641
Cash flow
-19.1%
Cash-on-Cash Return
1.8%
Cap rate
0.8%
Rent to Value Ratio
Active
$1,250,000
1
bds
|
2
ba
|
1,034
sqft
|
built
2018
1000 Brickell Ave, Miami, FL 33131
$-5,235
Cash flow
-21.9%
Cash-on-Cash Return
1.1%
Cap rate
0.4%
Rent to Value Ratio
Active
$1,950,000
3
bds
|
4
ba
|
1,868
sqft
|
built
2017
2900 NE 7th Ave, Miami, FL 33137
$-5,364
Cash flow
-14.4%
Cash-on-Cash Return
2.8%
Cap rate
0.5%
Rent to Value Ratio
Active
$485,000
1
bds
|
1
ba
|
684
sqft
|
built
2018
121 NE 34th St, Miami, FL 33137
$-989
Cash flow
-10.6%
Cash-on-Cash Return
3.7%
Cap rate
0.8%
Rent to Value Ratio

Active
$880,000
1
bds
|
2
ba
|
959
sqft
|
built
2018
3131 NE 7th Ave, Miami, FL 33137
$-3,569
Cash flow
-21.2%
Cash-on-Cash Return
1.3%
Cap rate
0.6%
Rent to Value Ratio

Active
$499,000
3
bds
|
2
ba
|
875
sqft
|
built
1952
1256 NE 149th St, Miami, FL 33161
$-1,016
Cash flow
-10.6%
Cash-on-Cash Return
3.7%
Cap rate
0.5%
Rent to Value Ratio
Active
$480,000
1
bds
|
1
ba
|
829
sqft
|
built
2008
1900 N Bayshore Dr, Miami, FL 33132
$-1,594
Cash flow
-17.3%
Cash-on-Cash Return
2.2%
Cap rate
0.7%
Rent to Value Ratio
Active
$459,000
2
bds
|
2
ba
|
1,677
sqft
|
built
1981
19355 Turnberry Way, Miami, FL 33180
$-245
Cash flow
-2.8%
Cash-on-Cash Return
5.5%
Cap rate
0.8%
Rent to Value Ratio