Minneapolis, MN Investment Properties for Sale
Browse homes for sale and investment properties in Minneapolis, MN. Refine your search by price, property type, or more.
Best cash flowing properties in Minneapolis, MN
Active
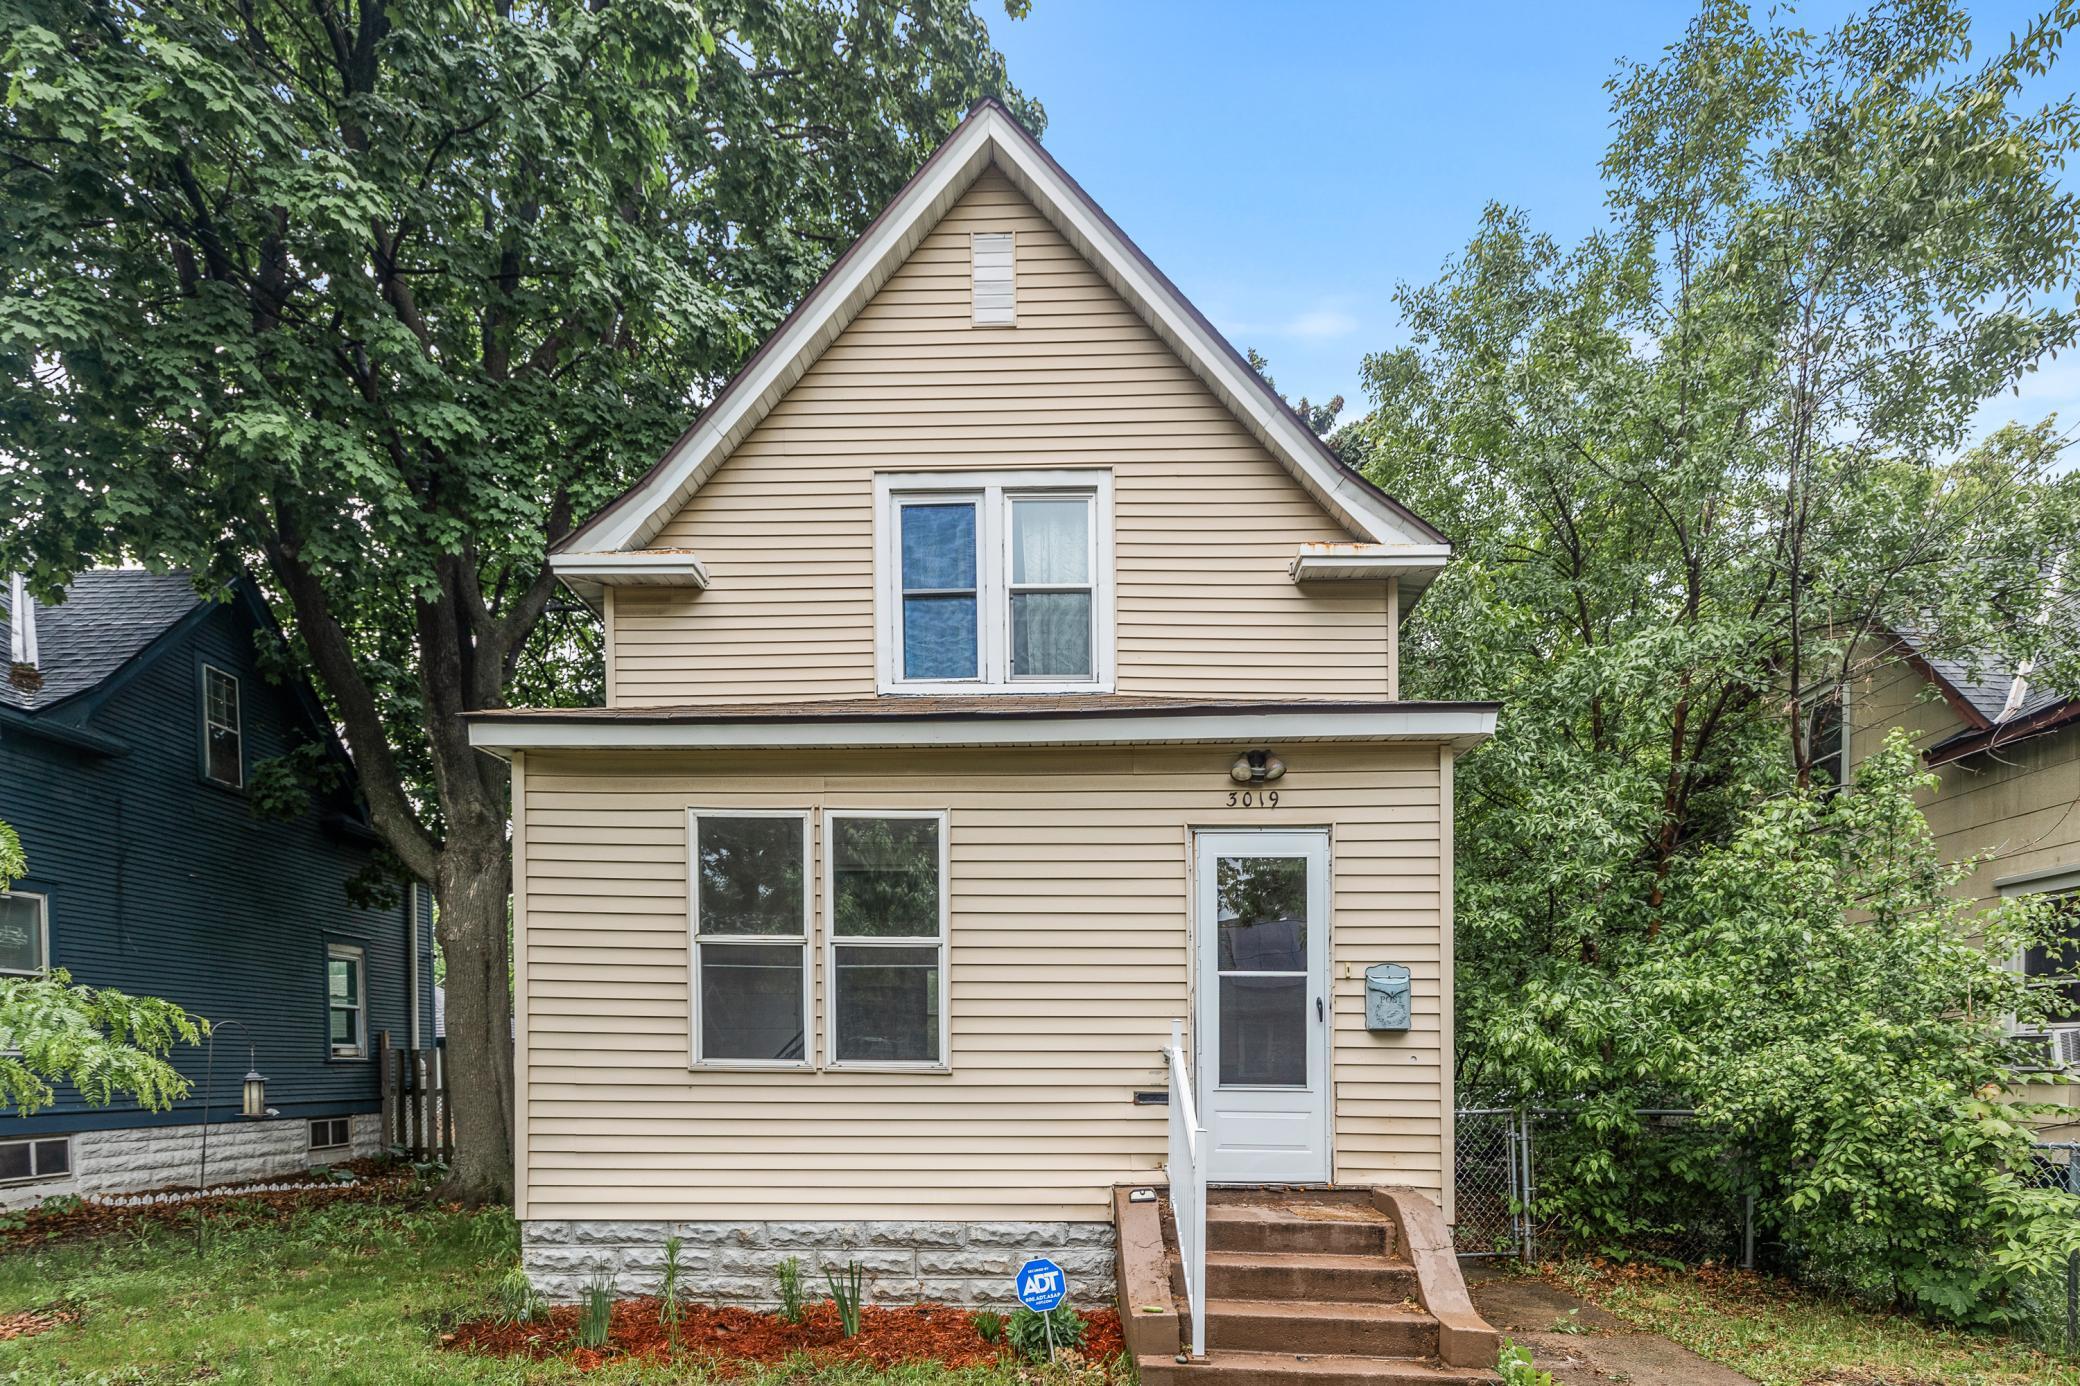
$185,000
3
bds
|
1
ba
|
1,006
sqft
|
built
1910
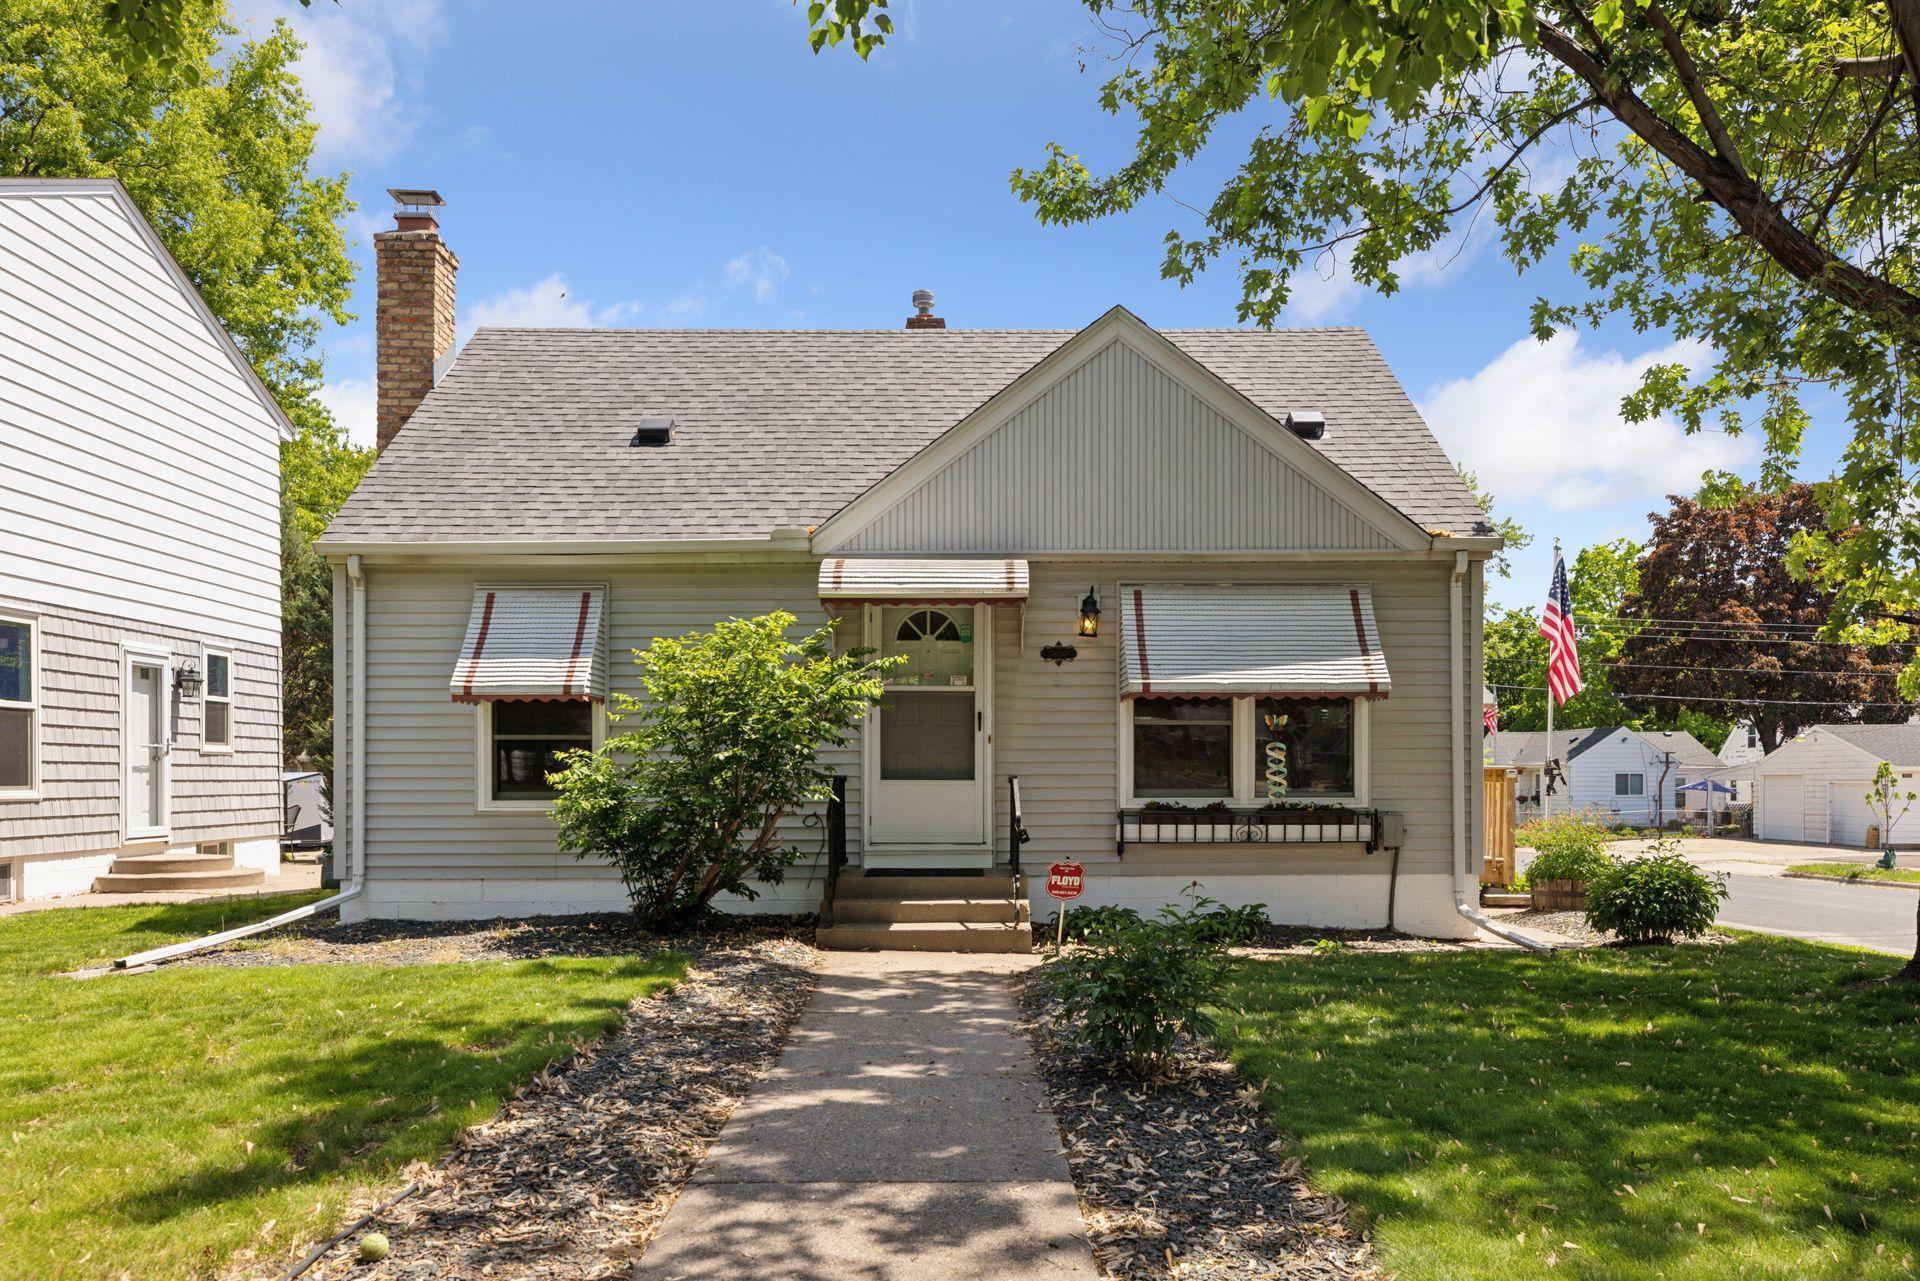
3019 Colfax Ave N, Minneapolis, MN 55411
$210
Cash flow
5.9%
Cash-on-Cash Return
7.6%
Cap rate
1.1%
Rent to Value Ratio
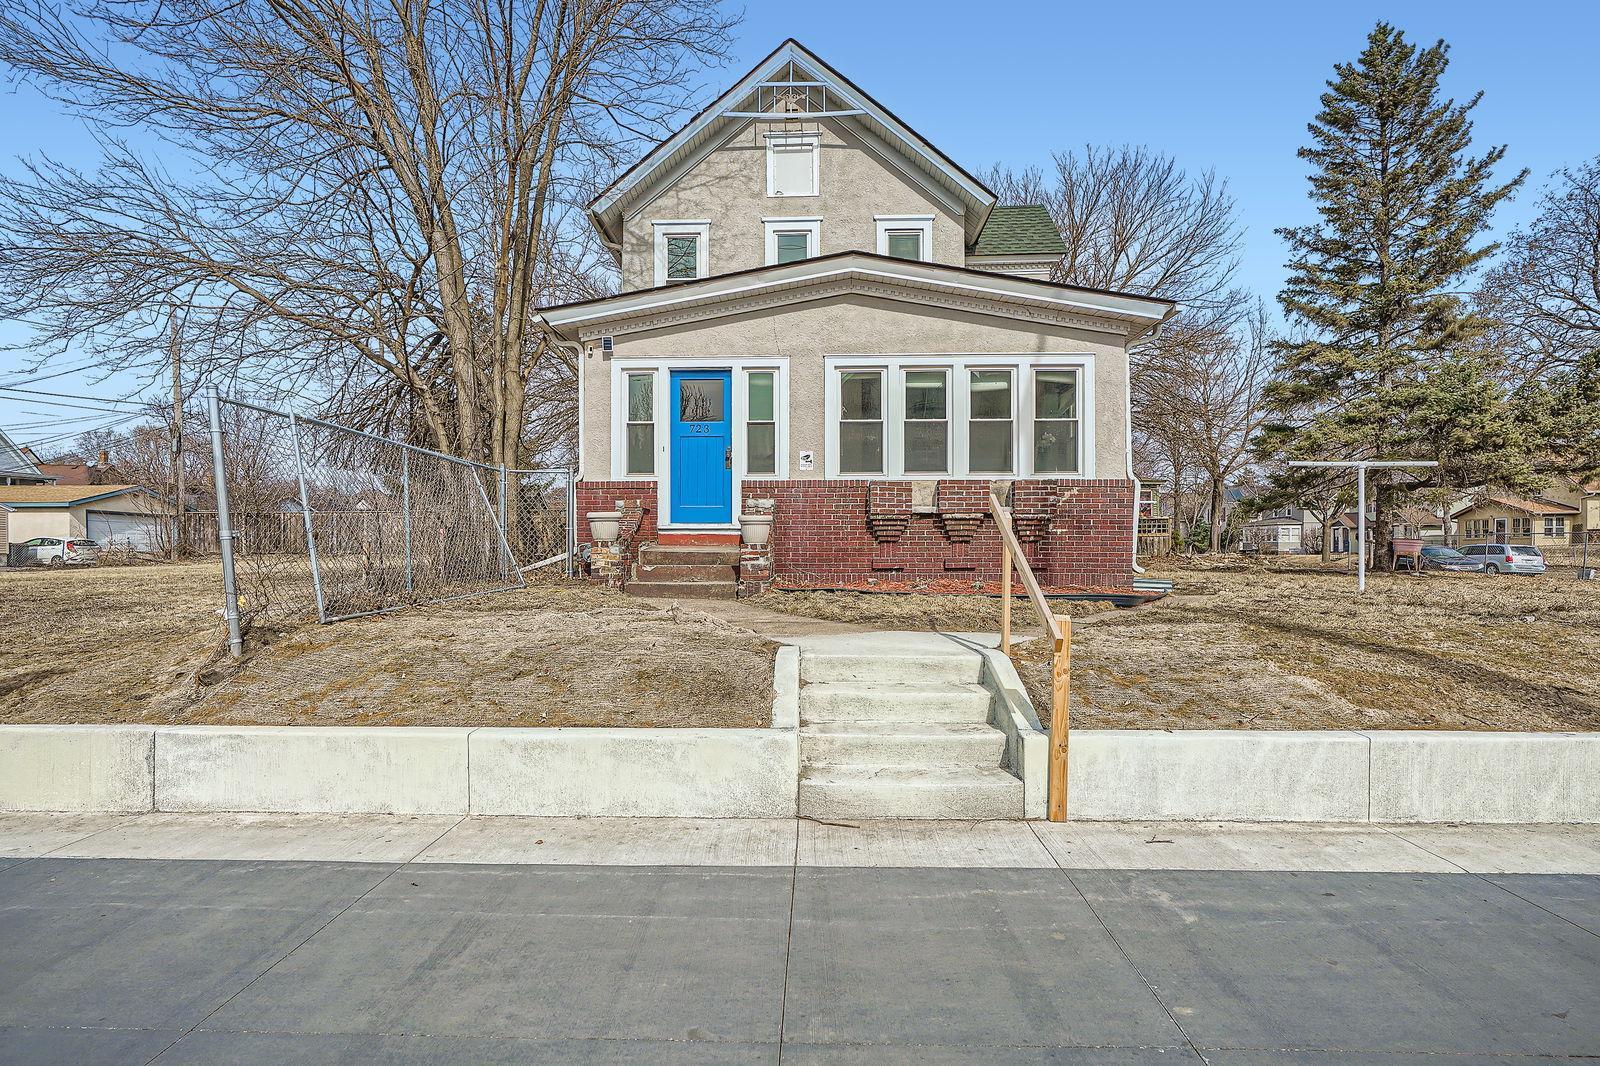
Active
$390,000
4
bds
|
2
ba
|
3,134
sqft
|
built
1900
723 Lowry Ave NE, Minneapolis, MN 55418
$55
Cash flow
0.7%
Cash-on-Cash Return
6.5%
Cap rate
0.9%
Rent to Value Ratio
1,031 out of 1,244 properties for sale in Minneapolis, MN
Limited Results Shown
Create a free account, or log in to reveal all property listings and enjoy the complete experience.
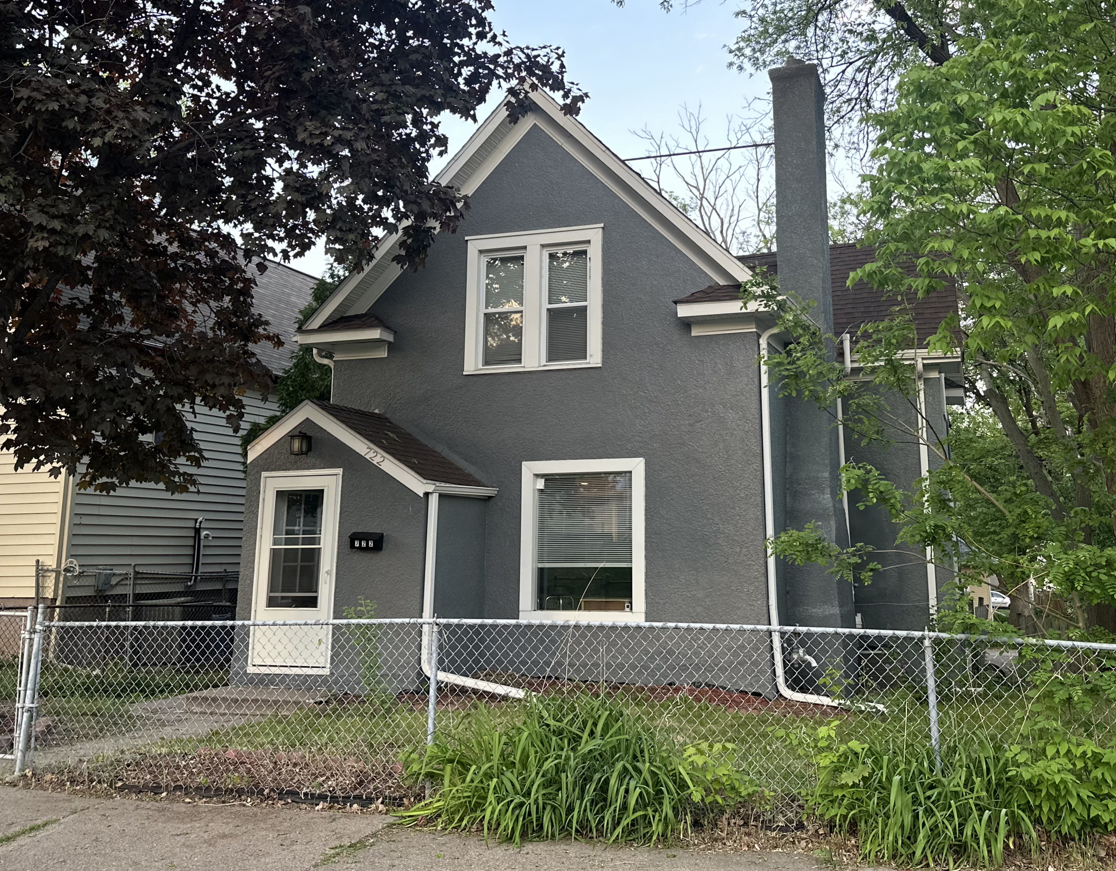
Active
$299,900
4
bds
|
3
ba
|
1,800
sqft
|
built
1907
722 Newton Ave N, Minneapolis, MN 55411
$-140
Cash flow
-2.4%
Cash-on-Cash Return
5.7%
Cap rate
0.8%
Rent to Value Ratio
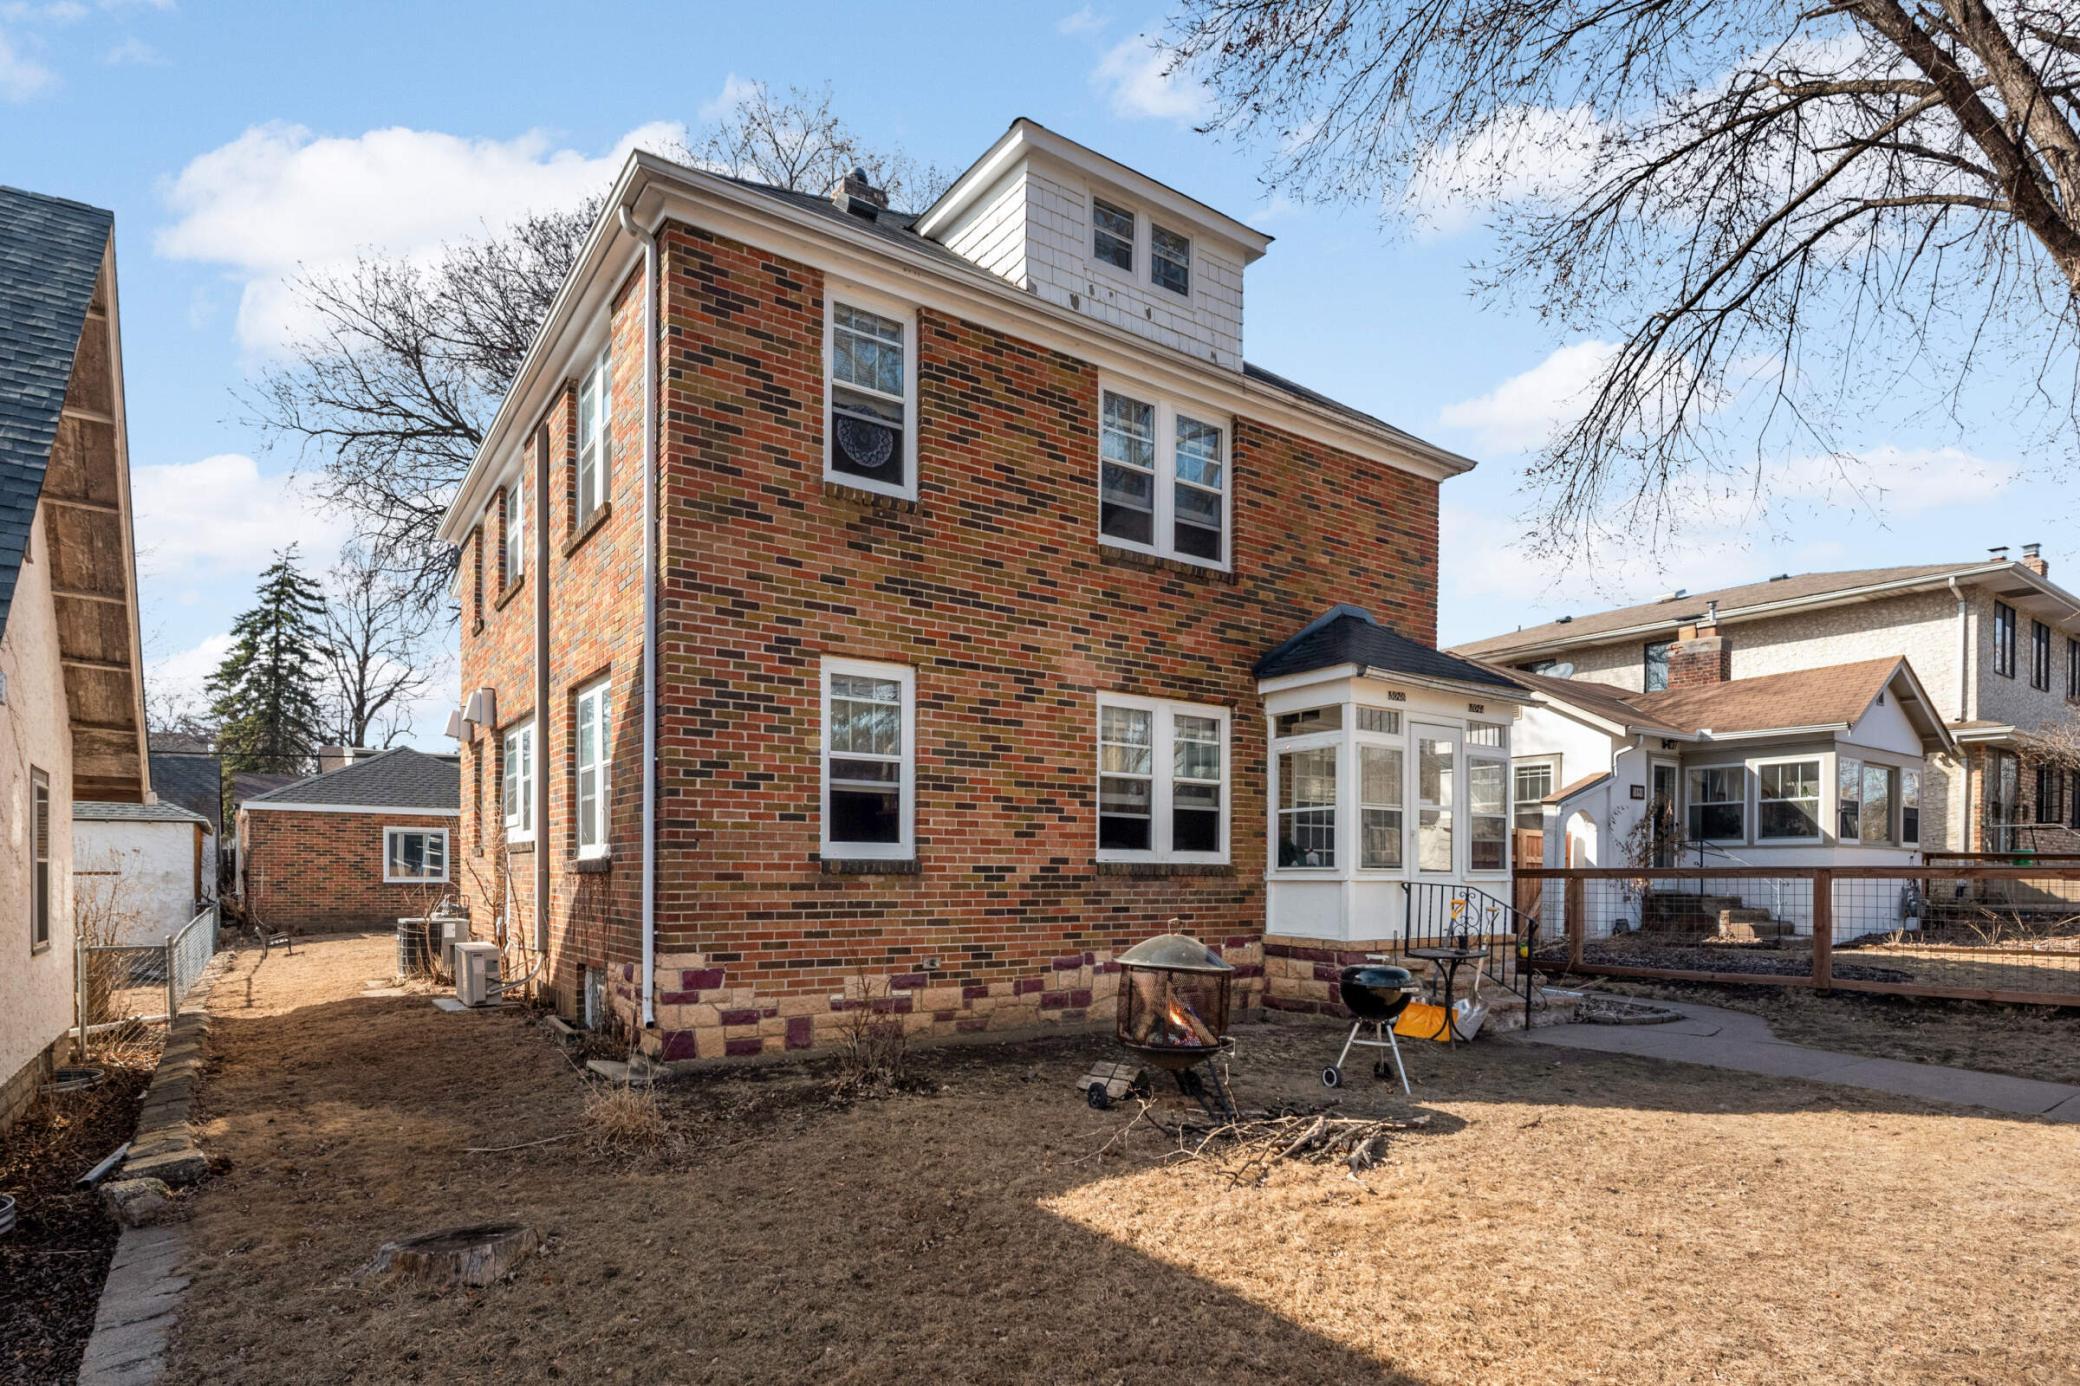
Active
$439,900
4
bds
|
2
ba
|
1,980
sqft
|
built
1936
5044 Bloomington Ave, Minneapolis, MN 55417
$-1,163
Cash flow
-13.8%
Cash-on-Cash Return
3.1%
Cap rate
0.6%
Rent to Value Ratio
Active
$220,000
2
bds
|
1
ba
|
1,098
sqft
|
built
2006
2929 21st Ave S, Minneapolis, MN 55407
$-503
Cash flow
-11.9%
Cash-on-Cash Return
3.5%
Cap rate
0.9%
Rent to Value Ratio
Active
$195,000
2
bds
|
1
ba
|
754
sqft
|
built
1917
3129 Grand Ave S, Minneapolis, MN 55408
$-380
Cash flow
-10.2%
Cash-on-Cash Return
3.9%
Cap rate
0.8%
Rent to Value Ratio
Active
$299,900
1
bds
|
1
ba
|
907
sqft
|
built
2005
720 N 4th St, Minneapolis, MN 55401
$-848
Cash flow
-14.8%
Cash-on-Cash Return
2.9%
Cap rate
0.7%
Rent to Value Ratio
Active
$129,900
1
bds
|
1
ba
|
640
sqft
|
built
1951
2201 3rd Ave S, Minneapolis, MN 55404
$-301
Cash flow
-12.1%
Cash-on-Cash Return
3.5%
Cap rate
1.1%
Rent to Value Ratio
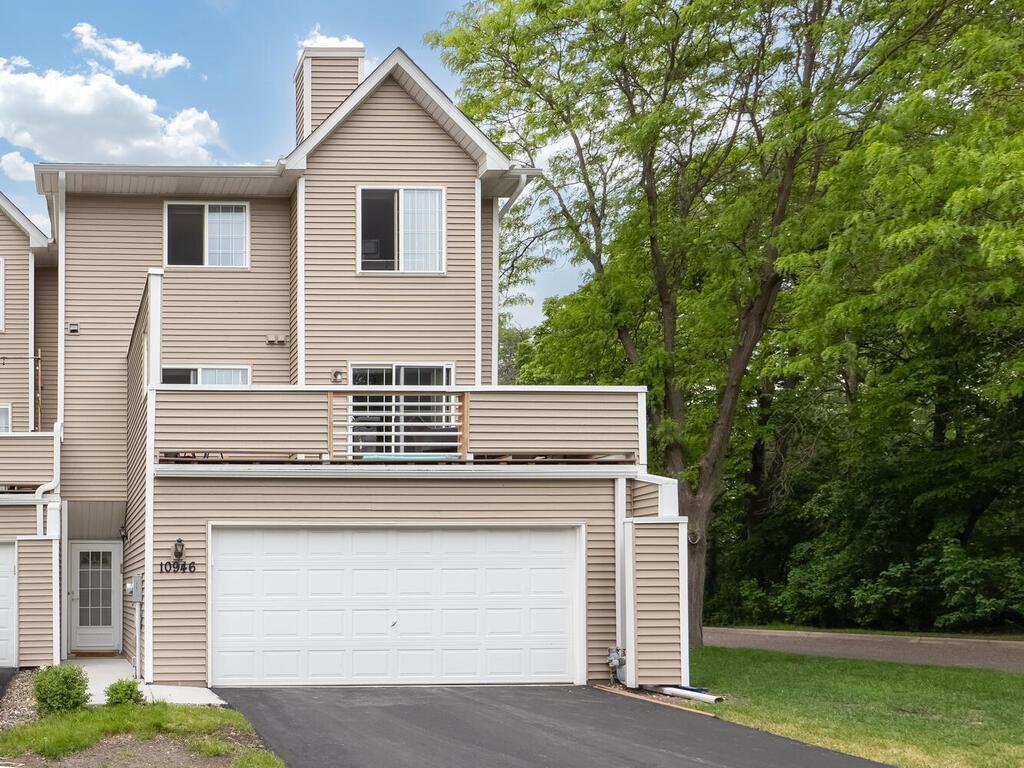
Active
$259,900
2
bds
|
3
ba
|
1,992
sqft
|
built
1996
10946 Johnson St NE, Minneapolis, MN 55434
$-413
Cash flow
-8.3%
Cash-on-Cash Return
4.4%
Cap rate
0.8%
Rent to Value Ratio
Active
$390,000
4
bds
|
2
ba
|
3,134
sqft
|
built
1900
723 Lowry Ave NE, Minneapolis, MN 55418
$55
Cash flow
0.7%
Cash-on-Cash Return
6.5%
Cap rate
0.9%
Rent to Value Ratio
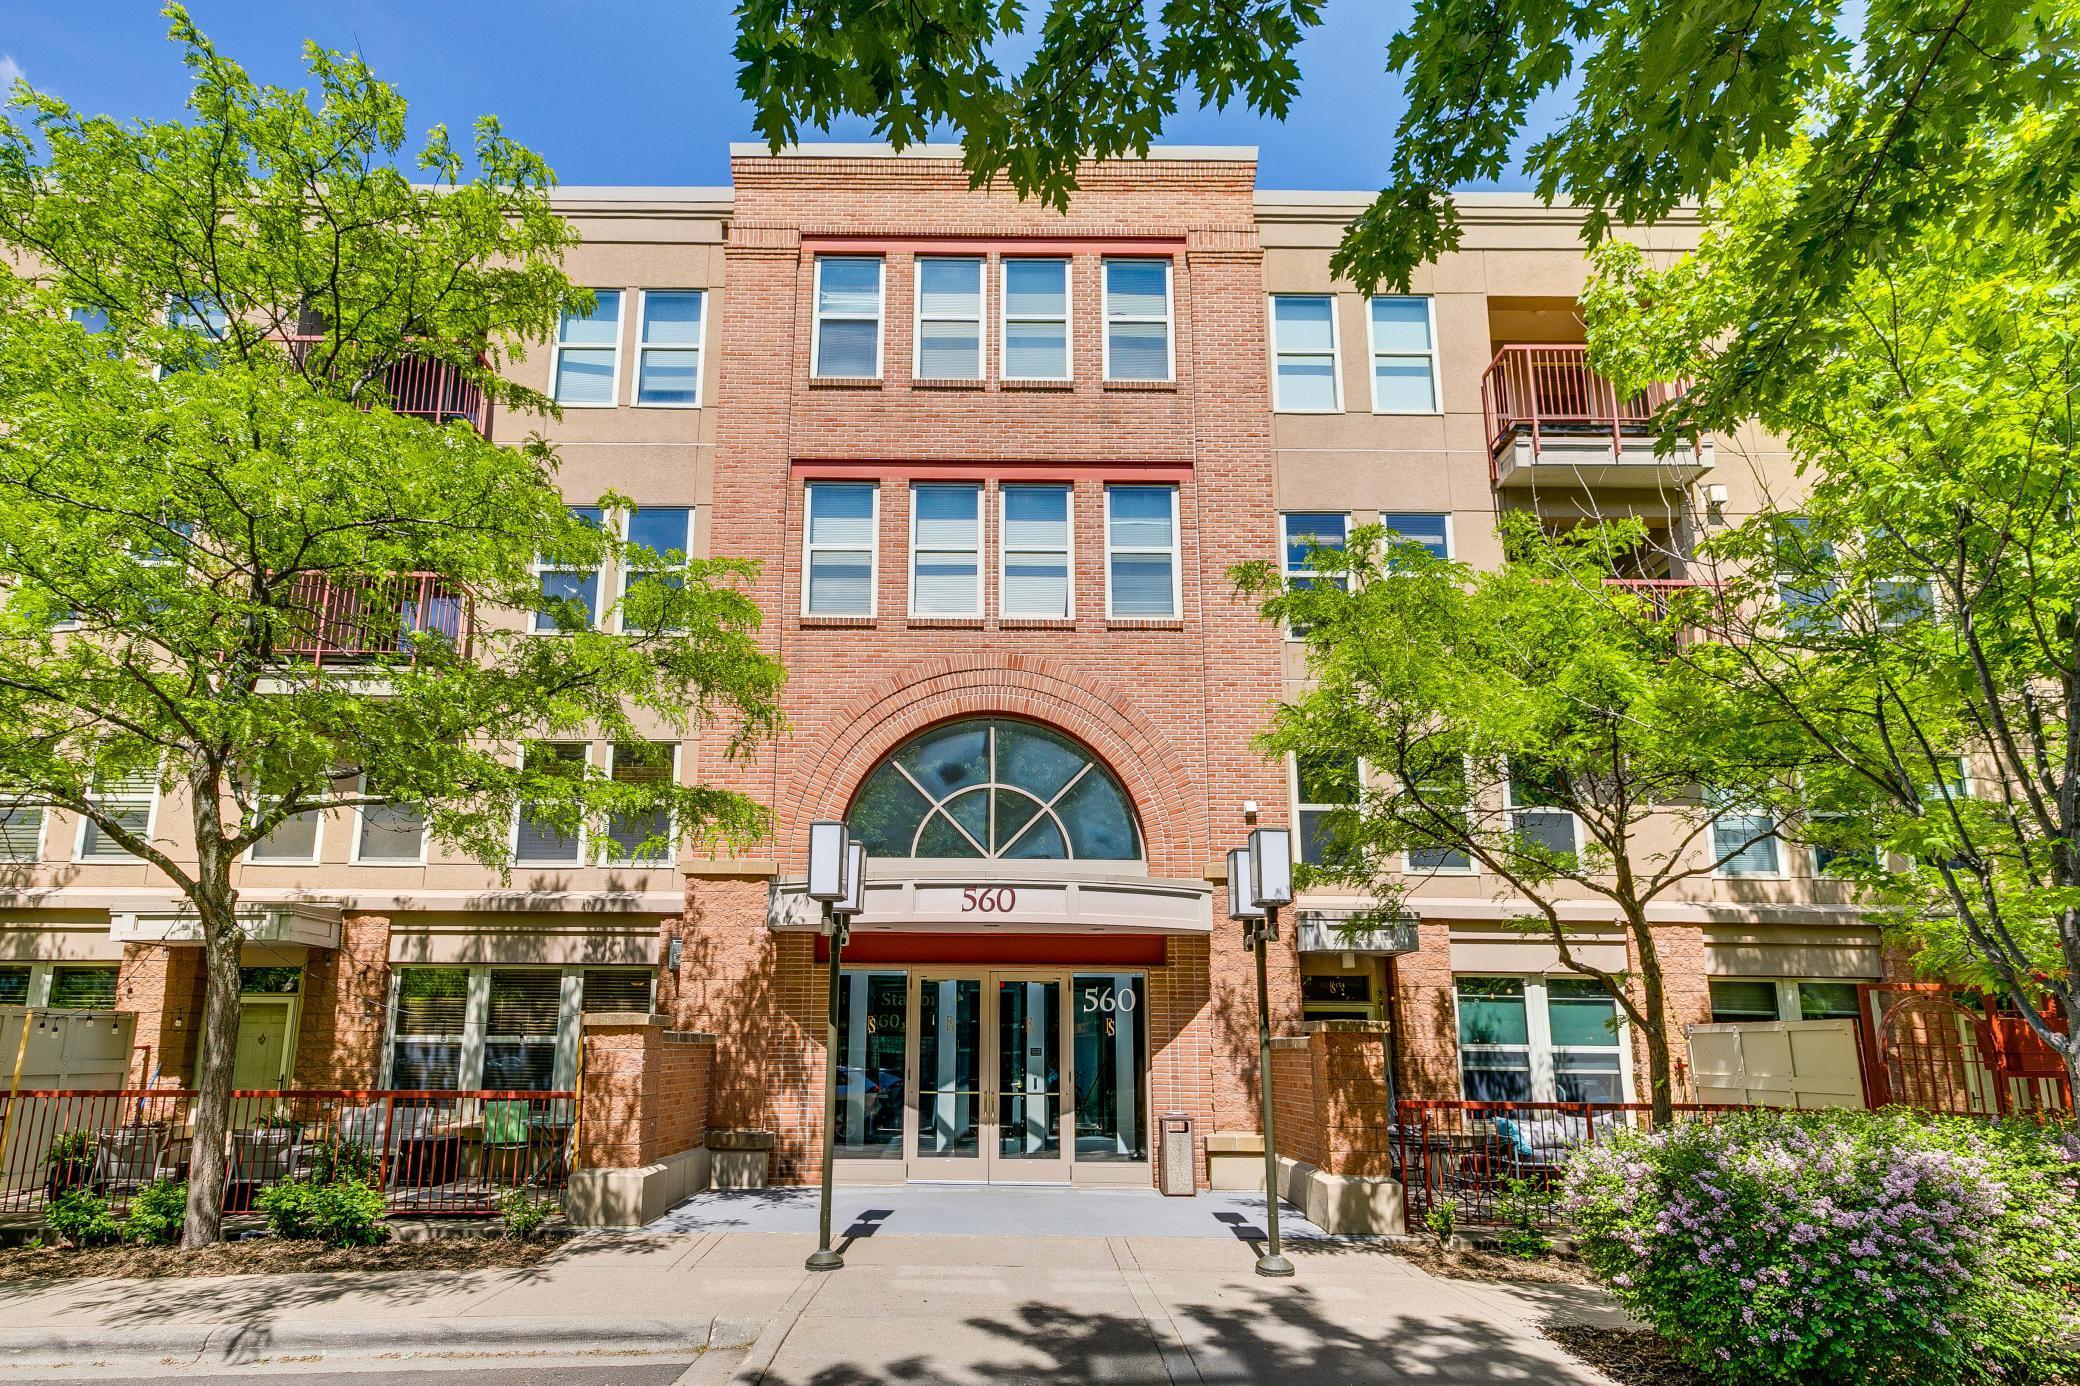
Active
$350,000
1
bds
|
2
ba
|
1,089
sqft
|
built
2001
560 N 2nd St, Minneapolis, MN 55401
$-1,310
Cash flow
-19.5%
Cash-on-Cash Return
1.8%
Cap rate
0.7%
Rent to Value Ratio
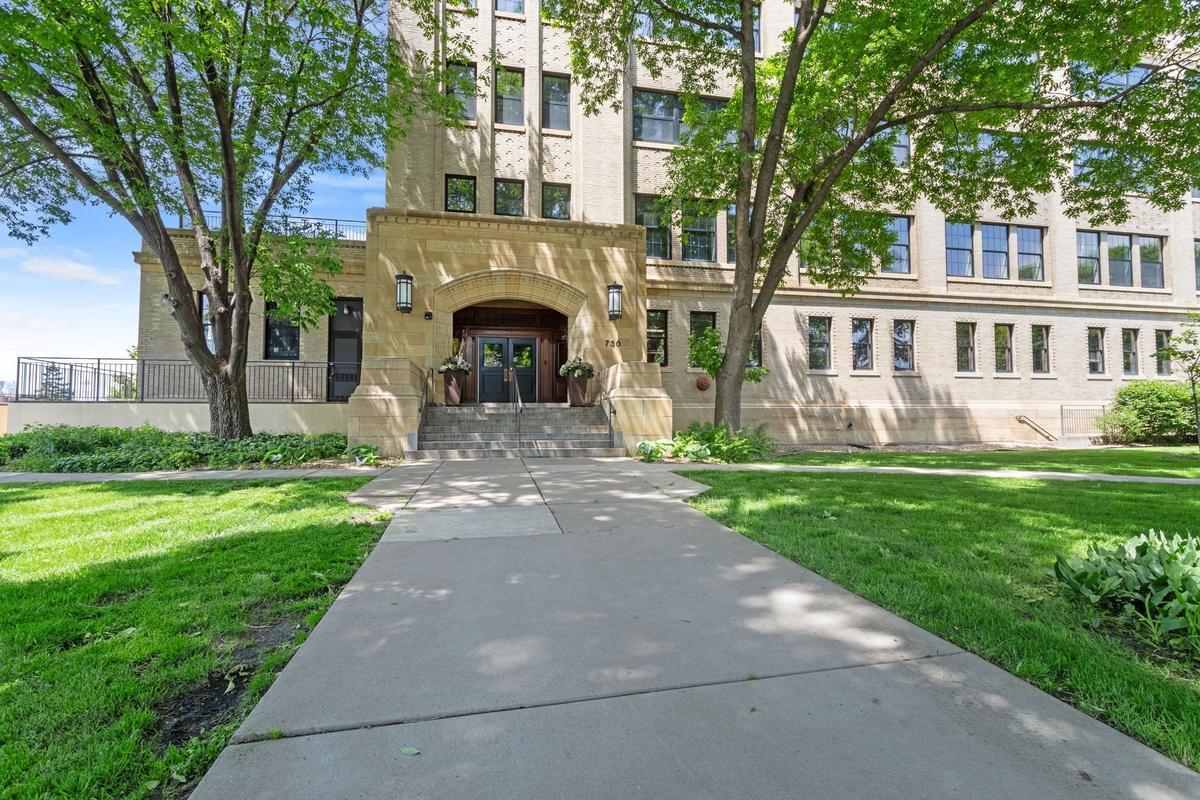
Active
$374,900
2
bds
|
1
ba
|
1,103
sqft
|
built
2007
730 Stinson Blvd, Minneapolis, MN 55413
$-1,293
Cash flow
-18.0%
Cash-on-Cash Return
2.1%
Cap rate
0.7%
Rent to Value Ratio
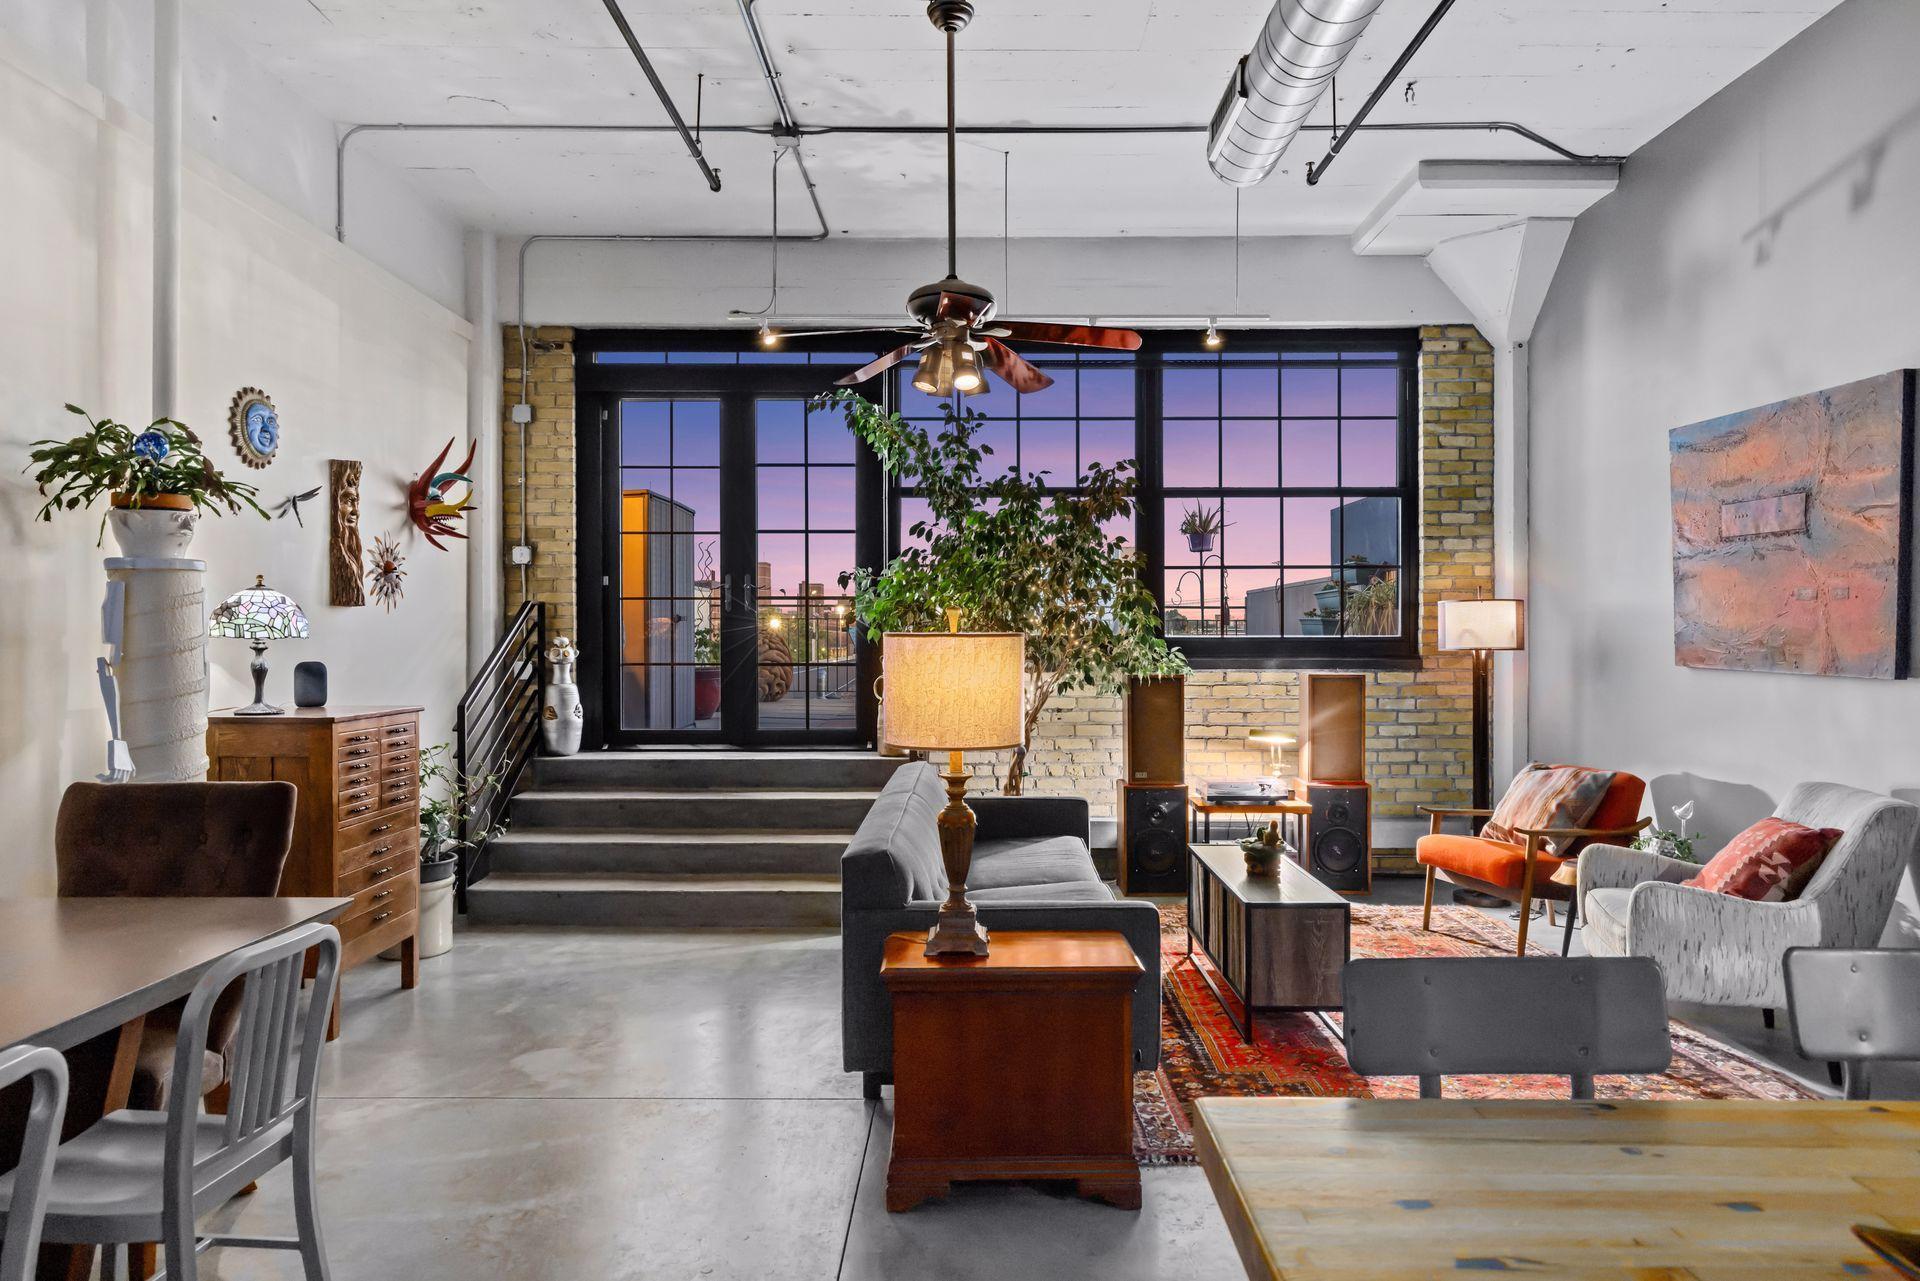
Active
$189,900
1
bds
|
1
ba
|
884
sqft
|
built
1928
730 Stinson Blvd, Minneapolis, MN 55413
$-683
Cash flow
-18.8%
Cash-on-Cash Return
2.0%
Cap rate
0.9%
Rent to Value Ratio
Active
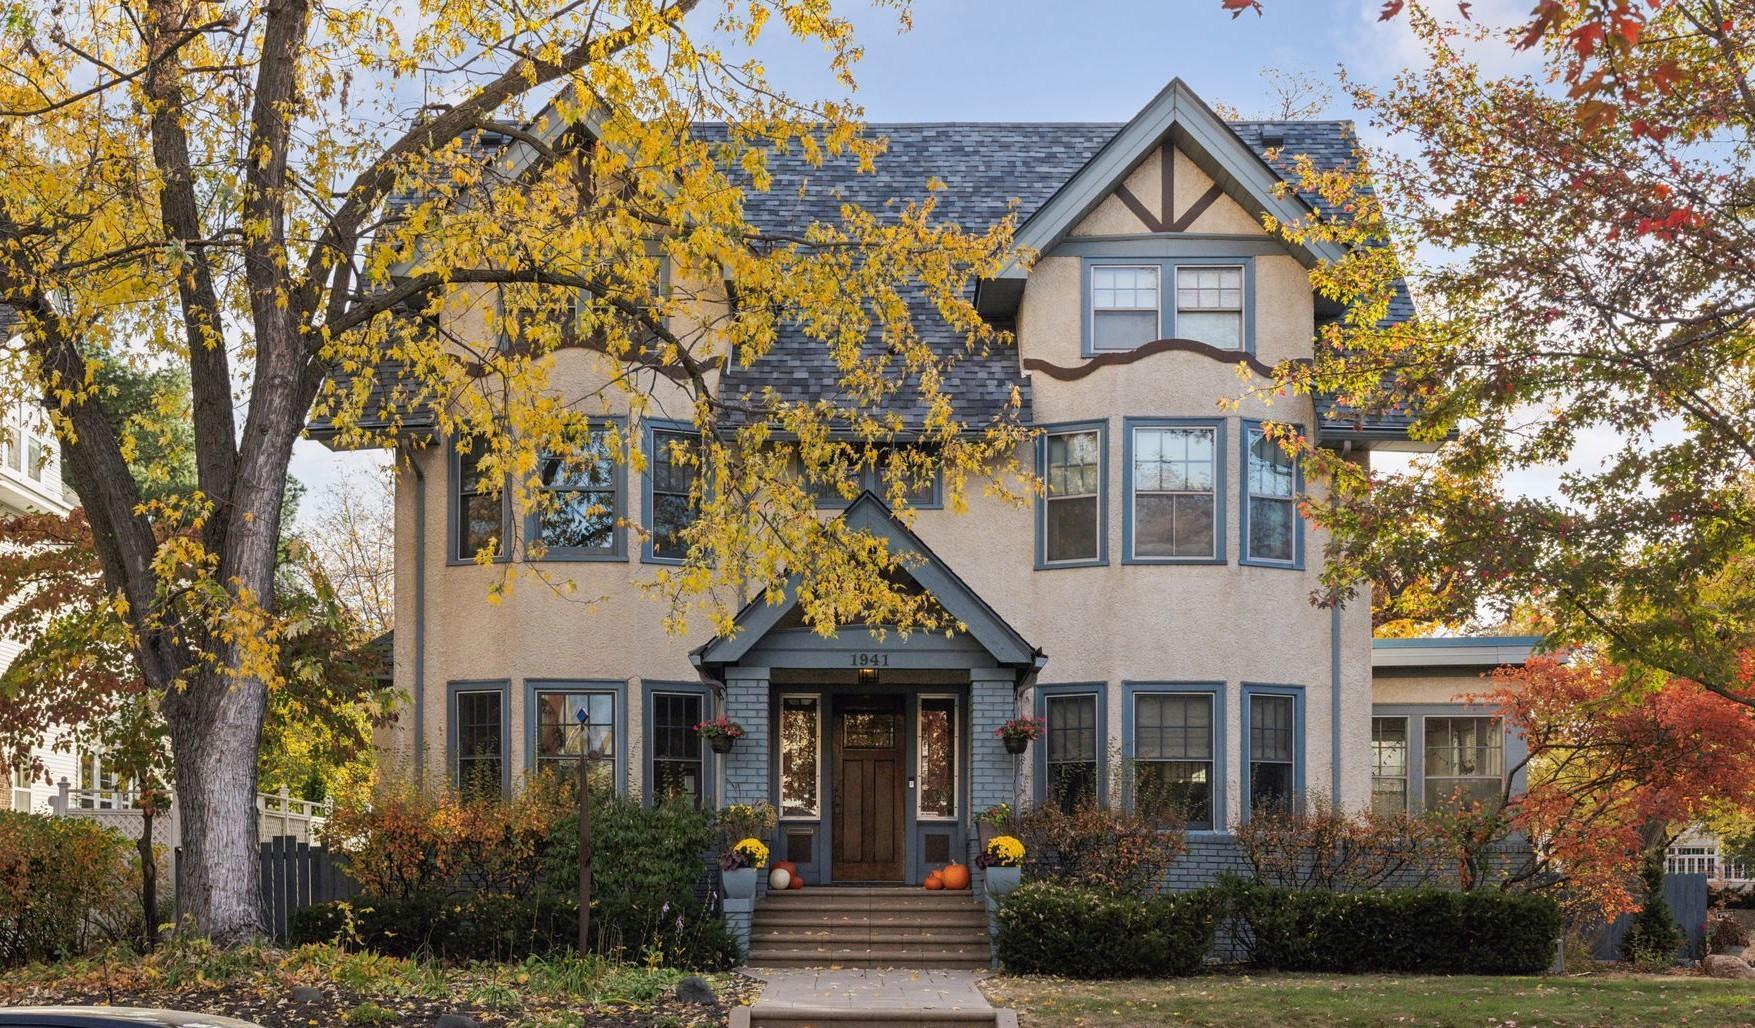
$1,275,000
6
bds
|
5
ba
|
4,108
sqft
|
built
1910
1941 James Ave S, Minneapolis, MN 55403
$-5,086
Cash flow
-20.8%
Cash-on-Cash Return
1.5%
Cap rate
0.3%
Rent to Value Ratio
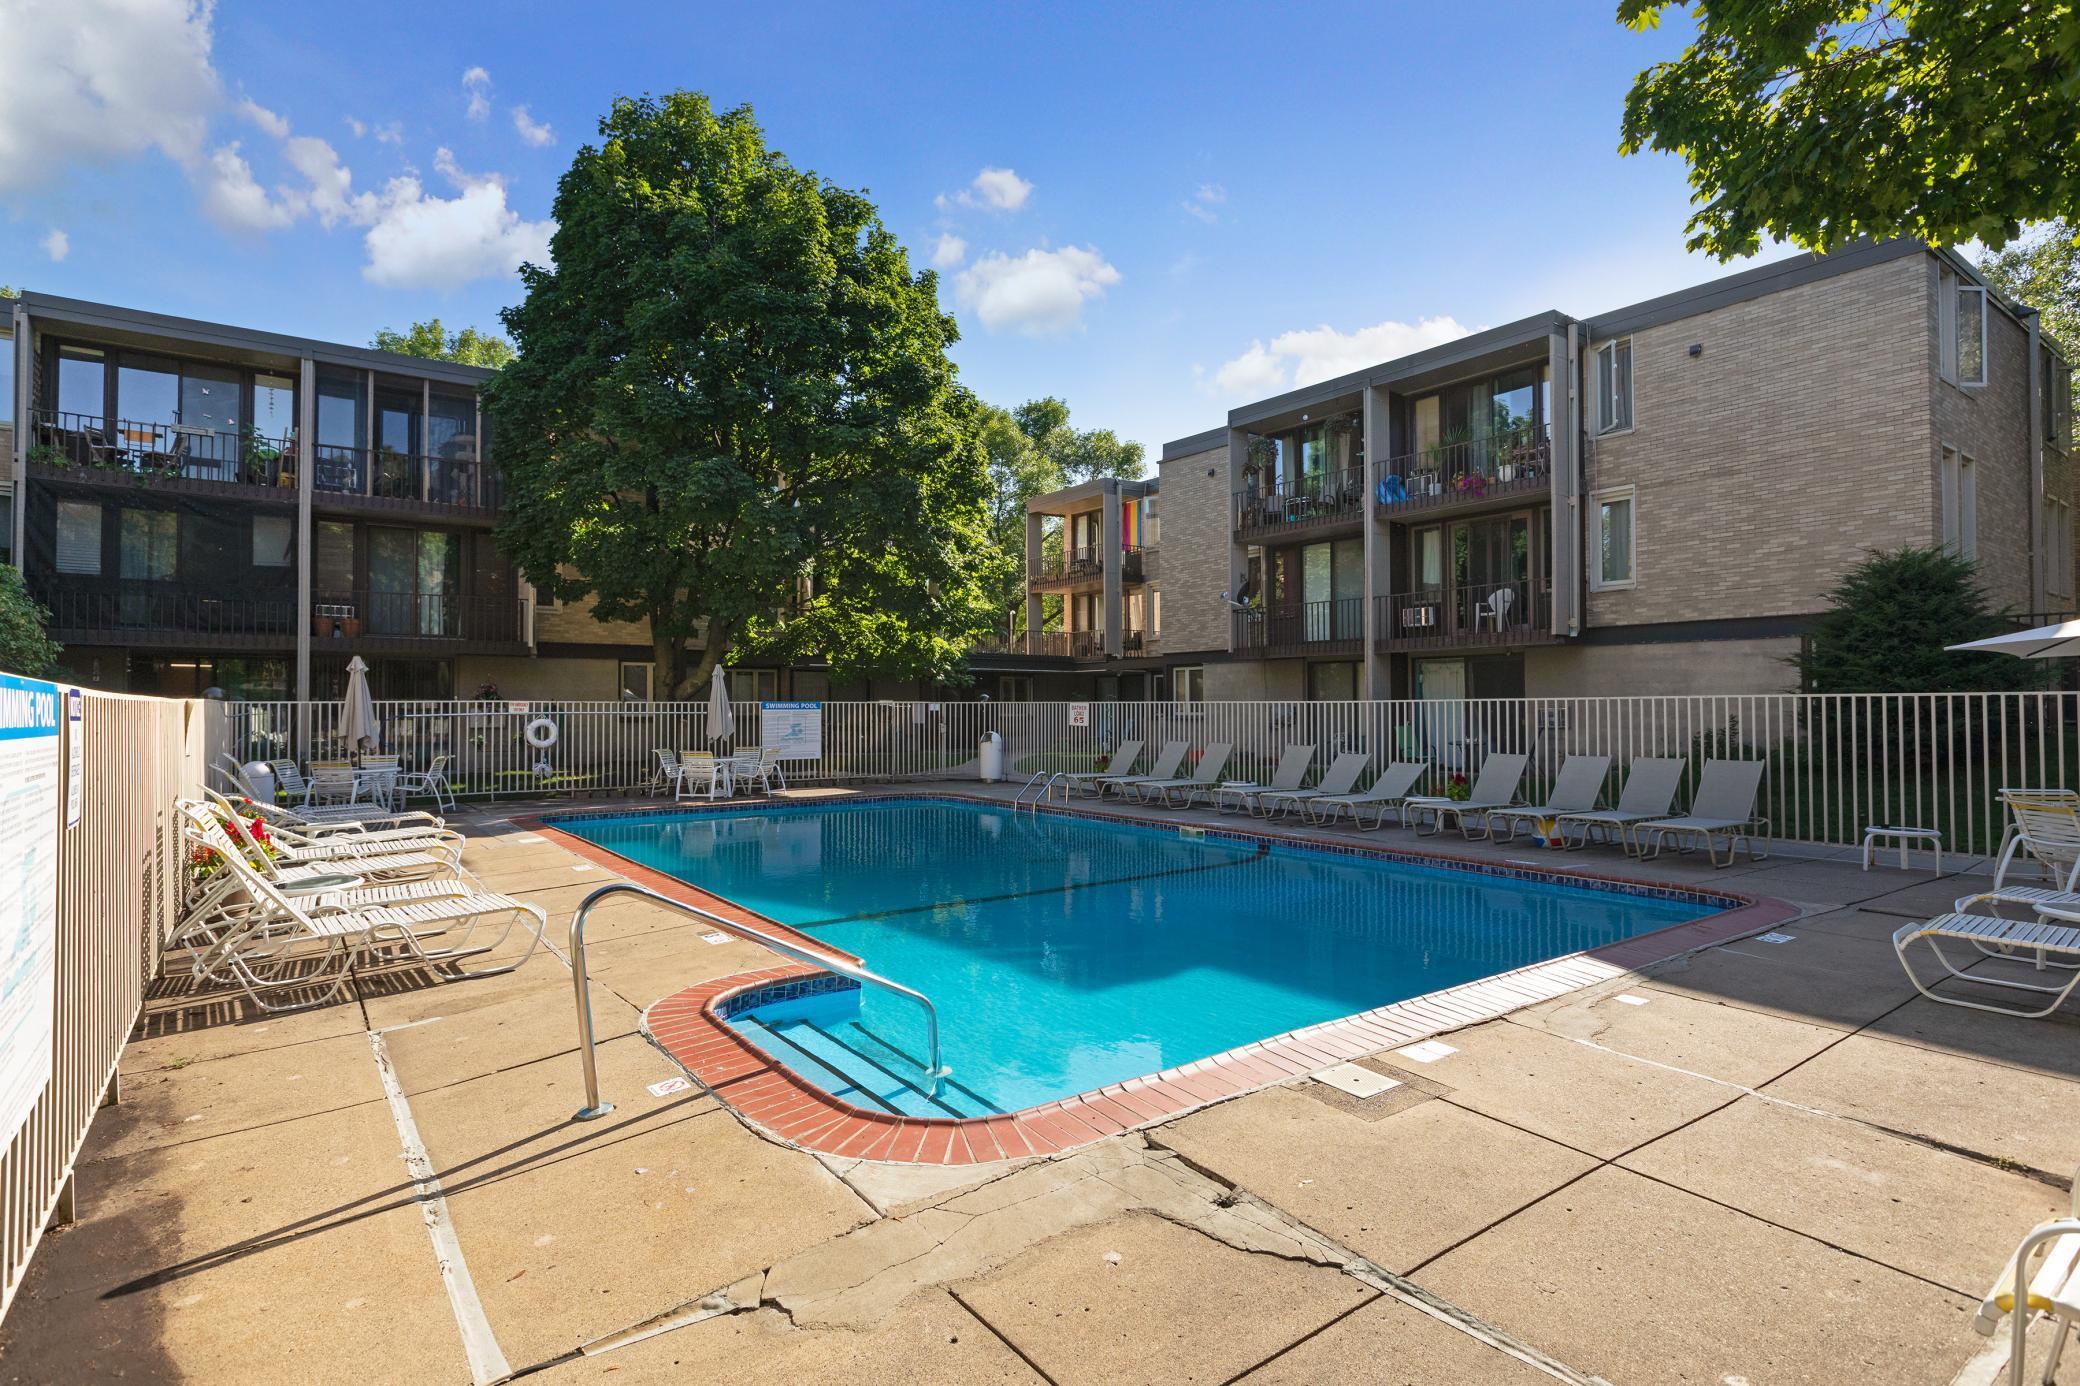
Active
$279,900
2
bds
|
2
ba
|
1,200
sqft
|
built
1986
1425 W 28th St, Minneapolis, MN 55408
$-1,354
Cash flow
-25.2%
Cash-on-Cash Return
0.5%
Cap rate
0.7%
Rent to Value Ratio
Active
$499,900
3
bds
|
2
ba
|
2,659
sqft
|
built
1930
1928 Cleveland St NE, Minneapolis, MN 55418
$-859
Cash flow
-9.0%
Cash-on-Cash Return
4.2%
Cap rate
0.6%
Rent to Value Ratio
Active
$315,000
3
bds
|
1
ba
|
1,317
sqft
|
built
1900
1907 University Ave NE, Minneapolis, MN 55418
$-244
Cash flow
-4.0%
Cash-on-Cash Return
5.4%
Cap rate
0.8%
Rent to Value Ratio
Active
$379,000
2
bds
|
1
ba
|
1,229
sqft
|
built
1922
2517 Humboldt Ave S, Minneapolis, MN 55405
$-1,217
Cash flow
-16.8%
Cash-on-Cash Return
2.4%
Cap rate
0.7%
Rent to Value Ratio
Active
$200,000
2
bds
|
1
ba
|
952
sqft
|
built
1972
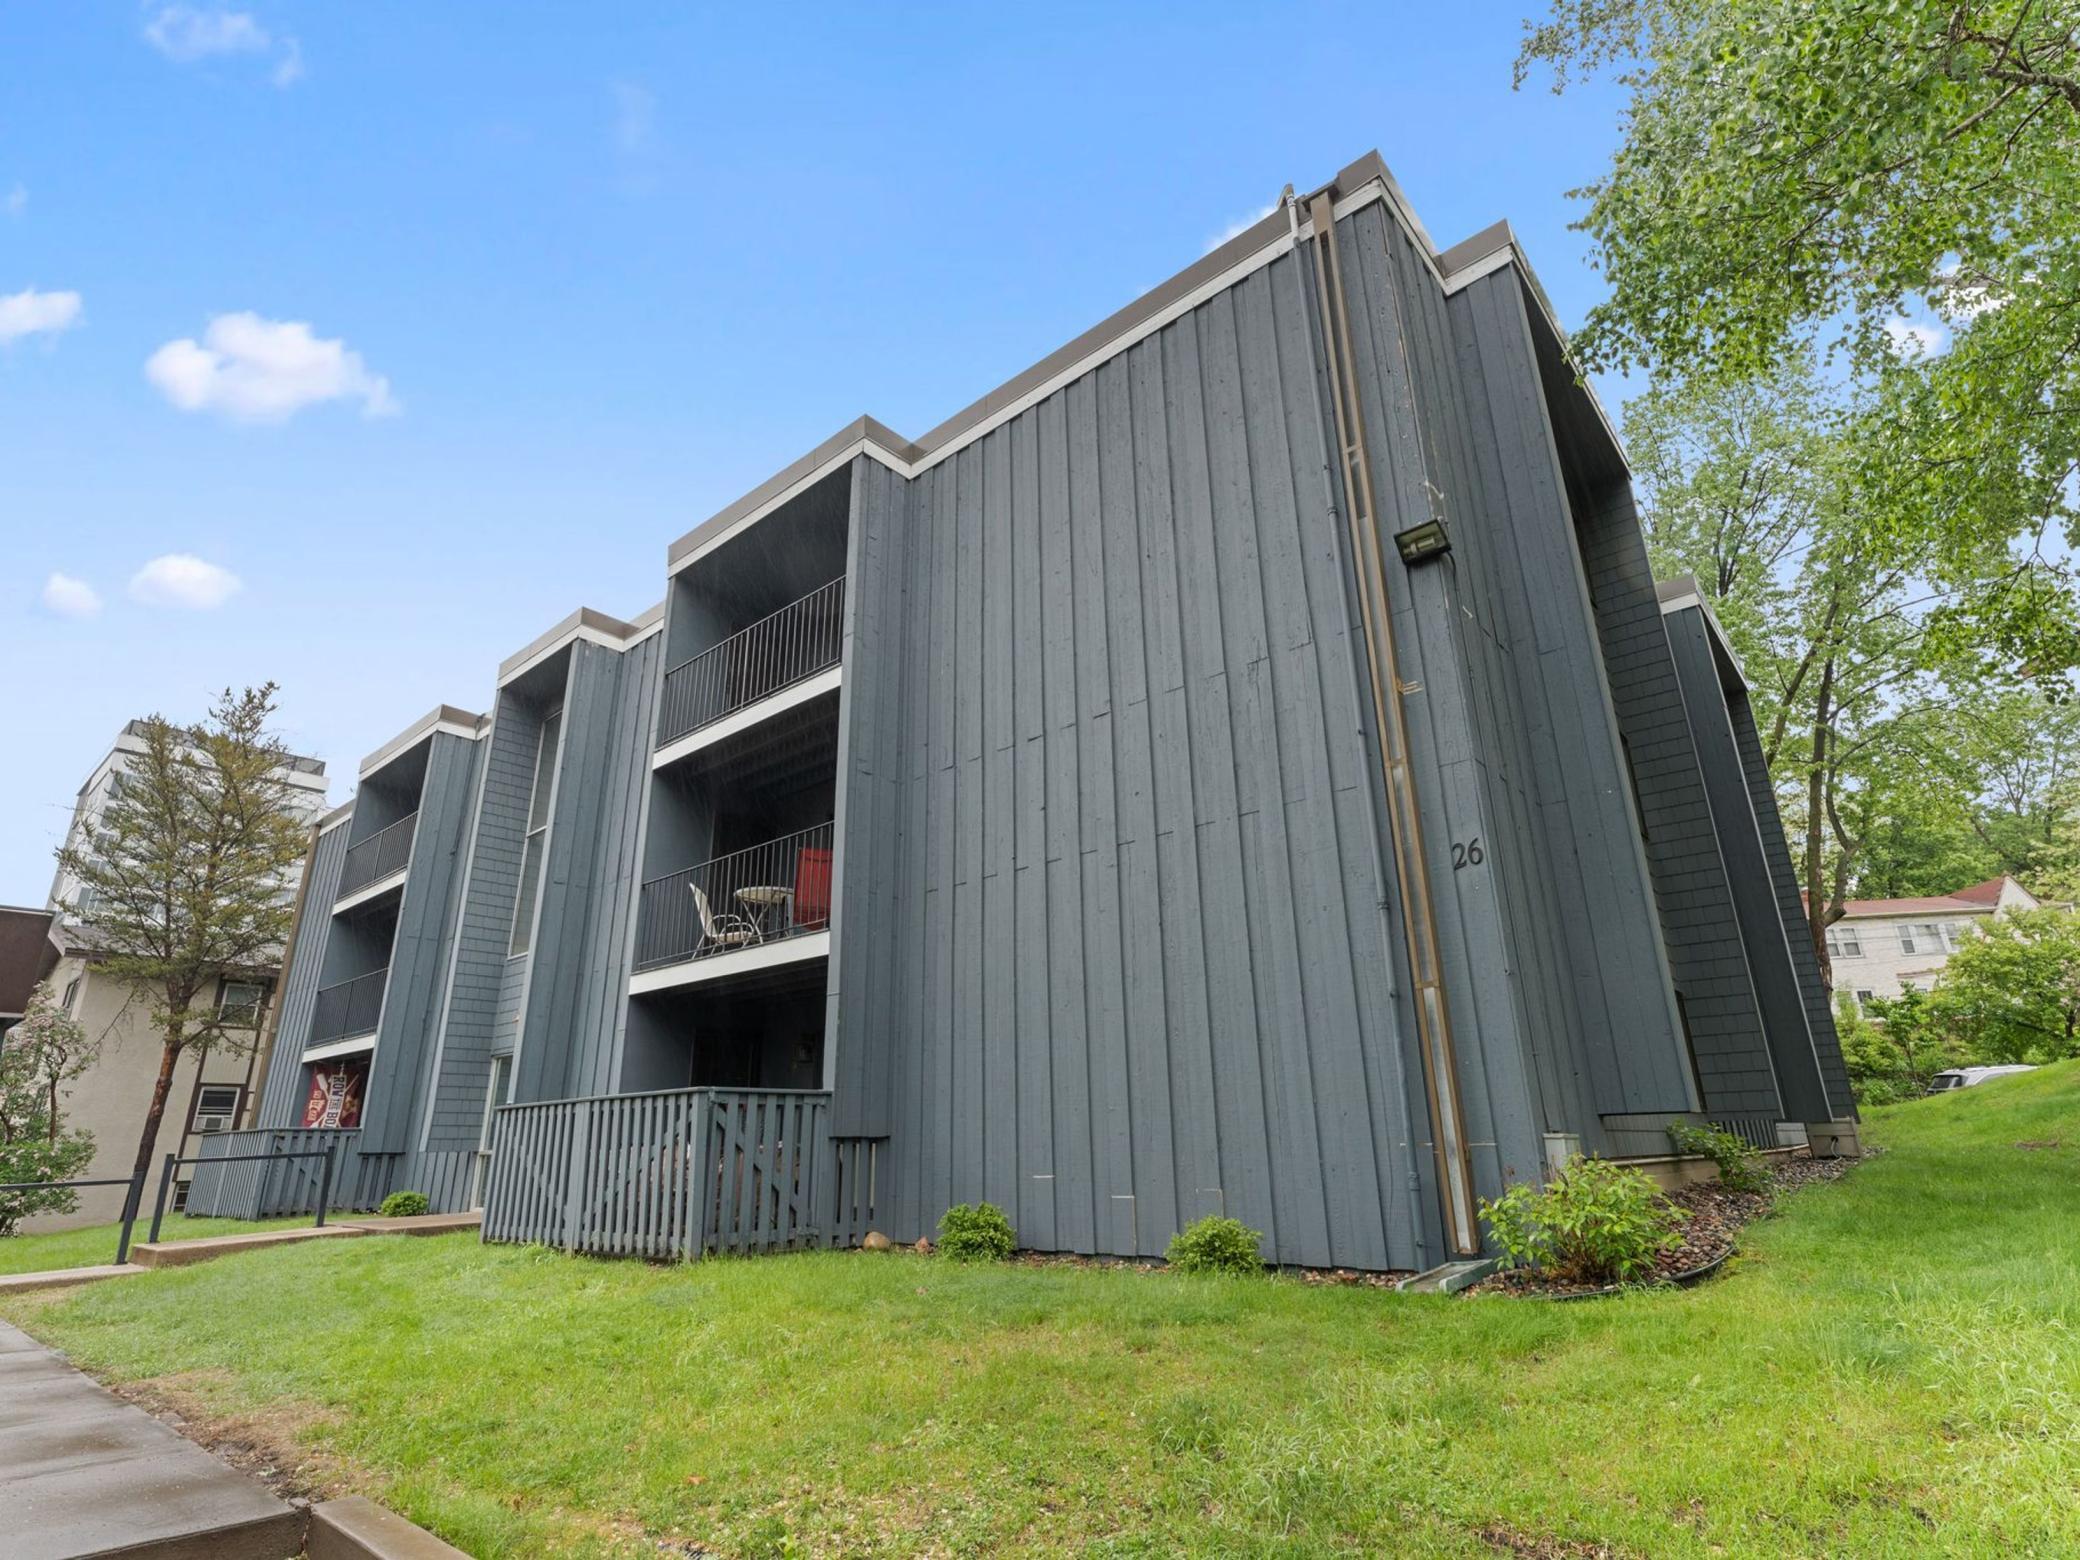
26 Arthur Ave SE, Minneapolis, MN 55414
$-370
Cash flow
-9.7%
Cash-on-Cash Return
4.1%
Cap rate
1.0%
Rent to Value Ratio
Active
$169,900
1
bds
|
1
ba
|
741
sqft
|
built
1968
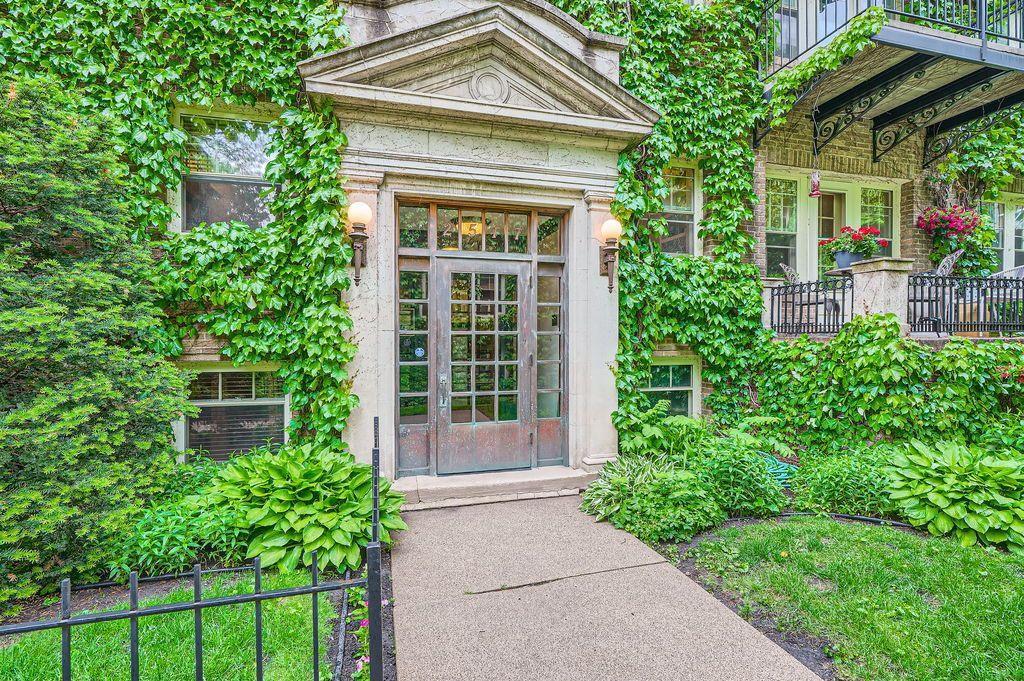
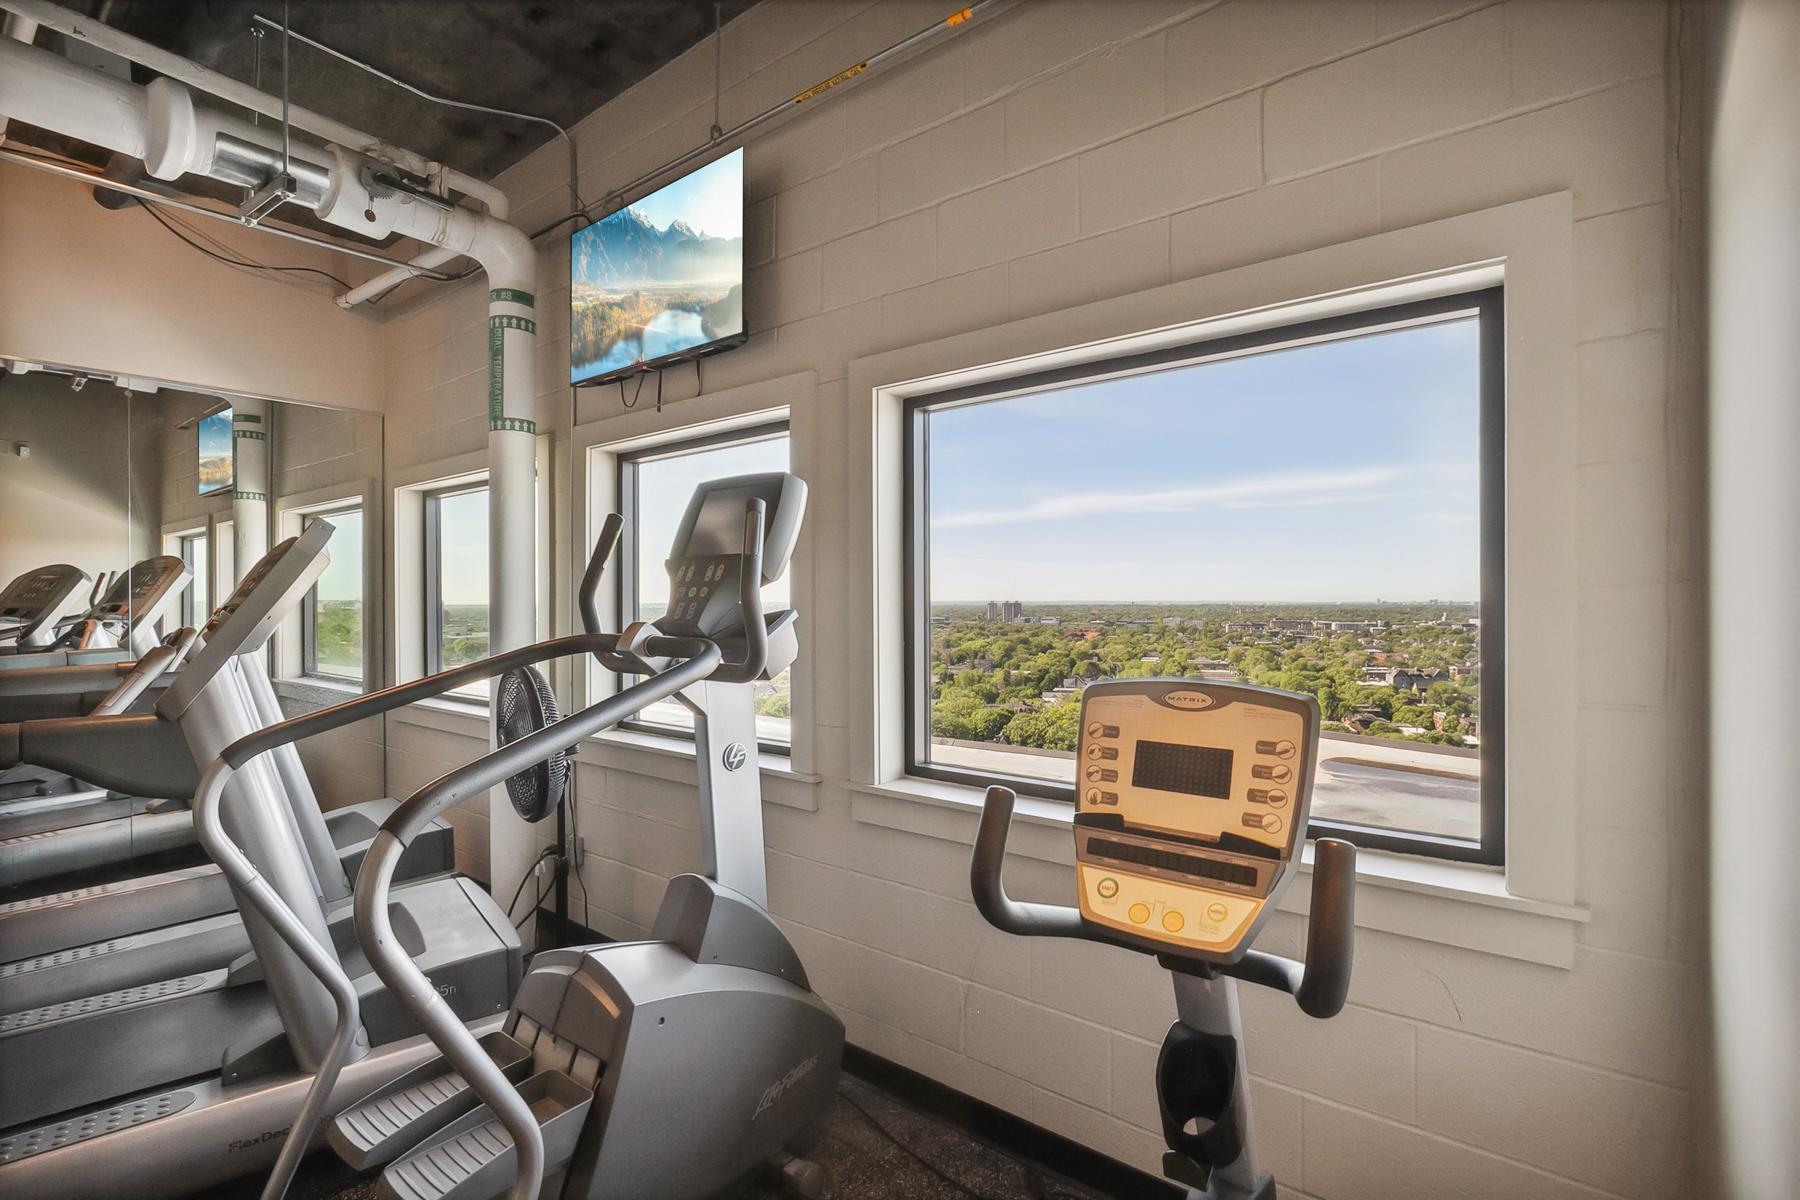
400 Groveland Ave, Minneapolis, MN 55403
$-757
Cash flow
-23.2%
Cash-on-Cash Return
0.9%
Cap rate
0.9%
Rent to Value Ratio
Active
$299,900
3
bds
|
2
ba
|
1,357
sqft
|
built
1924
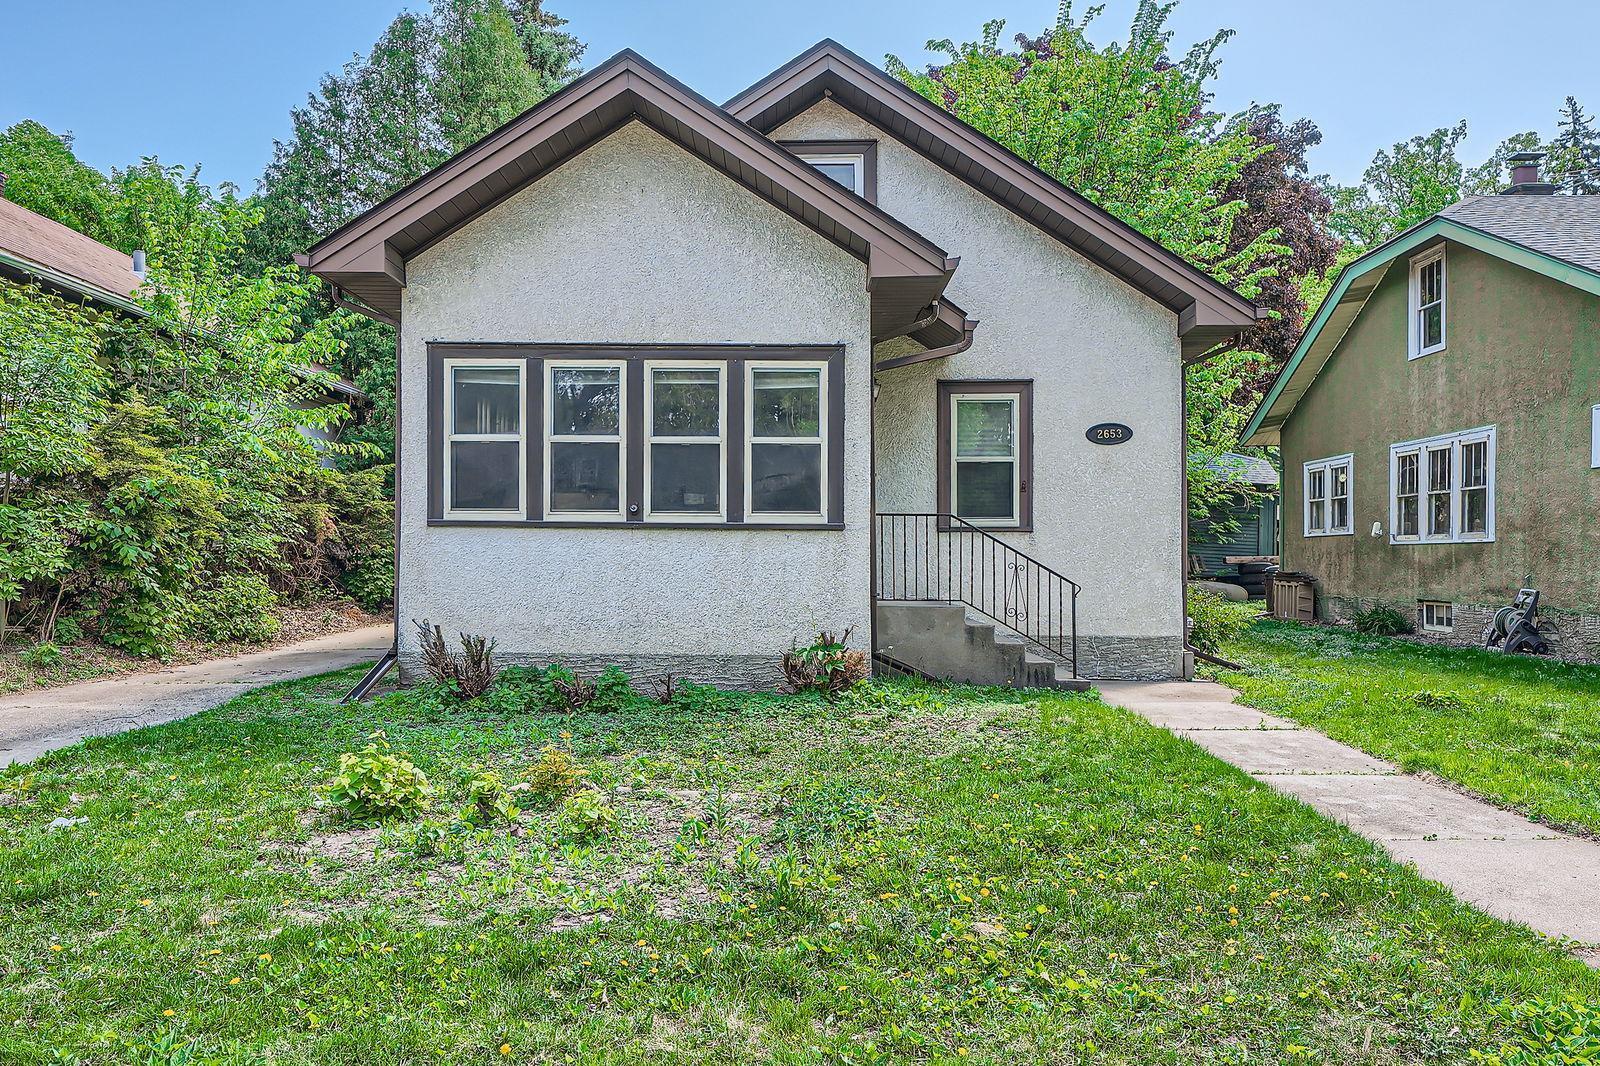
2653 Pierce St NE, Minneapolis, MN 55418
$-172
Cash flow
-3.0%
Cash-on-Cash Return
5.6%
Cap rate
0.9%
Rent to Value Ratio
Active
$230,000
2
bds
|
1
ba
|
983
sqft
|
built
1950
111 E Franklin Ave, Minneapolis, MN 55404
$-806
Cash flow
-18.3%
Cash-on-Cash Return
2.1%
Cap rate
0.9%
Rent to Value Ratio
Active
$629,900
12
bds
|
4
ba
|
3,932
sqft
|
built
1919
3129 Garfield Ave, Minneapolis, MN 55408
$-2,780
Cash flow
-23.0%
Cash-on-Cash Return
1.0%
Cap rate
0.3%
Rent to Value Ratio
Active
$265,000
2
bds
|
2
ba
|
1,177
sqft
|
built
1998
10708 Sycamore St NW, Minneapolis, MN 55433
$-480
Cash flow
-9.5%
Cash-on-Cash Return
4.1%
Cap rate
0.8%
Rent to Value Ratio
Active
$269,900
4
bds
|
2
ba
|
1,708
sqft
|
built
1930
3330 Irving Ave N, Minneapolis, MN 55412
$-182
Cash flow
-3.5%
Cash-on-Cash Return
5.5%
Cap rate
0.9%
Rent to Value Ratio
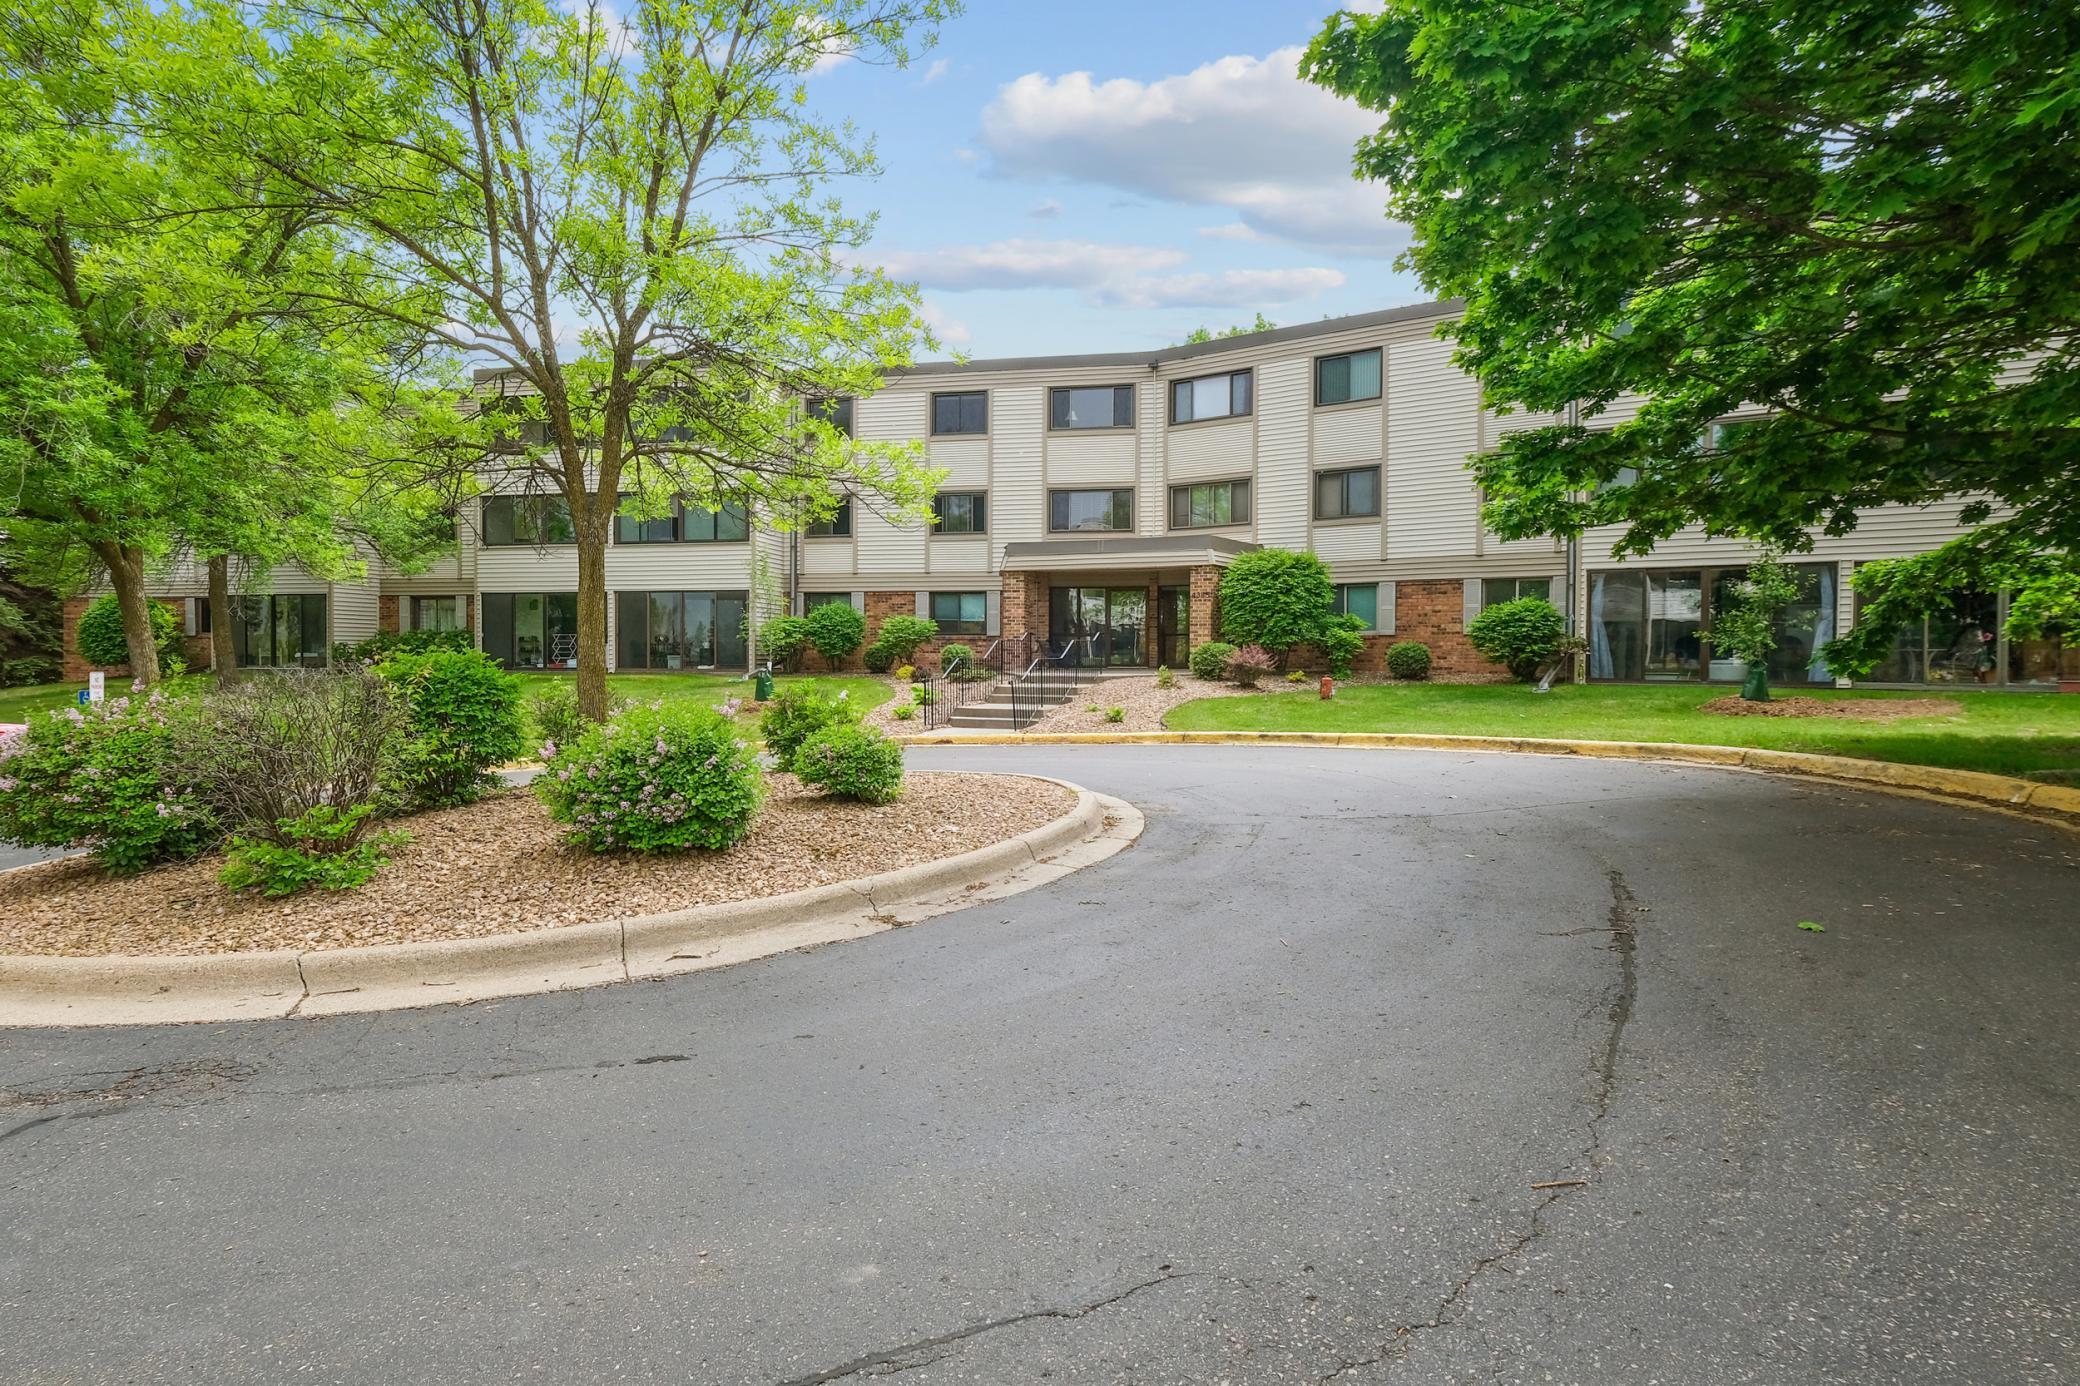
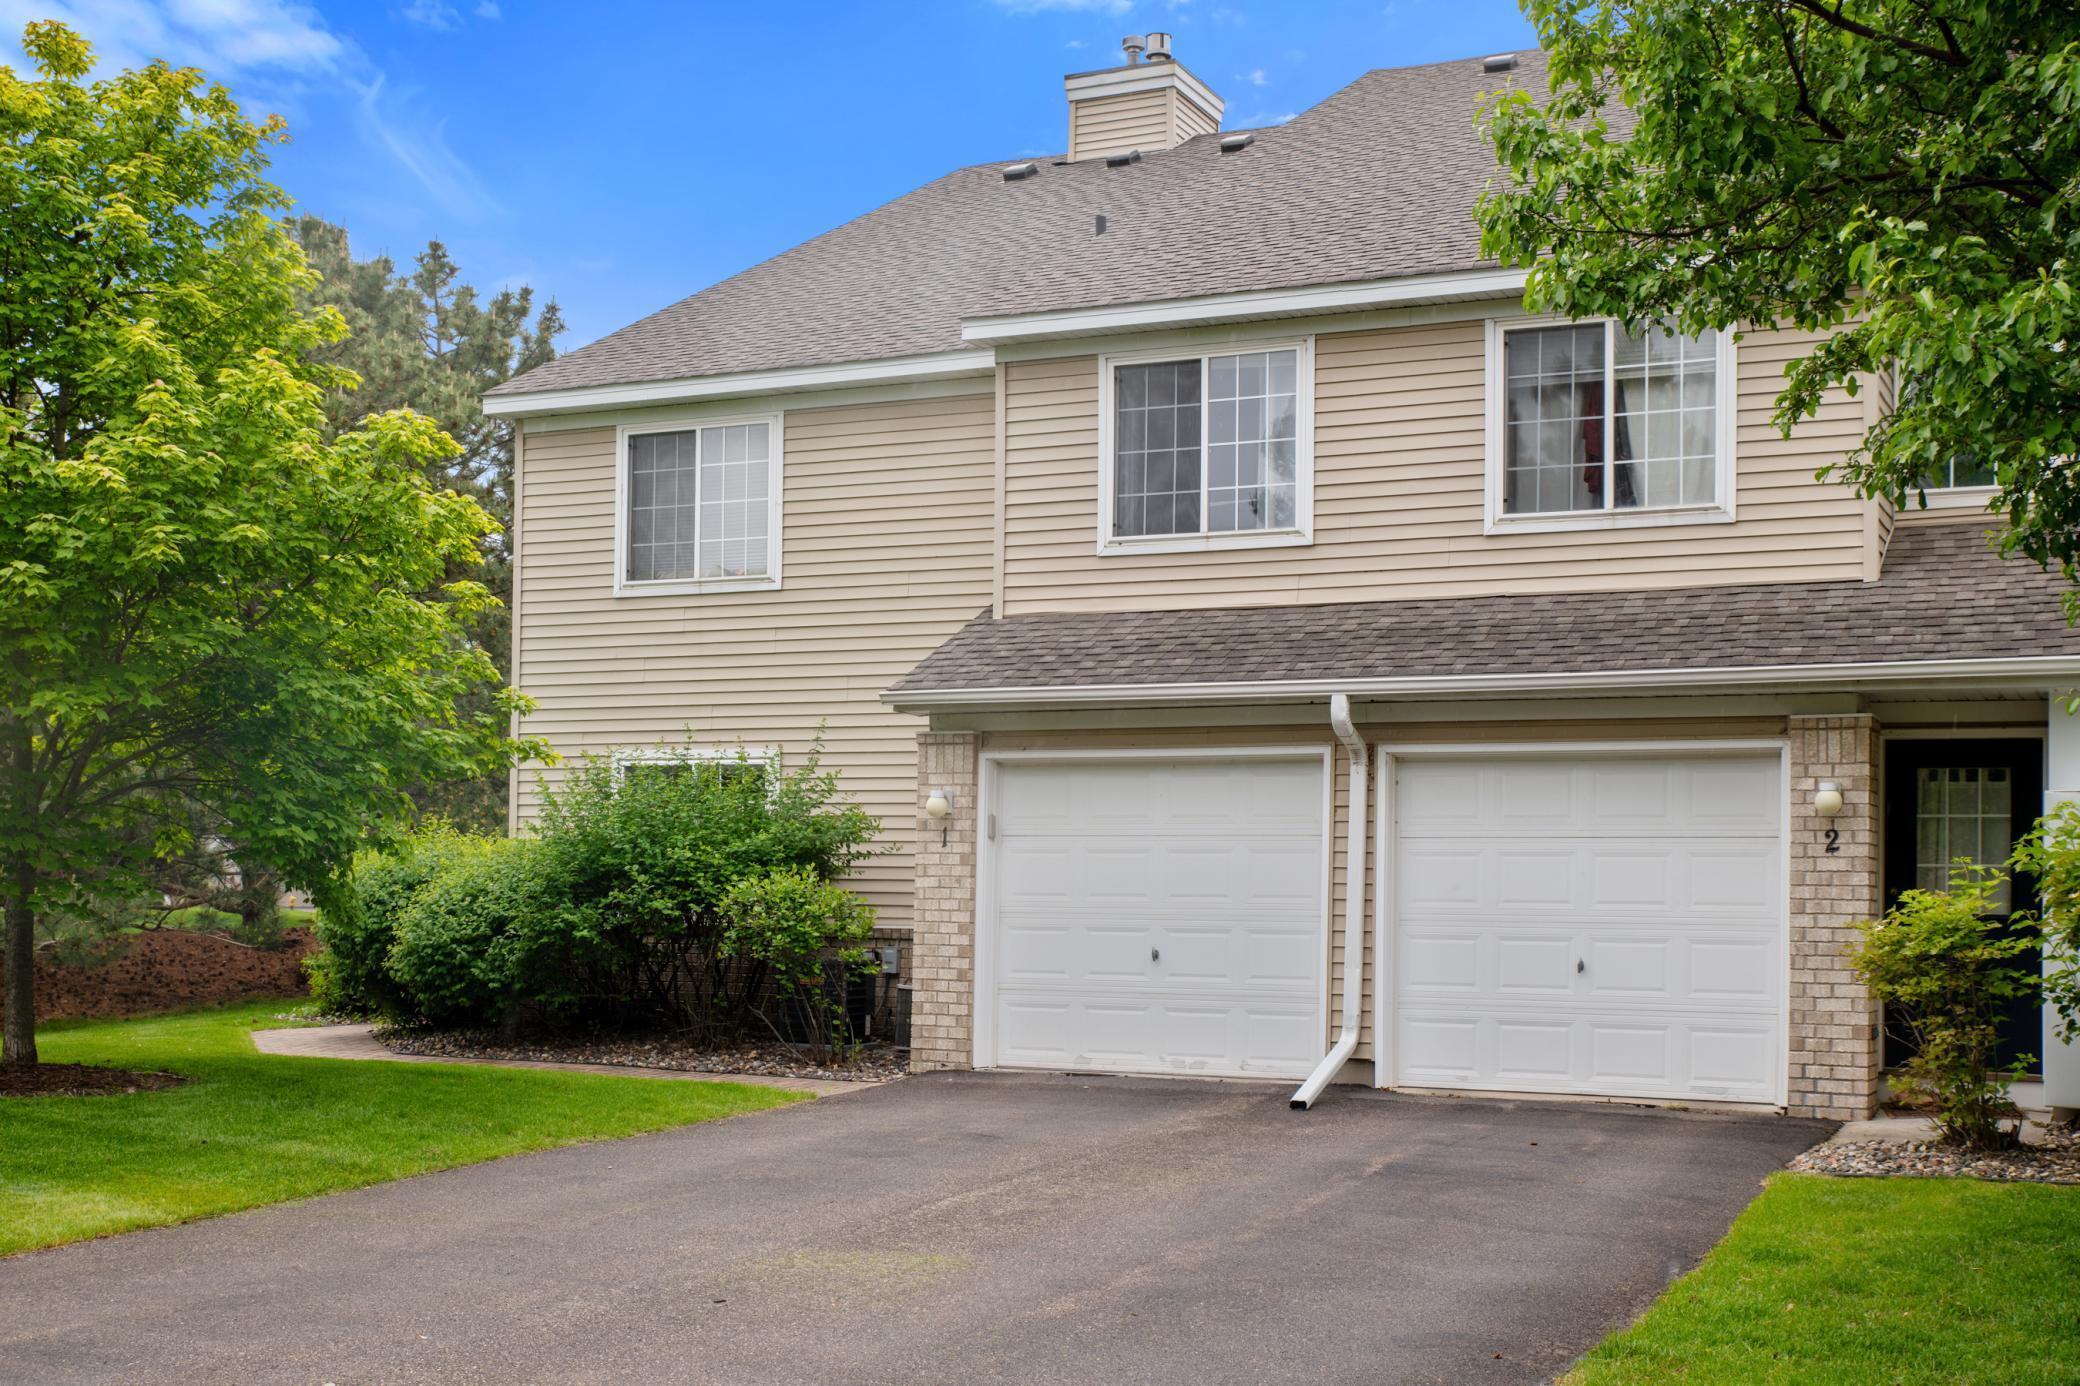
Pending
$219,500
2
bds
|
2
ba
|
1,210
sqft
|
built
1985
4385 Trenton Ln N, Minneapolis, MN 55442
$-485
Cash flow
-11.5%
Cash-on-Cash Return
3.6%
Cap rate
0.9%
Rent to Value Ratio

Active
$1,250,000
3
bds
|
2
ba
|
1,876
sqft
|
built
2006
100 3rd Ave S, Minneapolis, MN 55401
$-6,633
Cash flow
-27.7%
Cash-on-Cash Return
-0.1%
Cap rate
0.4%
Rent to Value Ratio
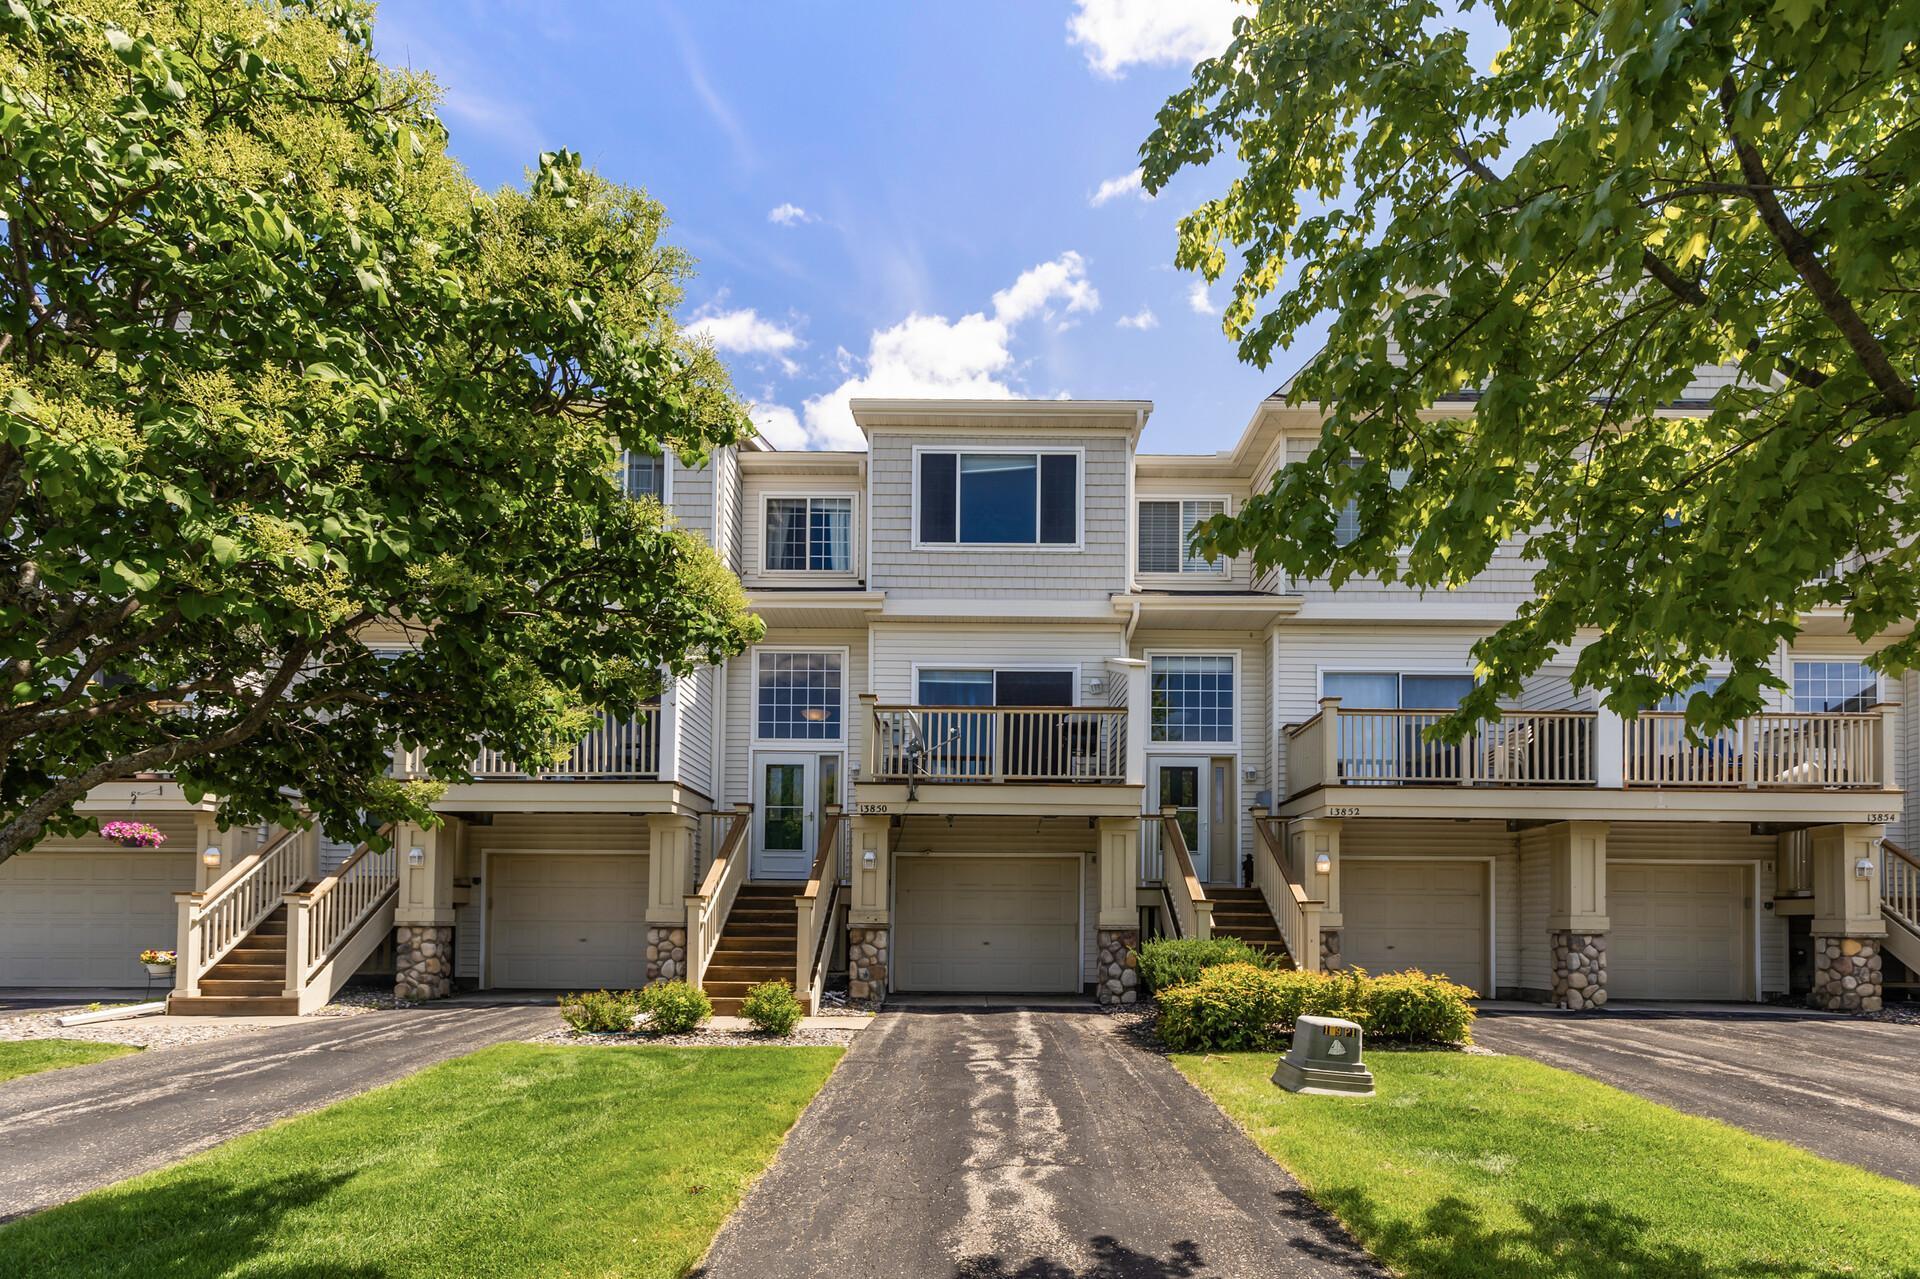
Active
$250,000
2
bds
|
2
ba
|
1,278
sqft
|
built
2003
13850 54th Ave N, Minneapolis, MN 55446
$-457
Cash flow
-9.5%
Cash-on-Cash Return
4.1%
Cap rate
0.8%
Rent to Value Ratio
Active
$1,825,000
5
bds
|
4
ba
|
3,871
sqft
|
built
1951
4805 Thomas Ave S, Minneapolis, MN 55410
$-8,204
Cash flow
-23.5%
Cash-on-Cash Return
0.9%
Cap rate
0.3%
Rent to Value Ratio
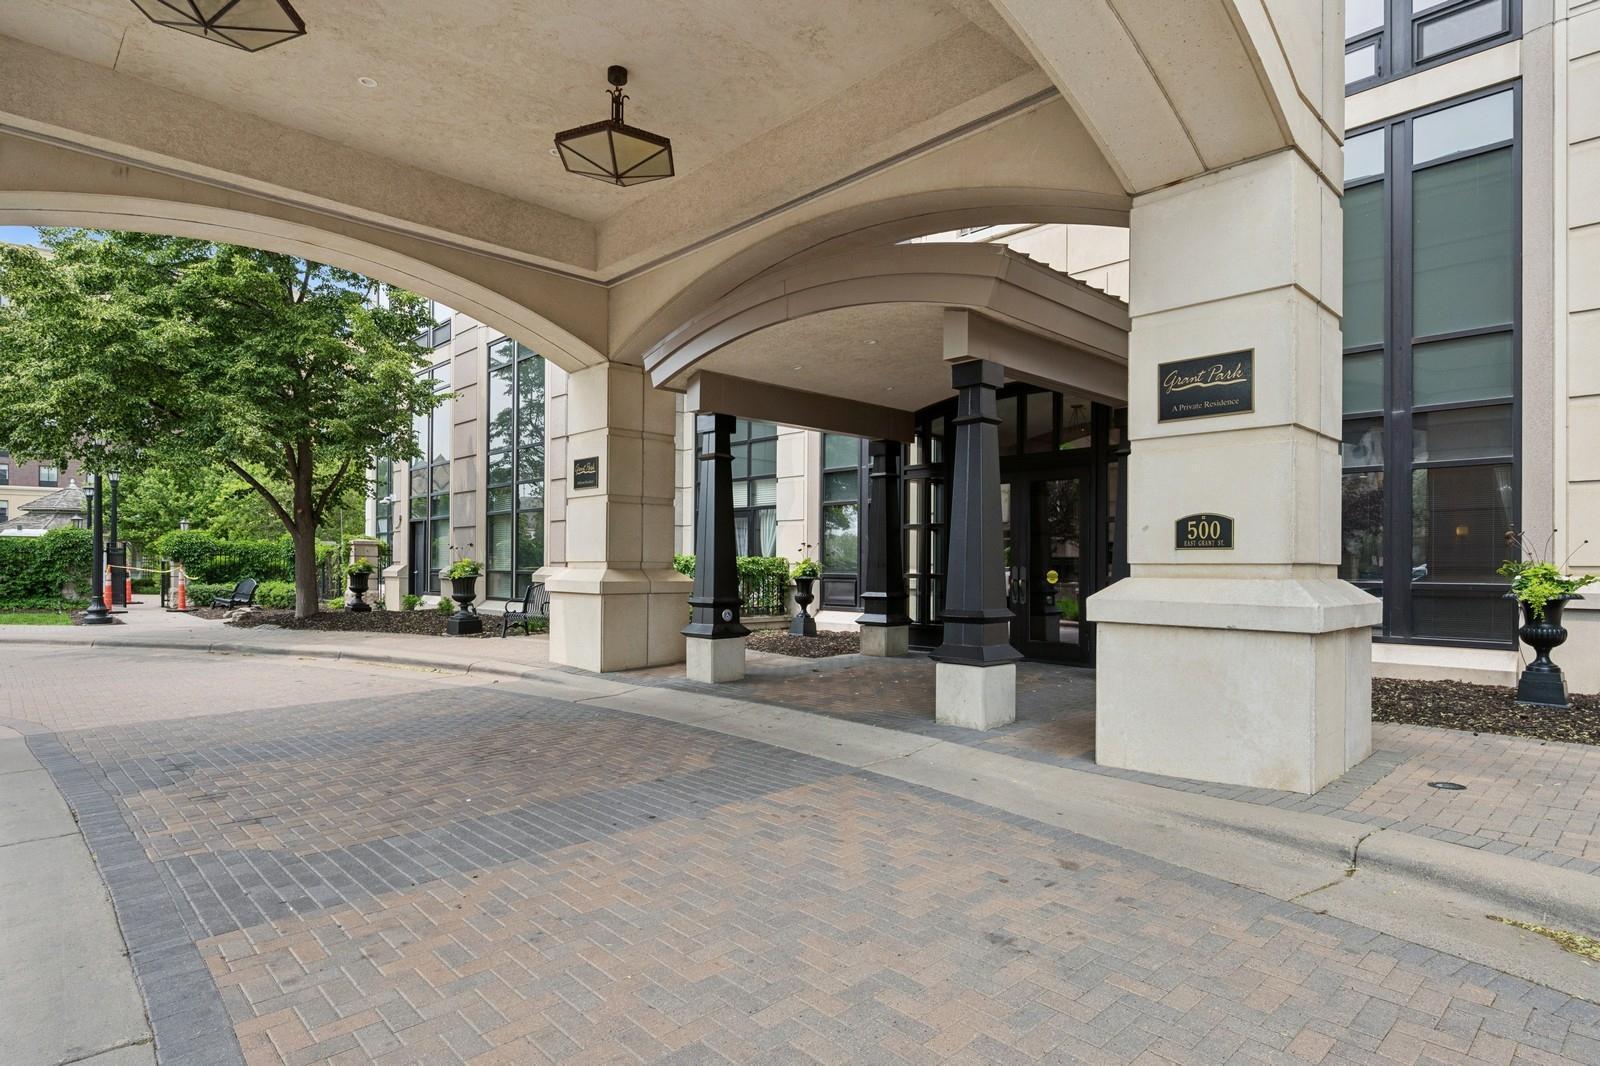
Active
$399,900
2
bds
|
2
ba
|
1,415
sqft
|
built
2004
500 E Grant St, Minneapolis, MN 55404
$-1,617
Cash flow
-21.1%
Cash-on-Cash Return
1.4%
Cap rate
0.7%
Rent to Value Ratio
Pending
$319,900
3
bds
|
1
ba
|
1,368
sqft
|
built
1952
5653 38th Ave S, Minneapolis, MN 55417
$-410
Cash flow
-6.7%
Cash-on-Cash Return
4.7%
Cap rate
0.7%
Rent to Value Ratio
Active
$215,000
2
bds
|
1
ba
|
914
sqft
|
built
1994
2225 Ranchview Ln N, Minneapolis, MN 55447
$-406
Cash flow
-9.9%
Cash-on-Cash Return
4.0%
Cap rate
0.9%
Rent to Value Ratio
Active
$99,900
1
bds
|
1
ba
|
671
sqft
|
built
1965
4029 14th Ave S, Minneapolis, MN 55407
$-237
Cash flow
-12.4%
Cash-on-Cash Return
3.4%
Cap rate
1.3%
Rent to Value Ratio
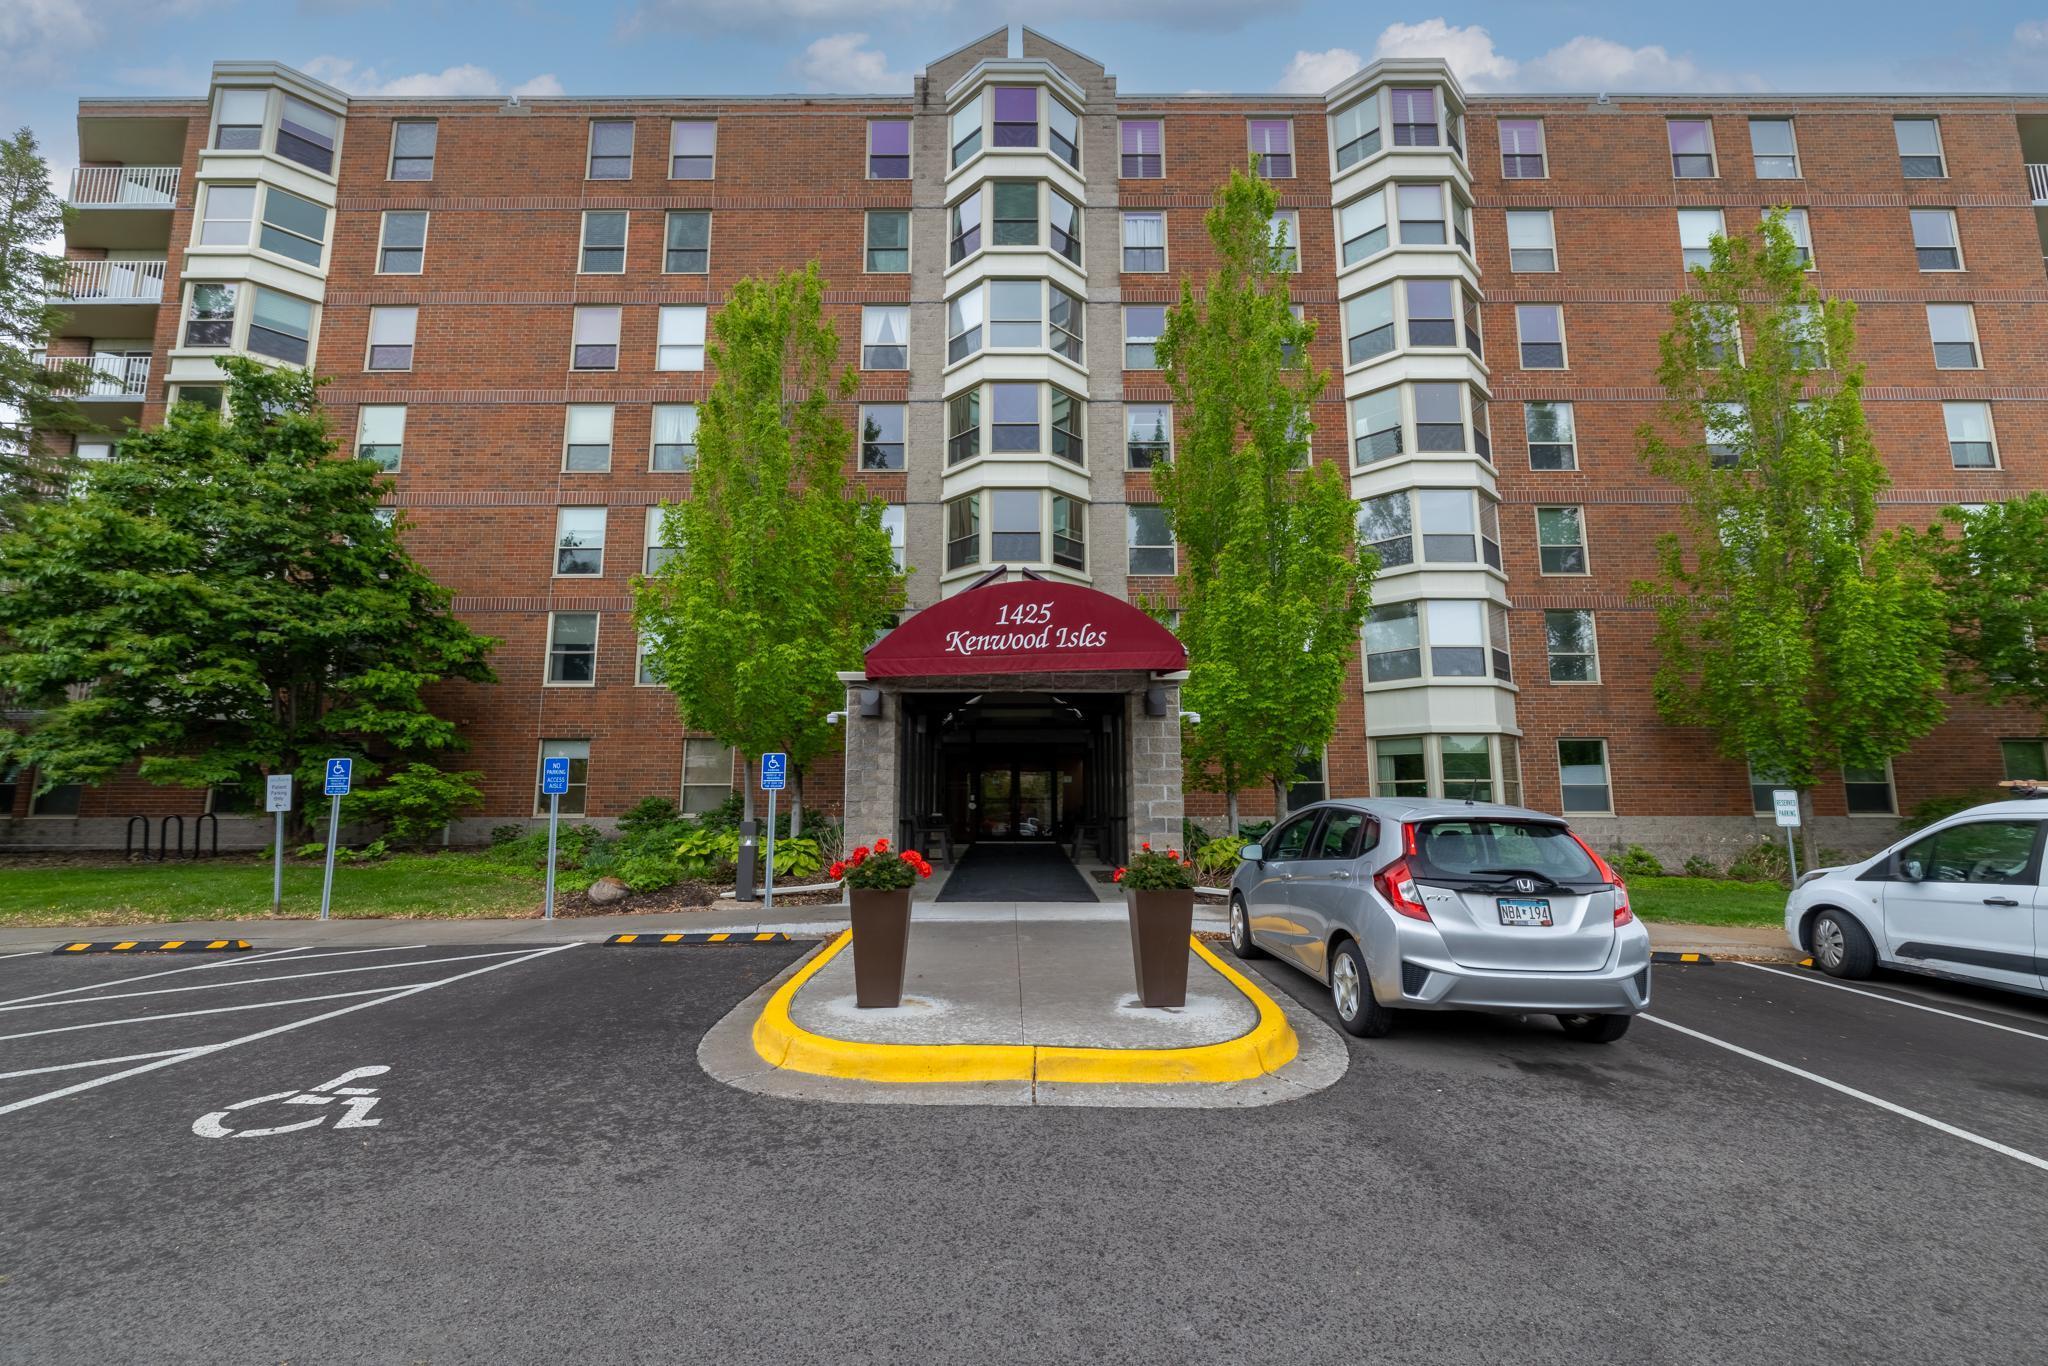
Active
$124,900
1
bds
|
1
ba
|
860
sqft
|
built
1986
1425 W 28th St, Minneapolis, MN 55408
$-554
Cash flow
-23.1%
Cash-on-Cash Return
1.0%
Cap rate
1.2%
Rent to Value Ratio
Active
$235,000
2
bds
|
1
ba
|
745
sqft
|
built
1912
2606 Humboldt Ave S, Minneapolis, MN 55408
$-472
Cash flow
-10.5%
Cash-on-Cash Return
3.9%
Cap rate
0.9%
Rent to Value Ratio

Active
$485,000
3
bds
|
1
ba
|
1,467
sqft
|
built
1948
5341 Knox Ave S, Minneapolis, MN 55419
$-1,093
Cash flow
-11.8%
Cash-on-Cash Return
3.6%
Cap rate
0.6%
Rent to Value Ratio
Active
$185,000
3
bds
|
1
ba
|
1,006
sqft
|
built
1910
3019 Colfax Ave N, Minneapolis, MN 55411
$210
Cash flow
5.9%
Cash-on-Cash Return
7.6%
Cap rate
1.1%
Rent to Value Ratio
Active
$1,150,000
3
bds
|
3
ba
|
2,350
sqft
|
built
2006
215 10th Ave S, Minneapolis, MN 55415
$-5,133
Cash flow
-23.3%
Cash-on-Cash Return
0.9%
Cap rate
0.4%
Rent to Value Ratio
Active
$599,900
4
bds
|
3
ba
|
2,526
sqft
|
built
1926
4816 3rd Ave S, Minneapolis, MN 55419
$-2,097
Cash flow
-18.2%
Cash-on-Cash Return
2.1%
Cap rate
0.4%
Rent to Value Ratio
Active
$479,000
3
bds
|
2
ba
|
1,600
sqft
|
built
2014
4013 W 31st St, Minneapolis, MN 55416
$-1,376
Cash flow
-15.0%
Cash-on-Cash Return
2.8%
Cap rate
0.6%
Rent to Value Ratio
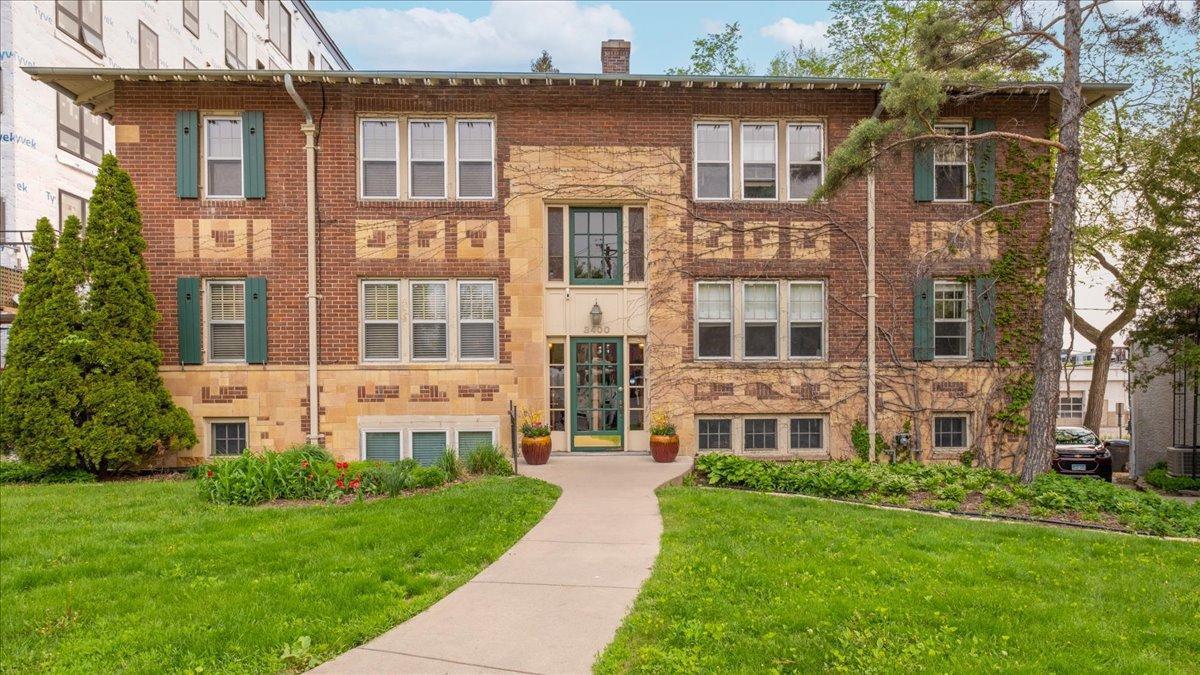
Active
$196,500
2
bds
|
1
ba
|
1,000
sqft
|
built
1926
3400 List Pl, Minneapolis, MN 55416
$-984
Cash flow
-26.1%
Cash-on-Cash Return
0.3%
Cap rate
0.8%
Rent to Value Ratio
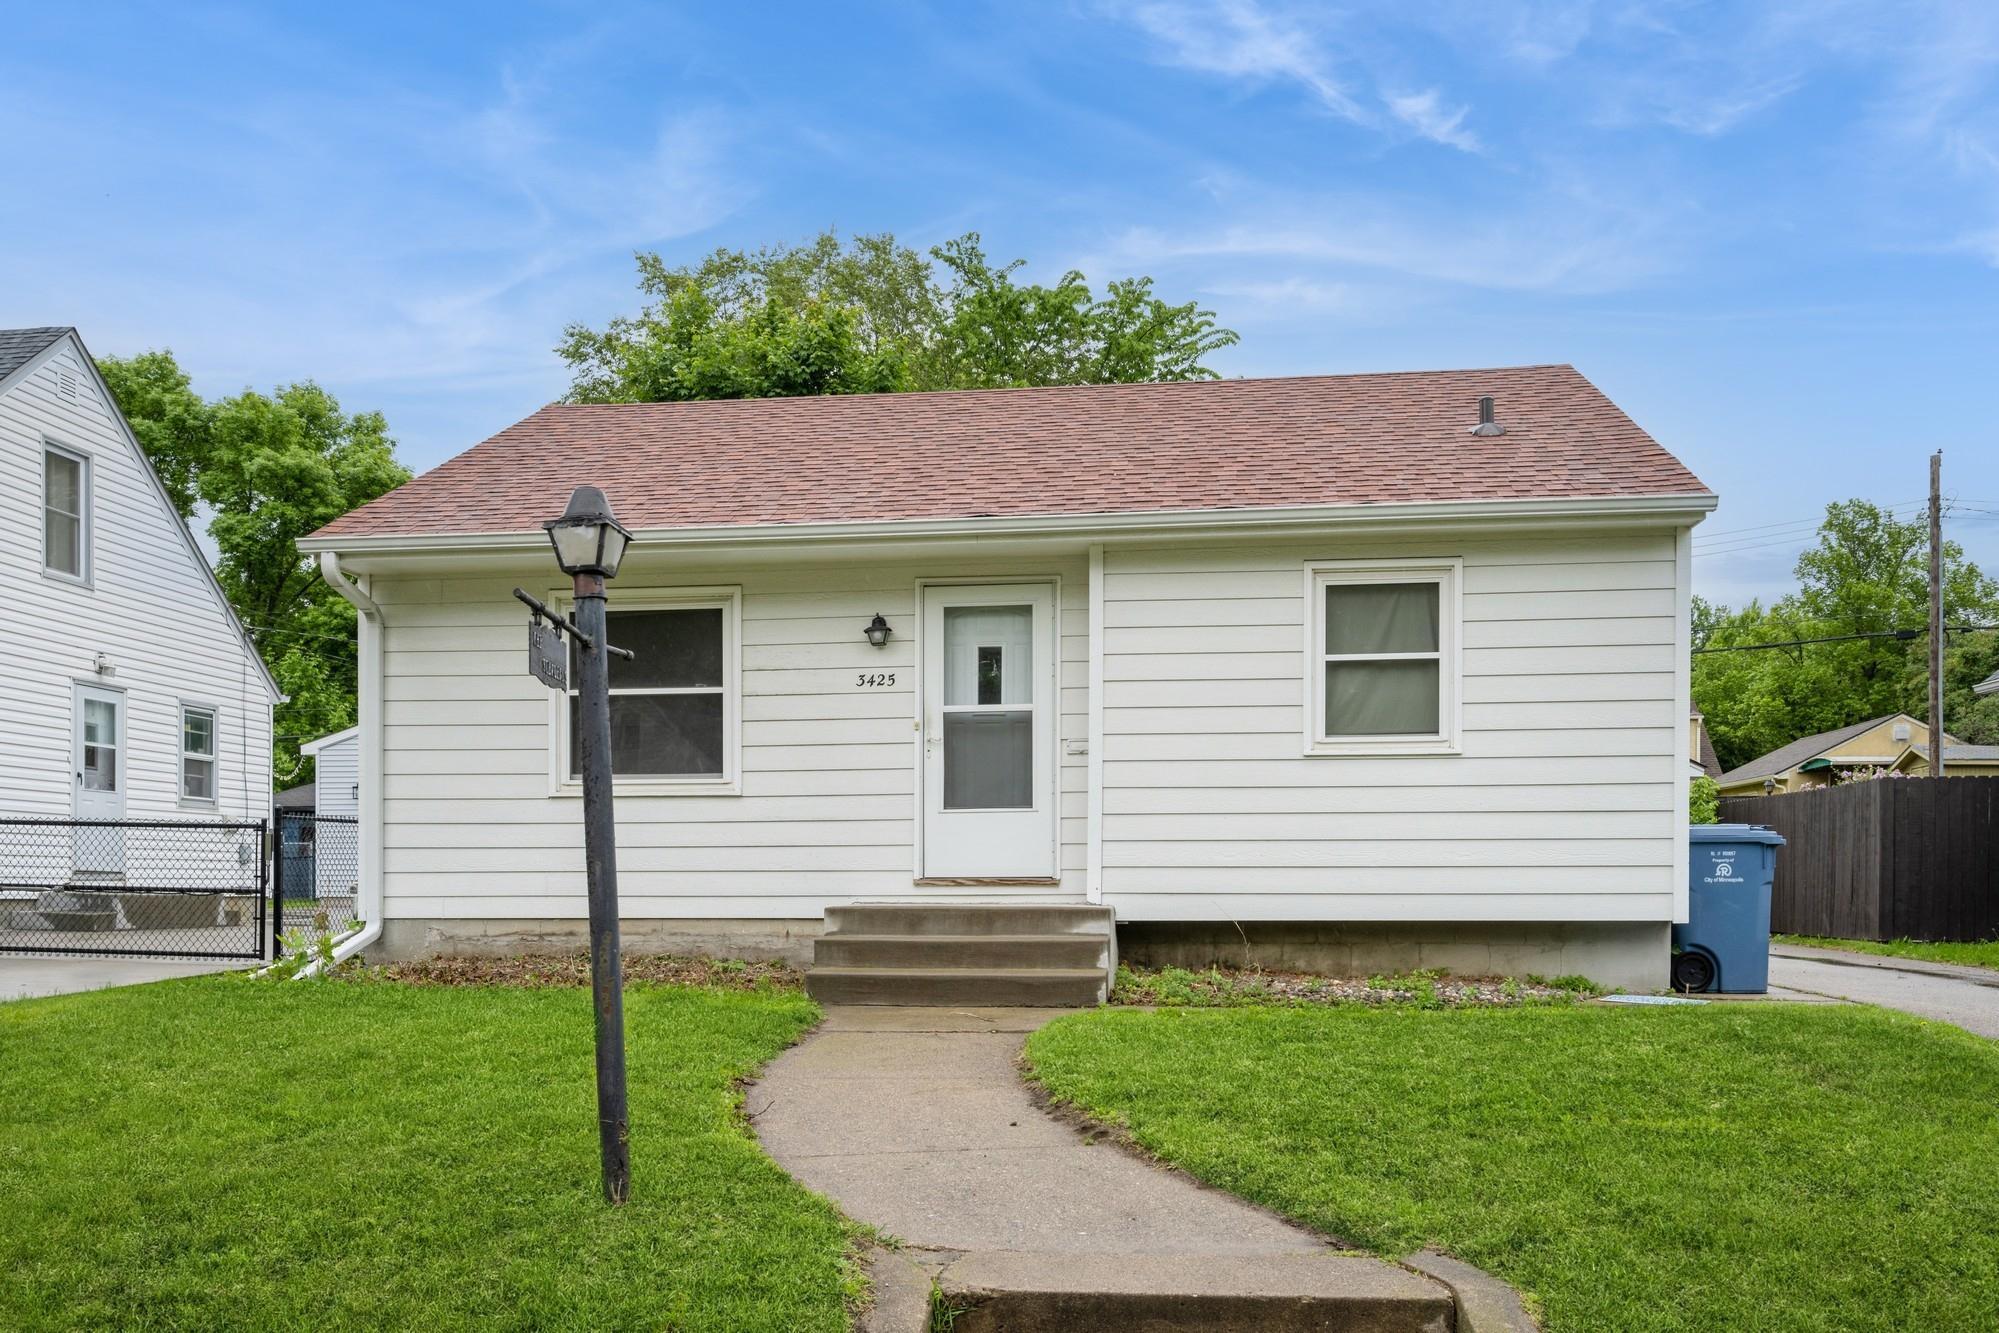
Active
$181,020
2
bds
|
1
ba
|
840
sqft
|
built
1953
3425 Cleveland St NE, Minneapolis, MN 55418
$-172
Cash flow
-5.0%
Cash-on-Cash Return
5.1%
Cap rate
0.9%
Rent to Value Ratio