Minneapolis, MN Investment Properties for Sale
Browse homes for sale and investment properties in Minneapolis, MN. Refine your search by price, property type, or more.
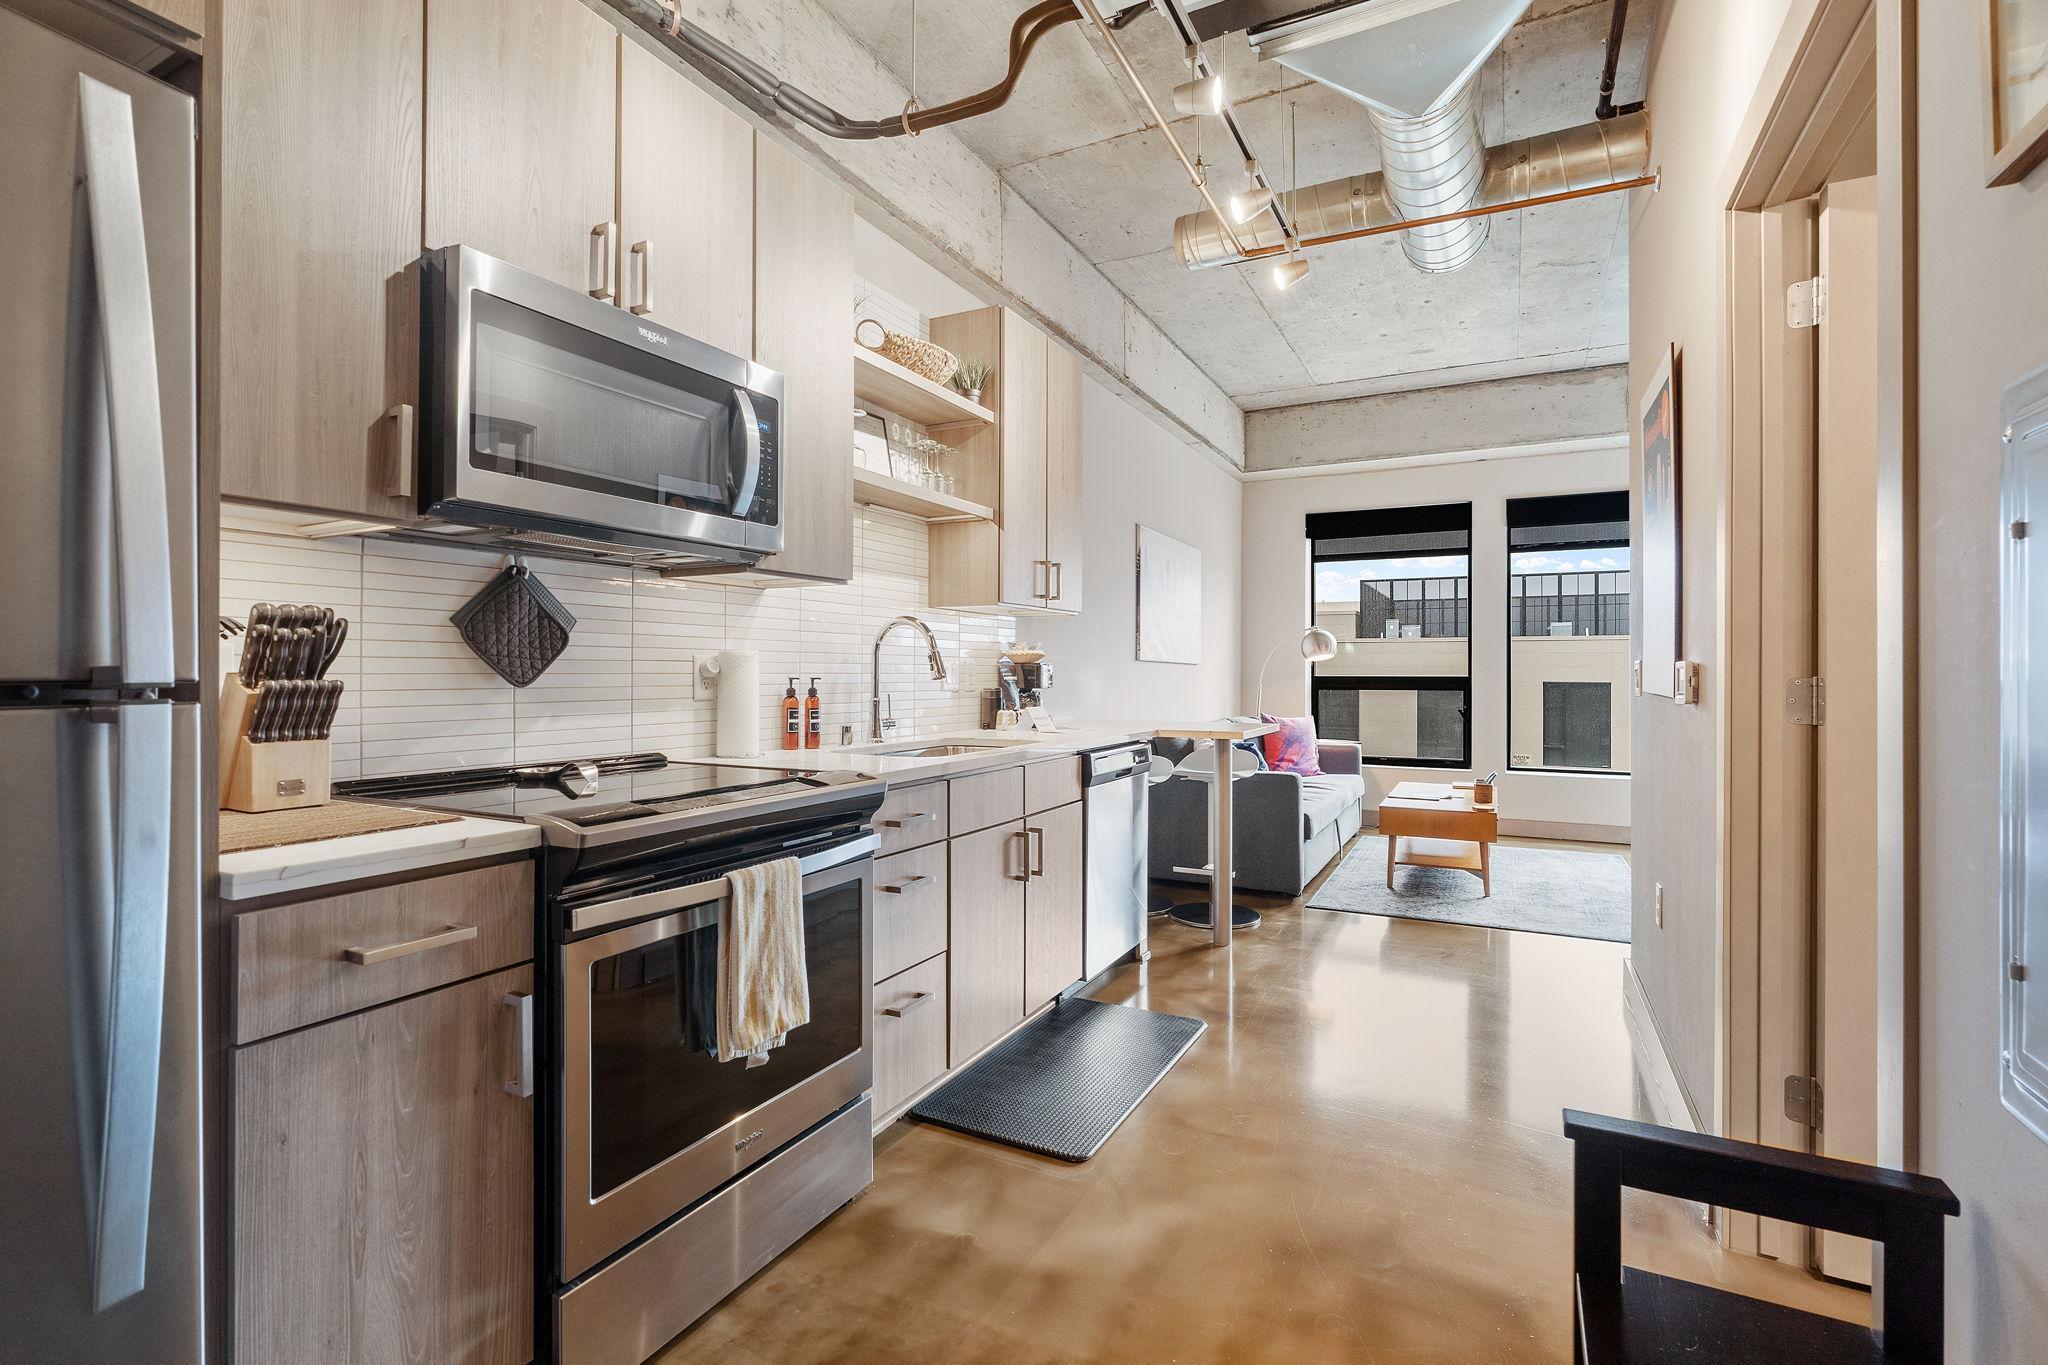
Best cash flowing properties in Minneapolis, MN
Active
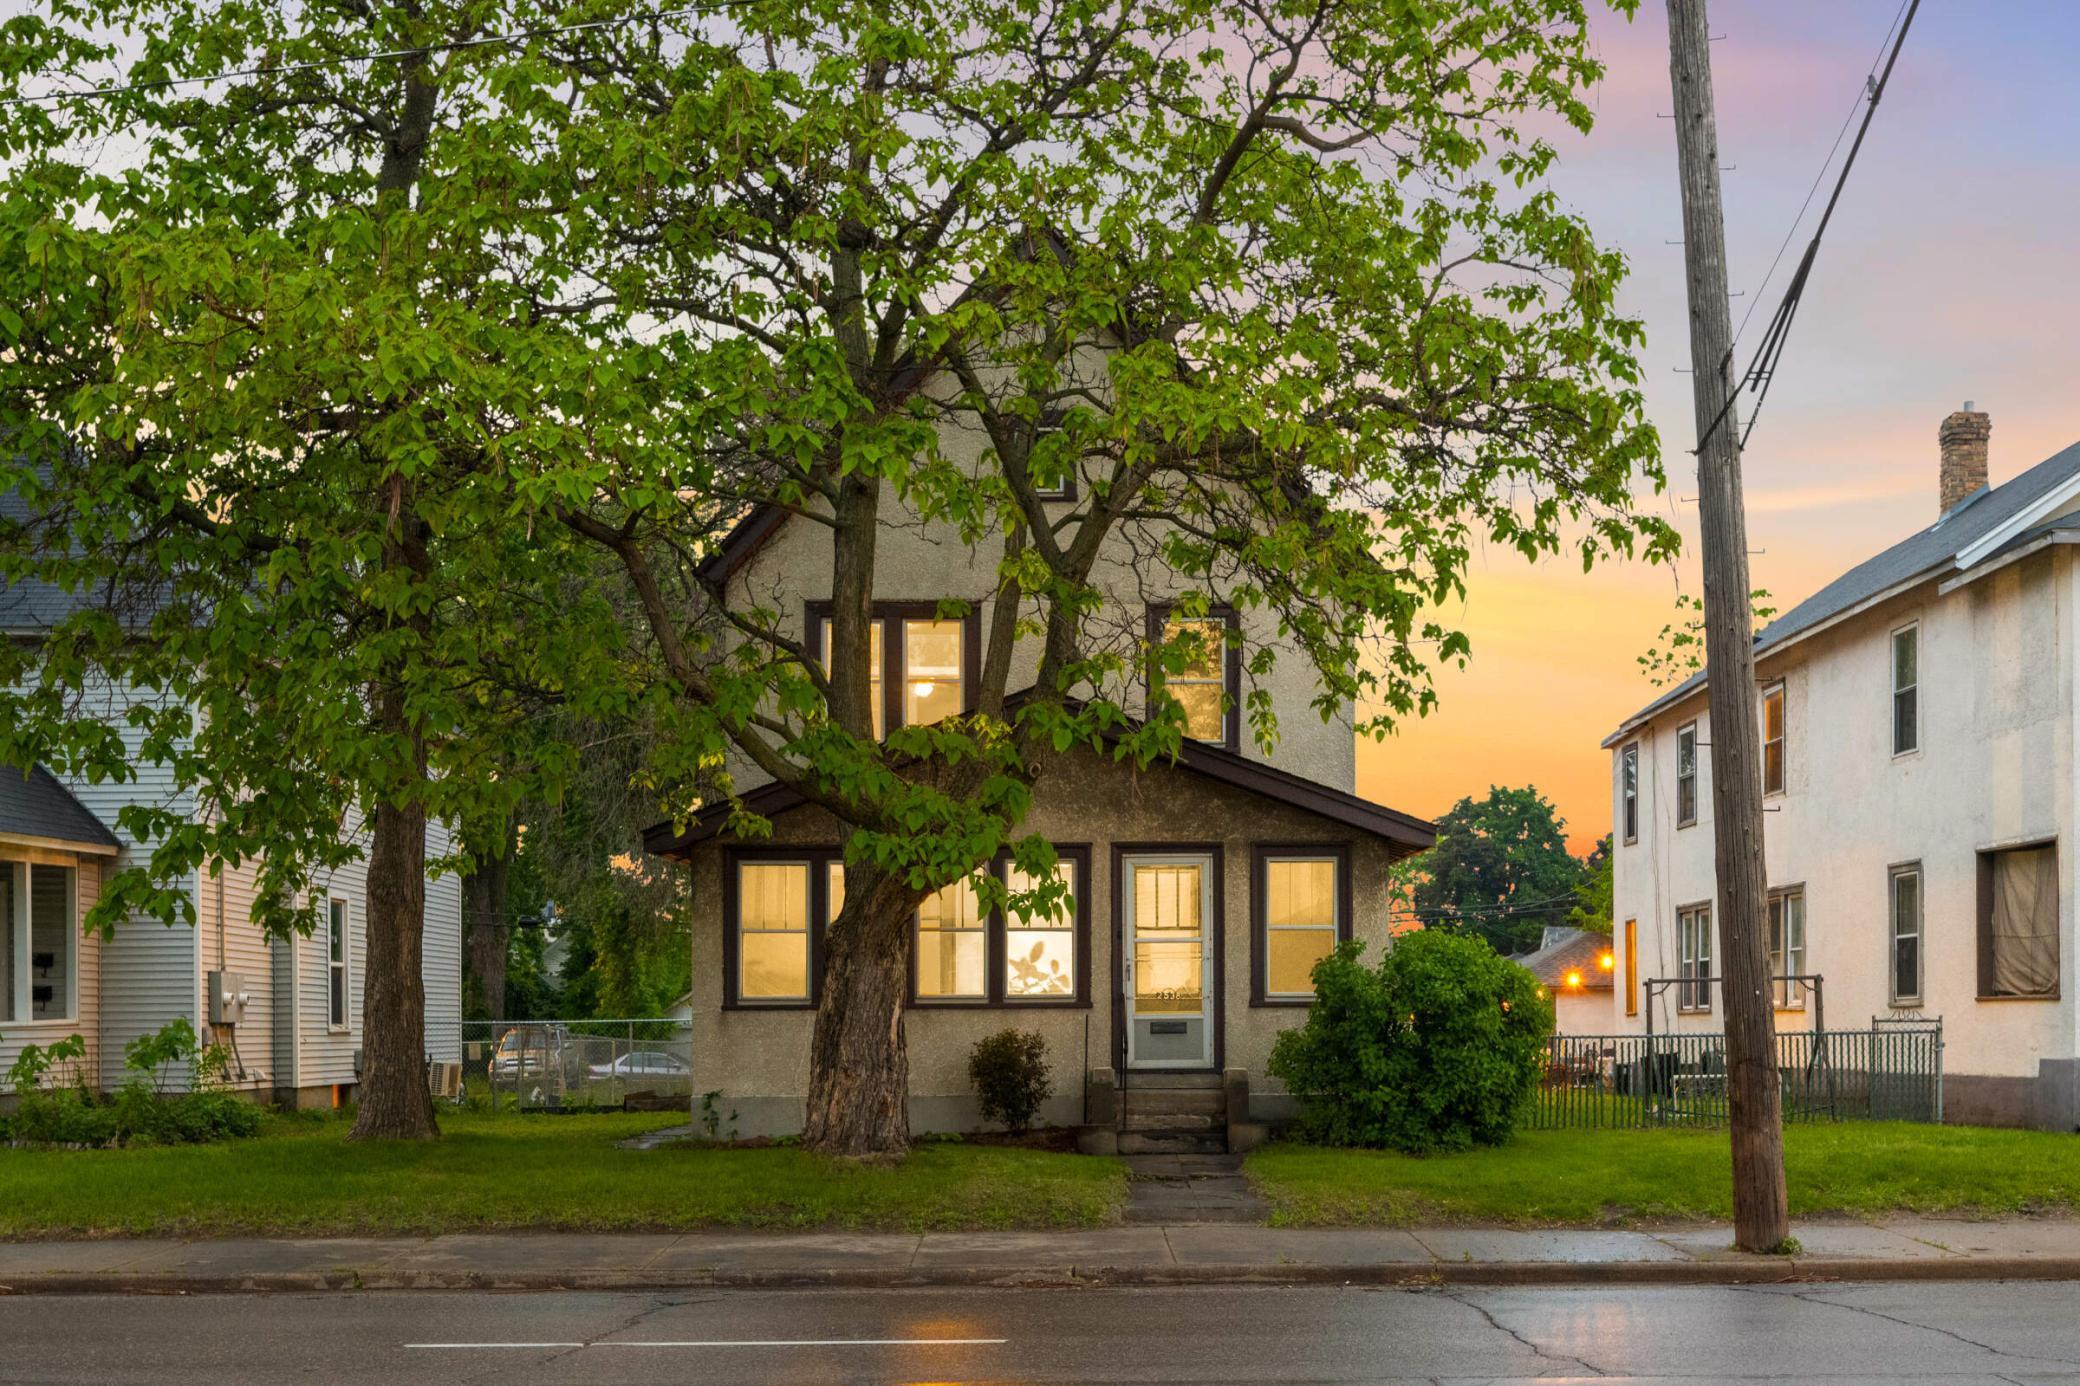
$350,000
3
bds
|
2
ba
|
1,914
sqft
|
built
1900
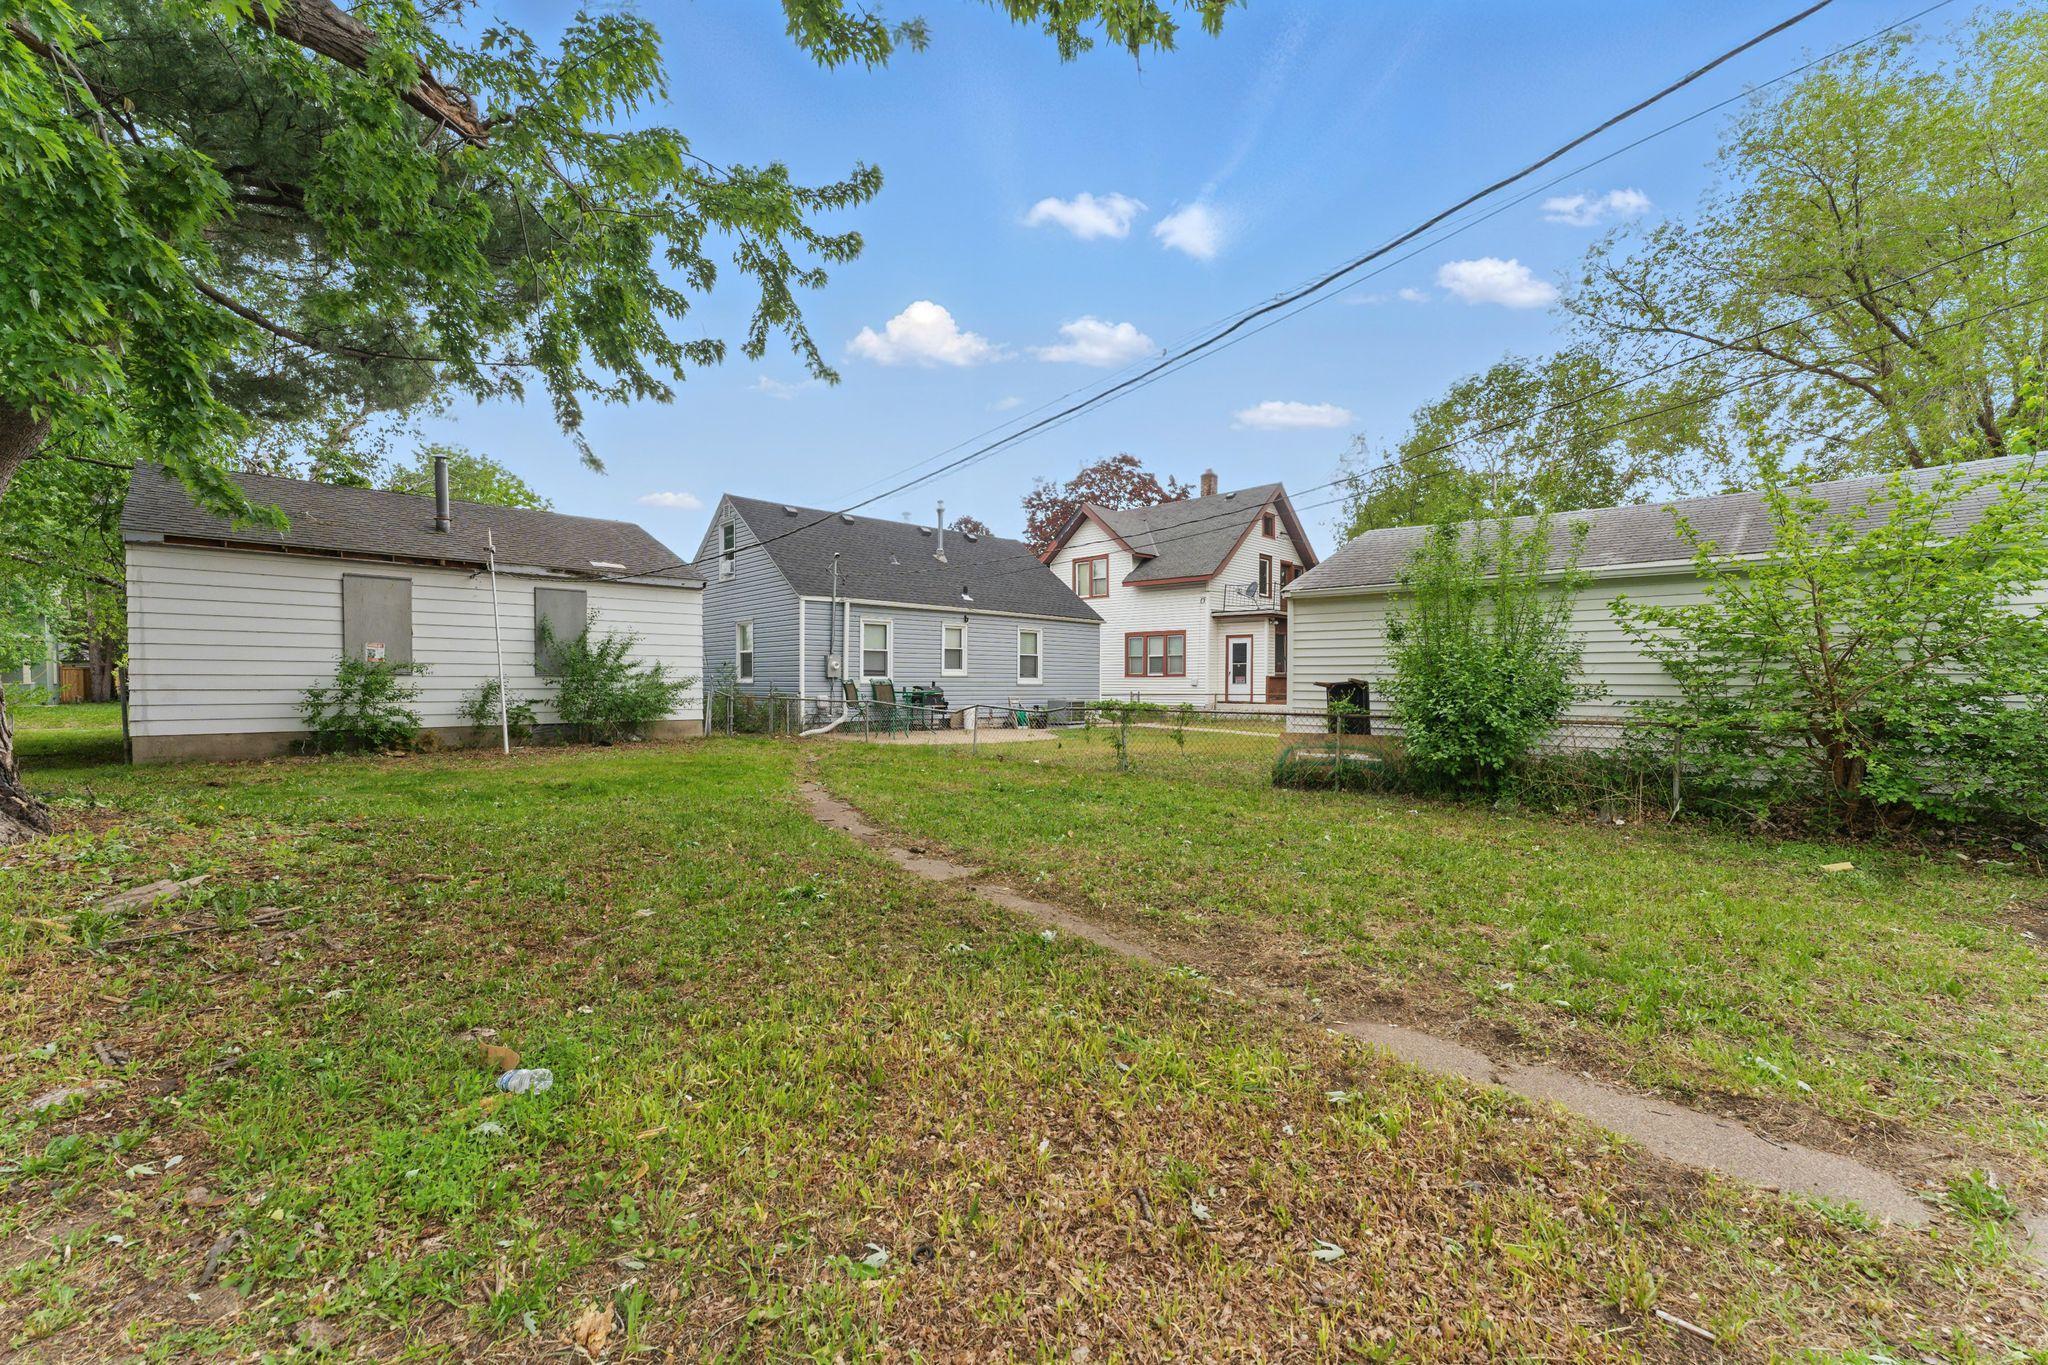
2538 University Ave NE, Minneapolis, MN 55418
$92
Cash flow
1.4%
Cash-on-Cash Return
6.6%
Cap rate
0.9%
Rent to Value Ratio
Active
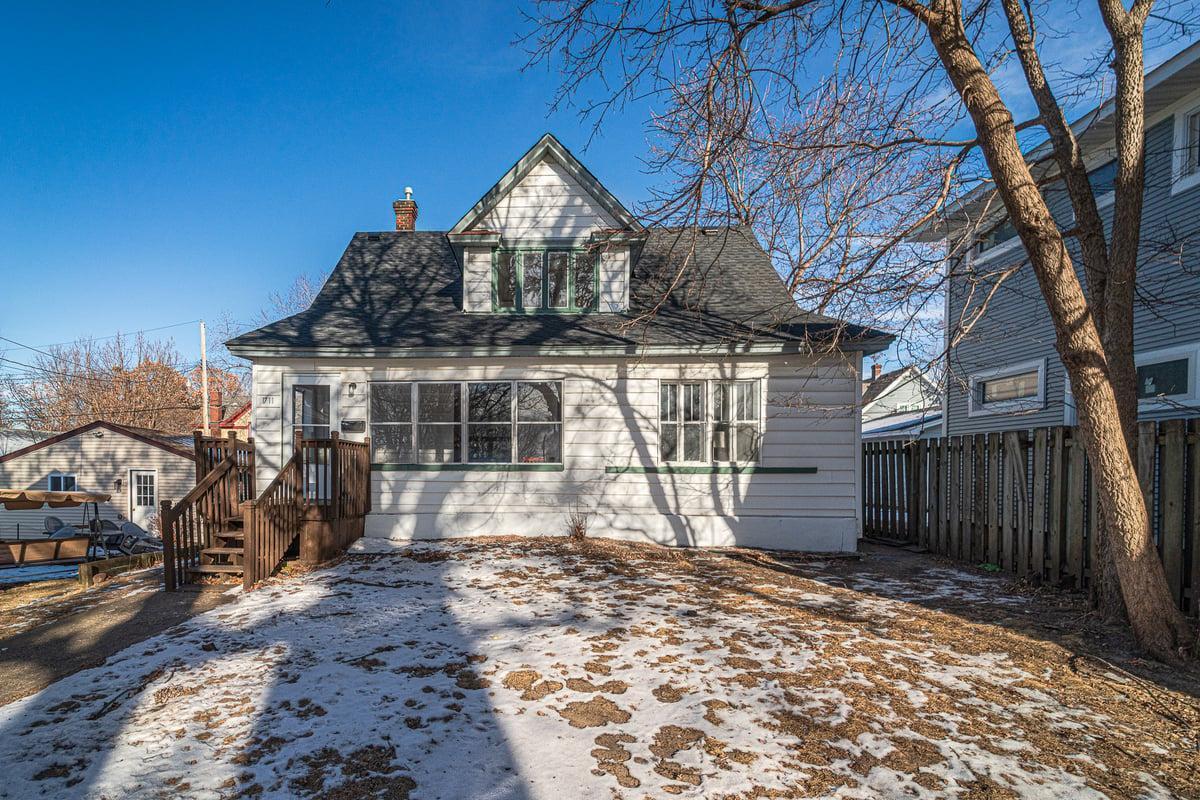
$299,900
4
bds
|
2
ba
|
1,490
sqft
|
built
1910
1711 22nd Ave NE, Minneapolis, MN 55418
$-9
Cash flow
-0.2%
Cash-on-Cash Return
6.2%
Cap rate
0.9%
Rent to Value Ratio
1,031 out of 1,244 properties for sale in Minneapolis, MN
Limited Results Shown
Create a free account, or log in to reveal all property listings and enjoy the complete experience.
Active
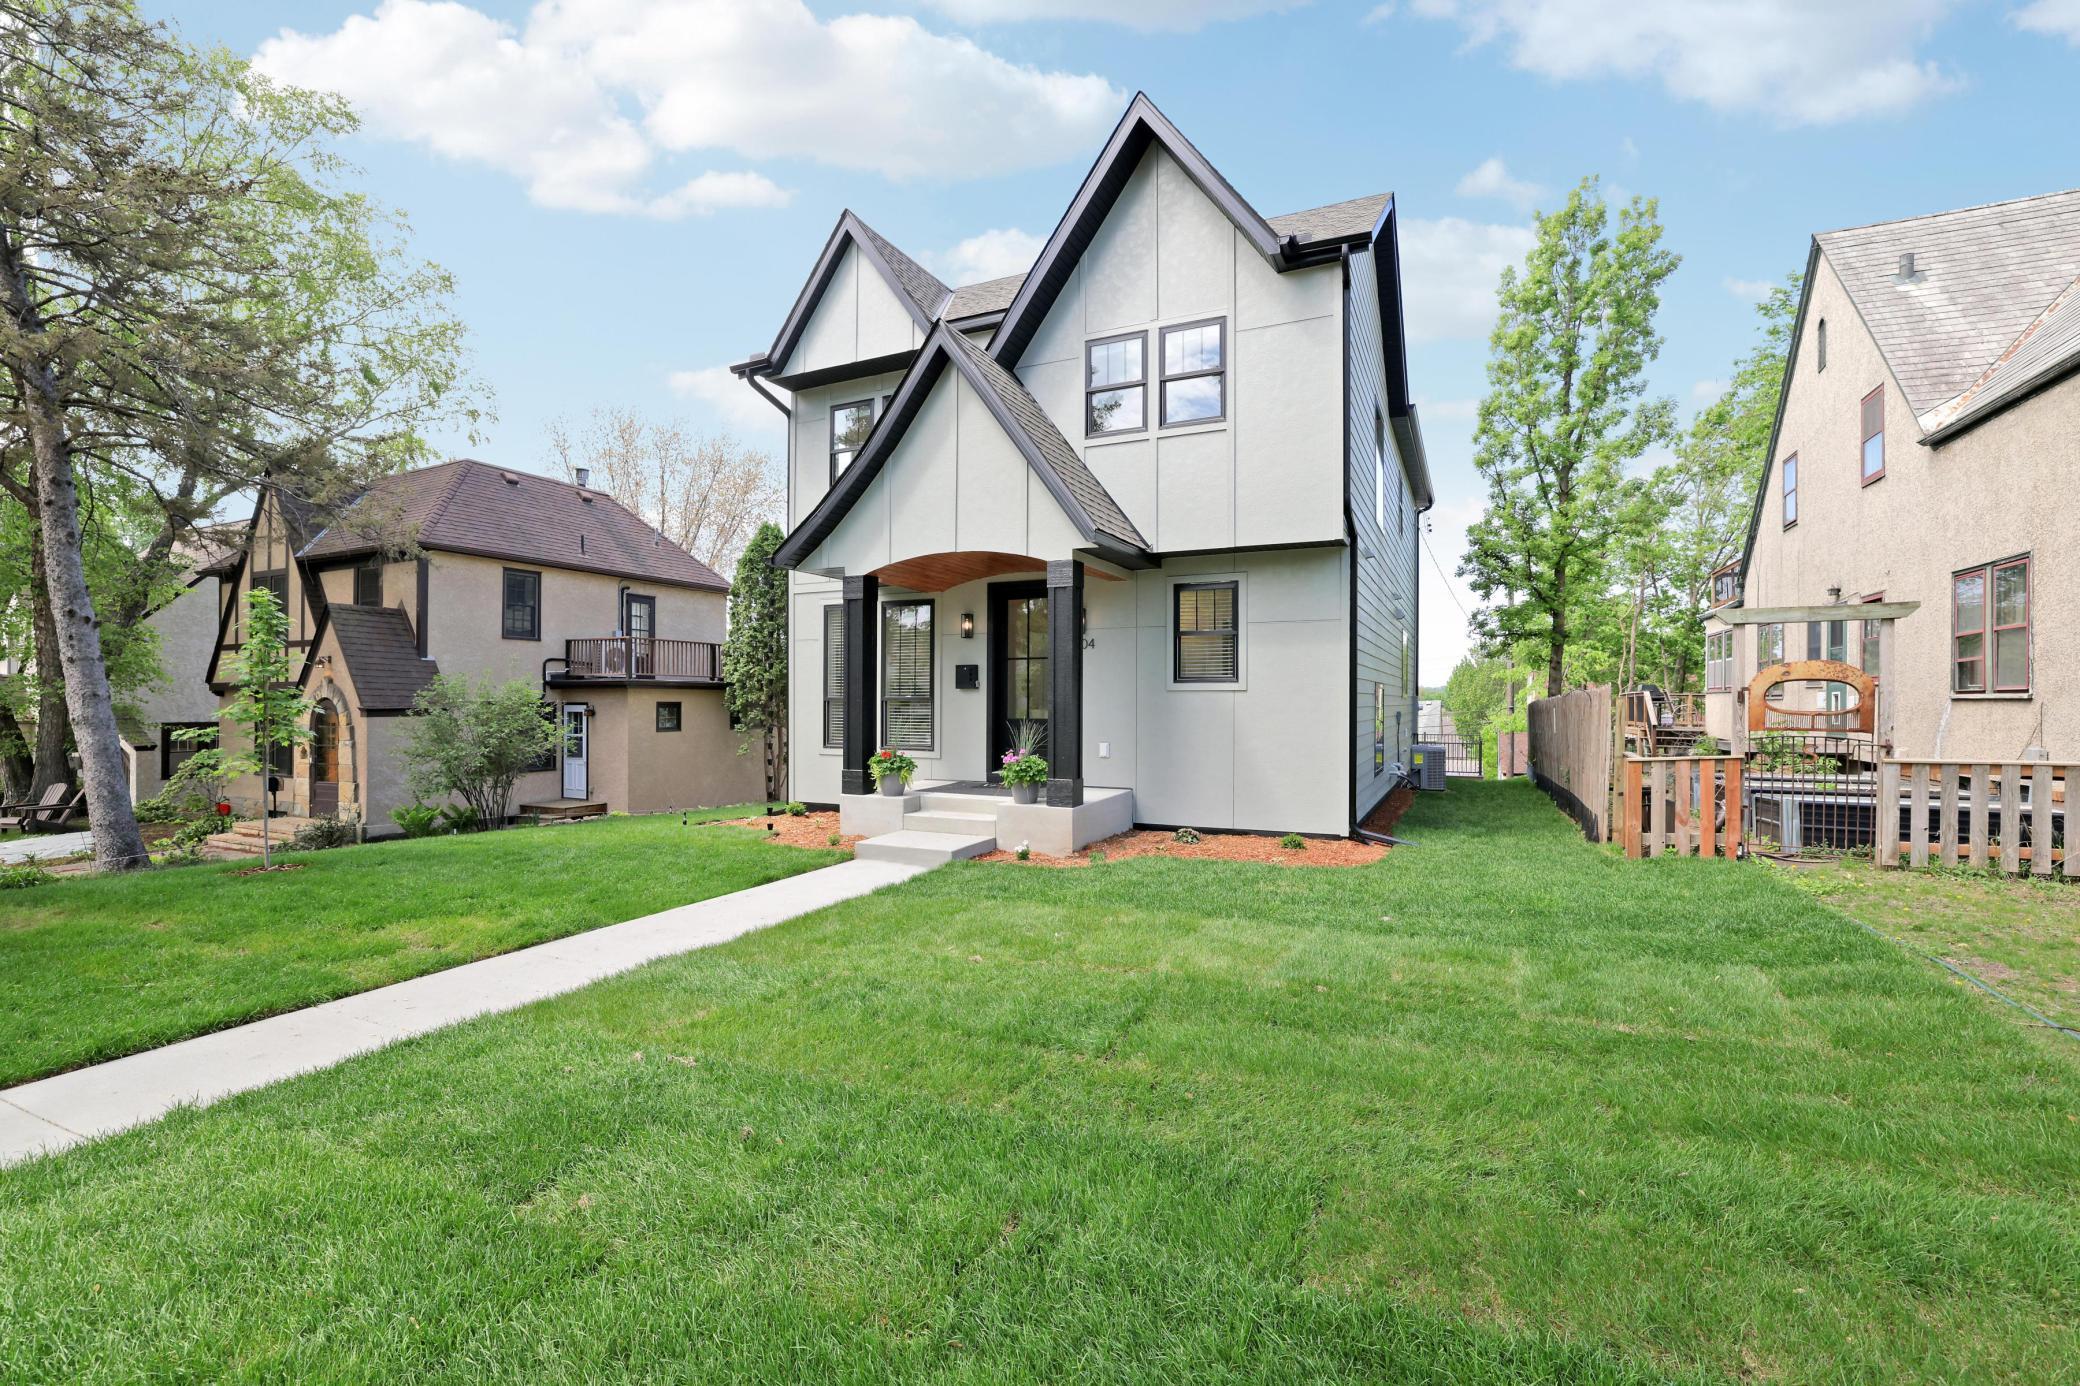
$997,850
4
bds
|
4
ba
|
3,295
sqft
|
built
2025
4804 12th Ave S, Minneapolis, MN 55417
$-1,705
Cash flow
-8.9%
Cash-on-Cash Return
4.2%
Cap rate
0.6%
Rent to Value Ratio
Pending
$485,000
4
bds
|
3
ba
|
2,908
sqft
|
built
1984
12085 Evergreen St NW, Minneapolis, MN 55448
$-969
Cash flow
-10.4%
Cash-on-Cash Return
3.9%
Cap rate
0.6%
Rent to Value Ratio
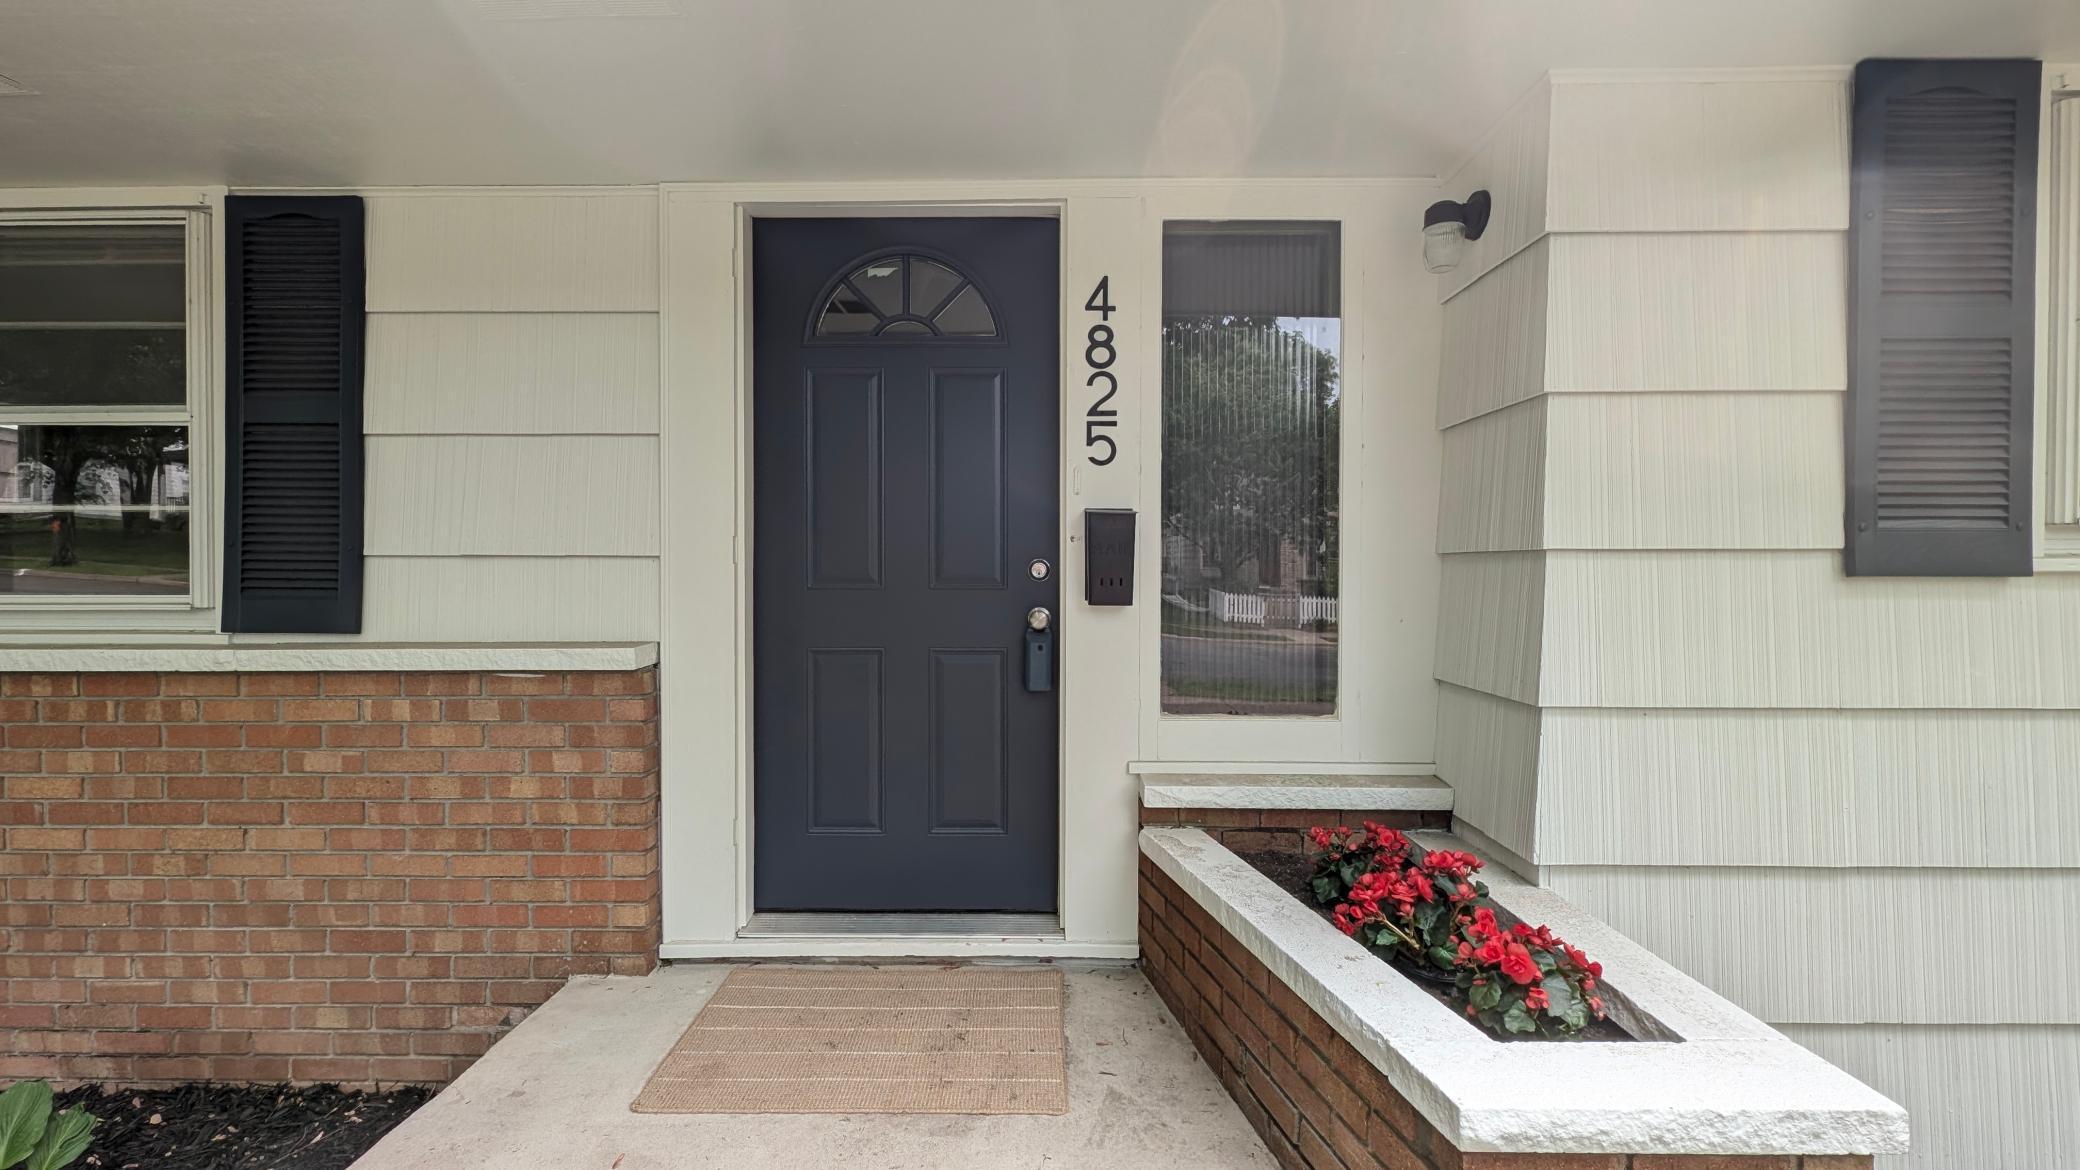
Active
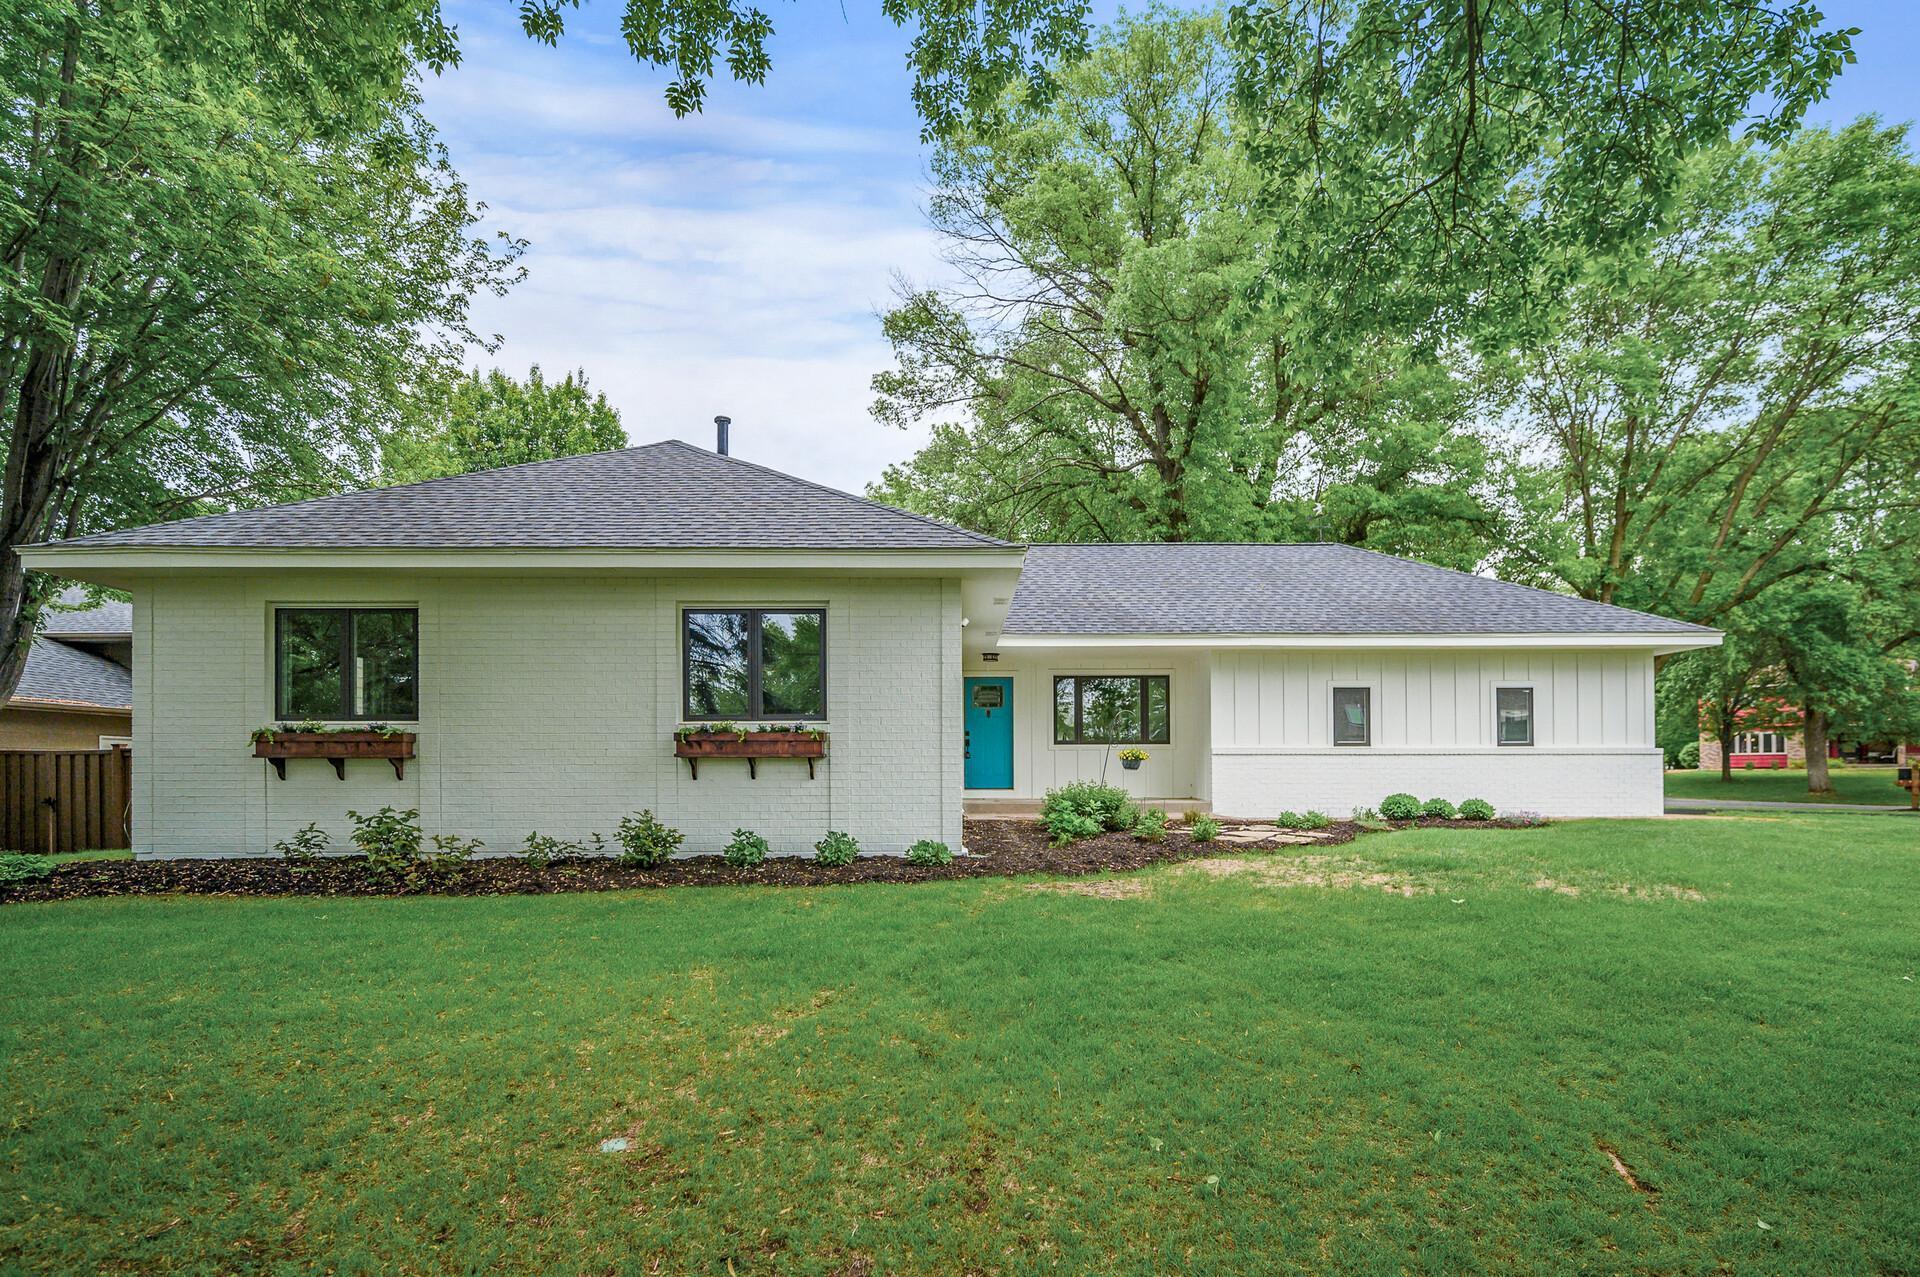
$535,000
3
bds
|
2
ba
|
1,675
sqft
|
built
1956
4825 Drew Ave S, Minneapolis, MN 55410
$-1,144
Cash flow
-11.2%
Cash-on-Cash Return
3.7%
Cap rate
0.6%
Rent to Value Ratio
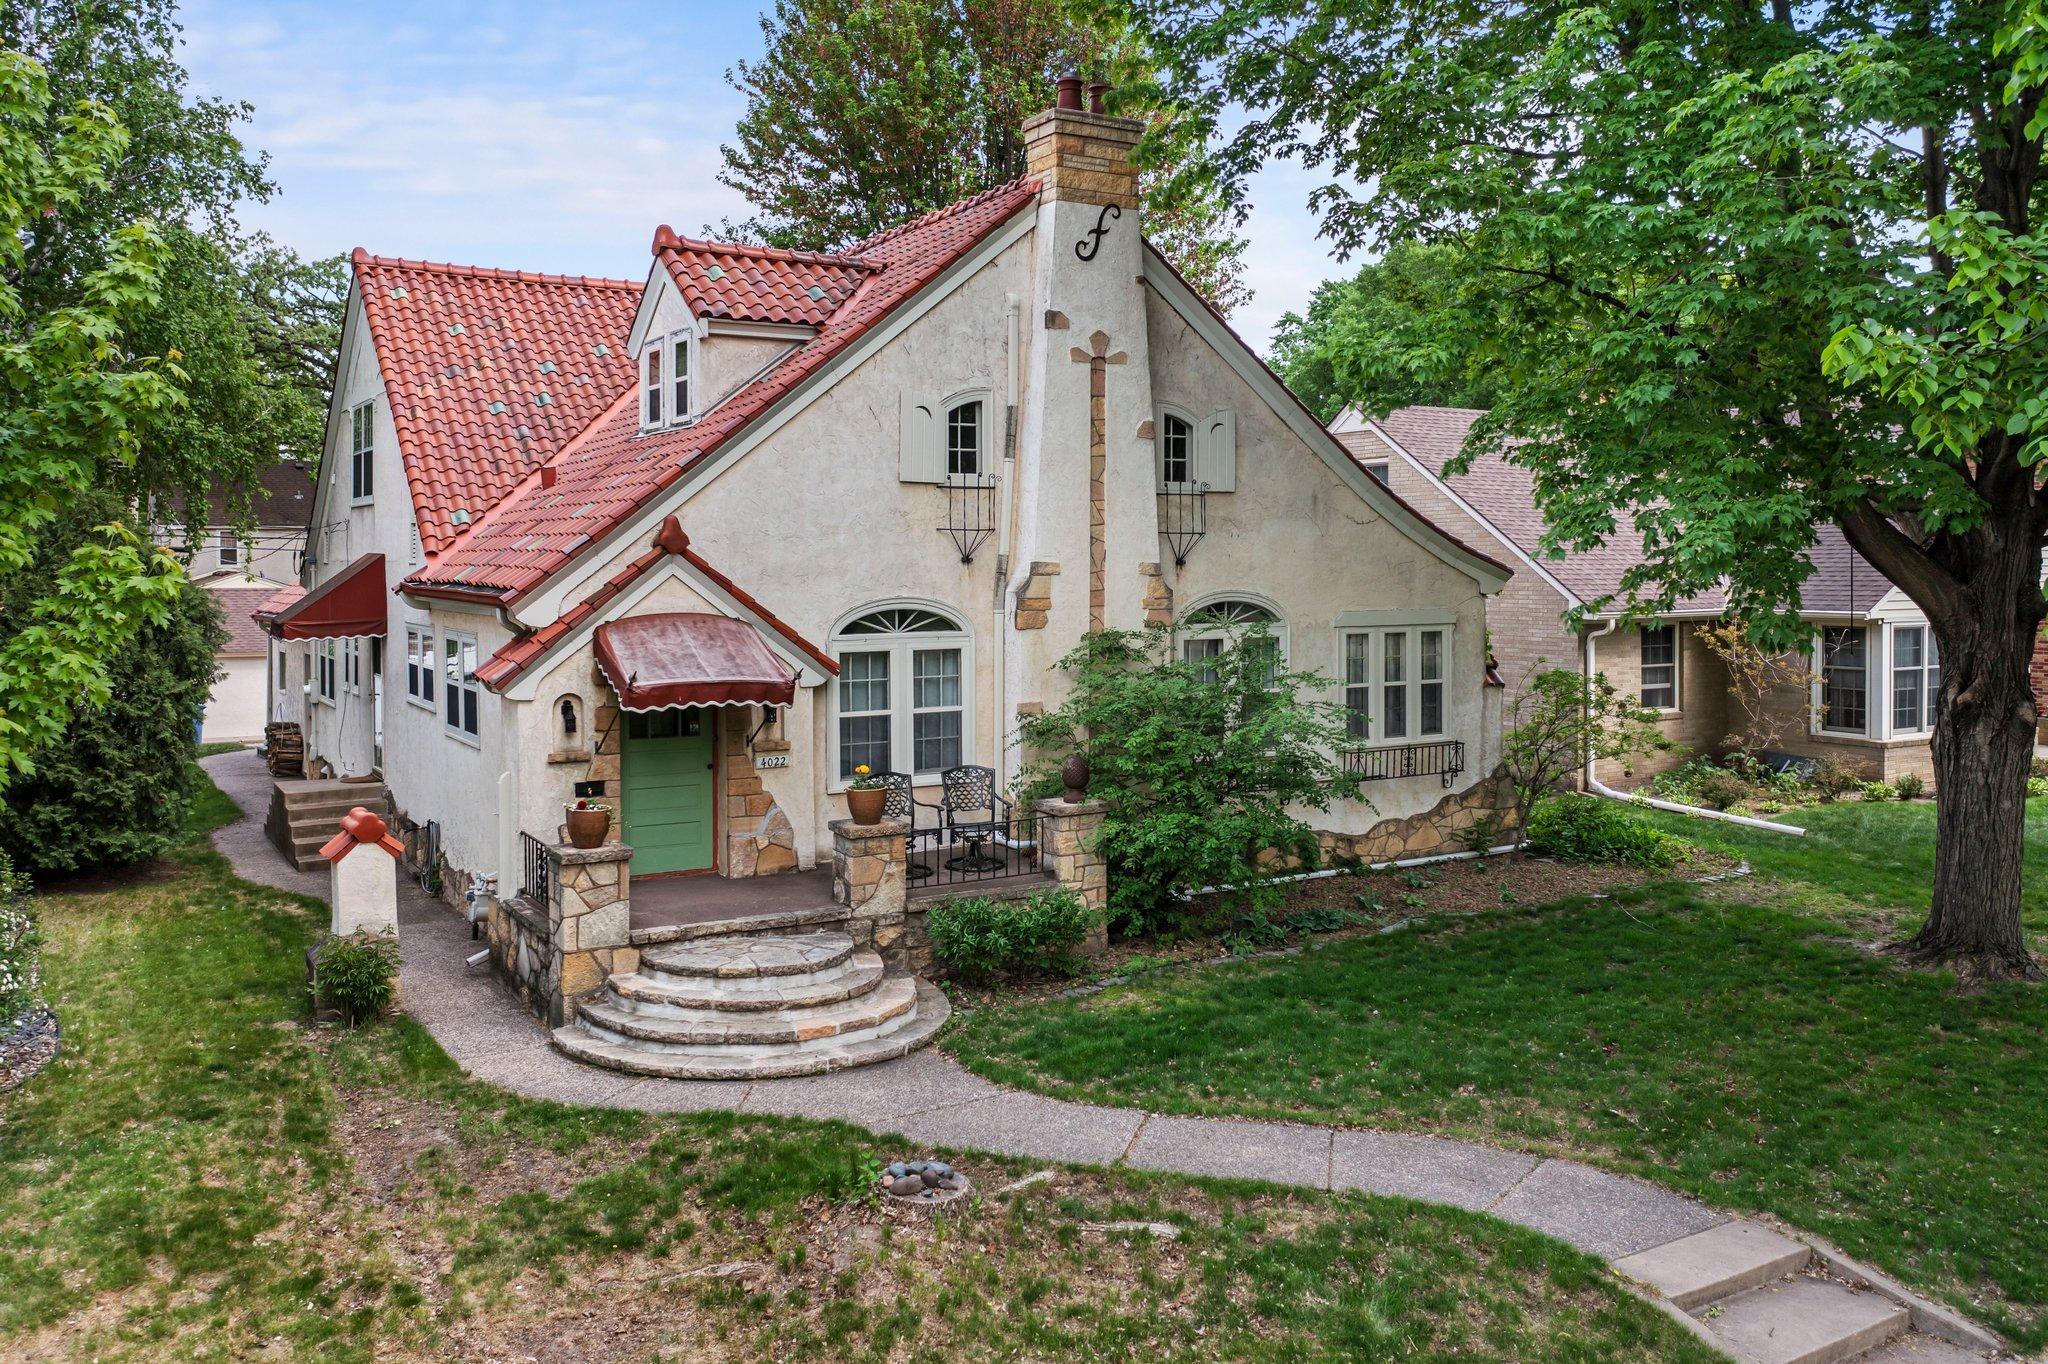
Pending
$545,000
4
bds
|
3
ba
|
3,328
sqft
|
built
1929
4022 Xerxes Ave N, Minneapolis, MN 55412
$-1,230
Cash flow
-11.8%
Cash-on-Cash Return
3.6%
Cap rate
0.6%
Rent to Value Ratio
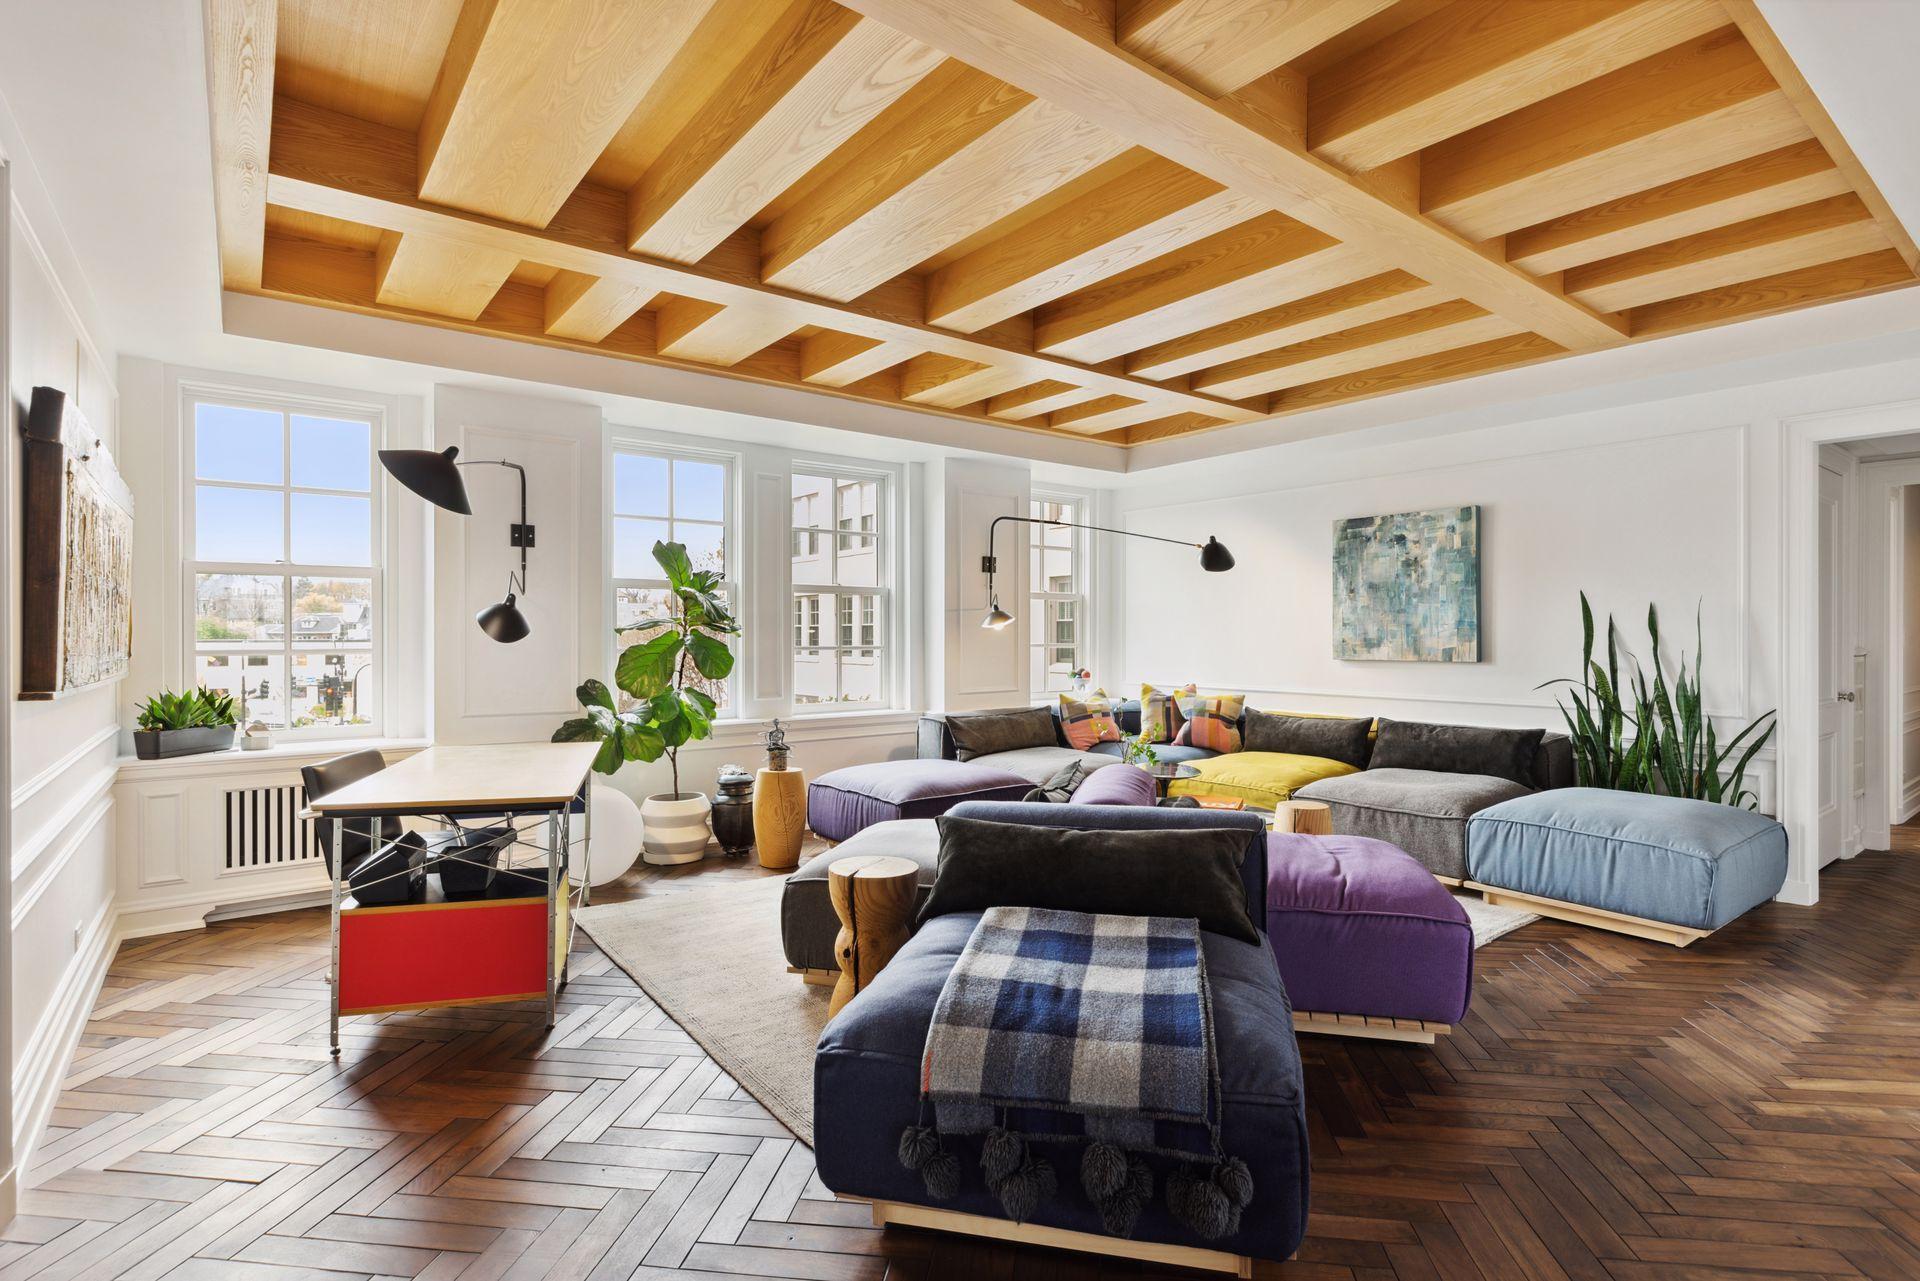
Active
$1,495,000
2
bds
|
3
ba
|
2,533
sqft
|
built
1927
510 Groveland Ave, Minneapolis, MN 55403
$-10,607
Cash flow
-37.0%
Cash-on-Cash Return
-2.2%
Cap rate
0.3%
Rent to Value Ratio
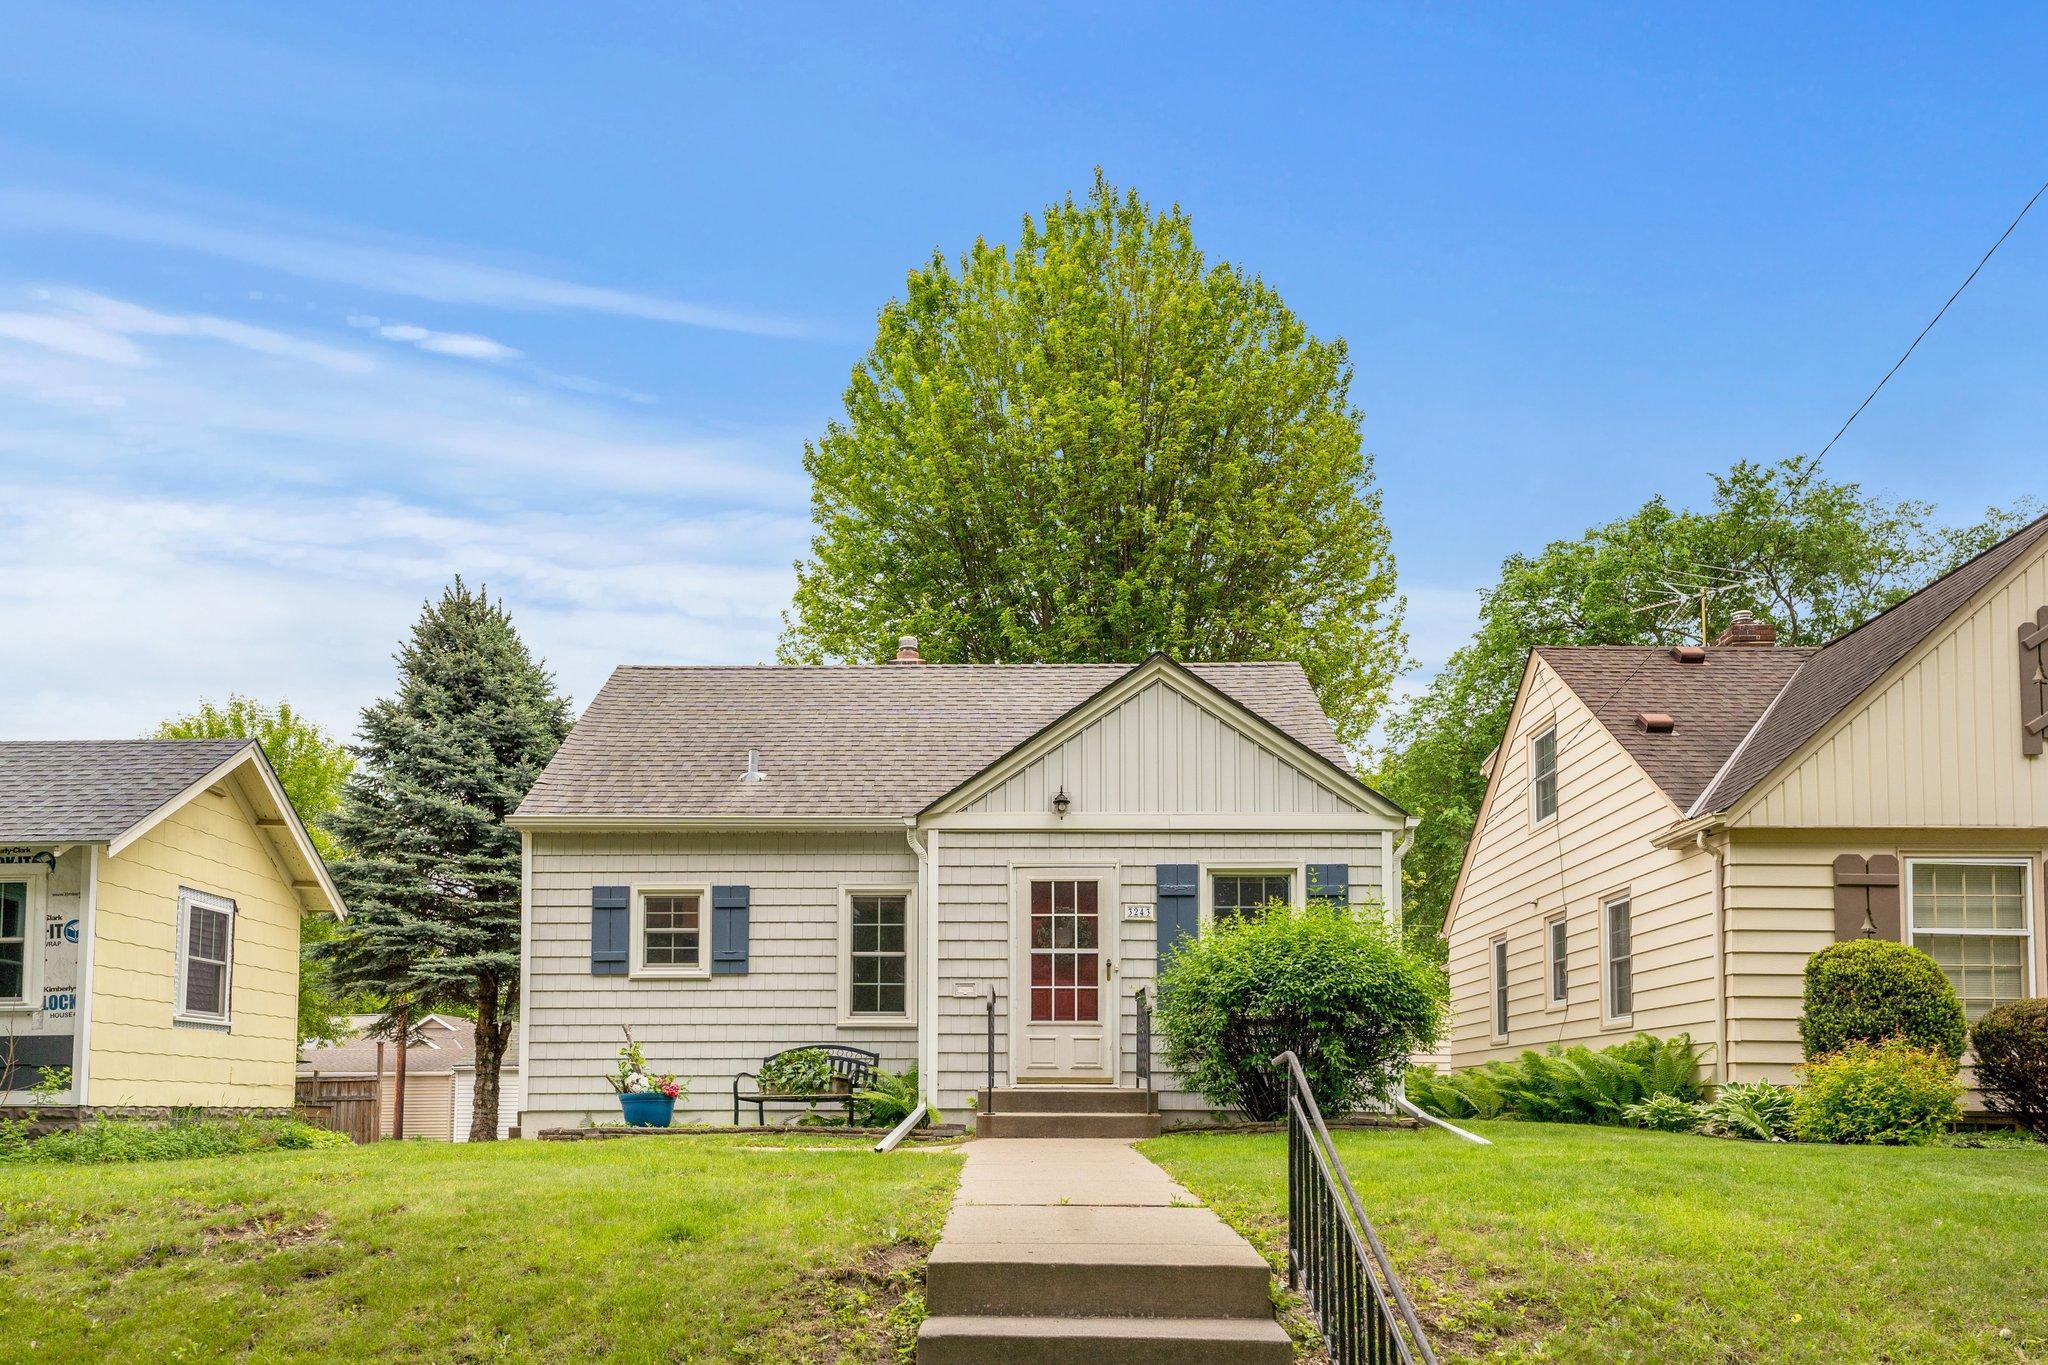
Active
$315,000
2
bds
|
1
ba
|
1,060
sqft
|
built
1941
3243 Cleveland St NE, Minneapolis, MN 55418
$-736
Cash flow
-12.2%
Cash-on-Cash Return
3.5%
Cap rate
0.6%
Rent to Value Ratio
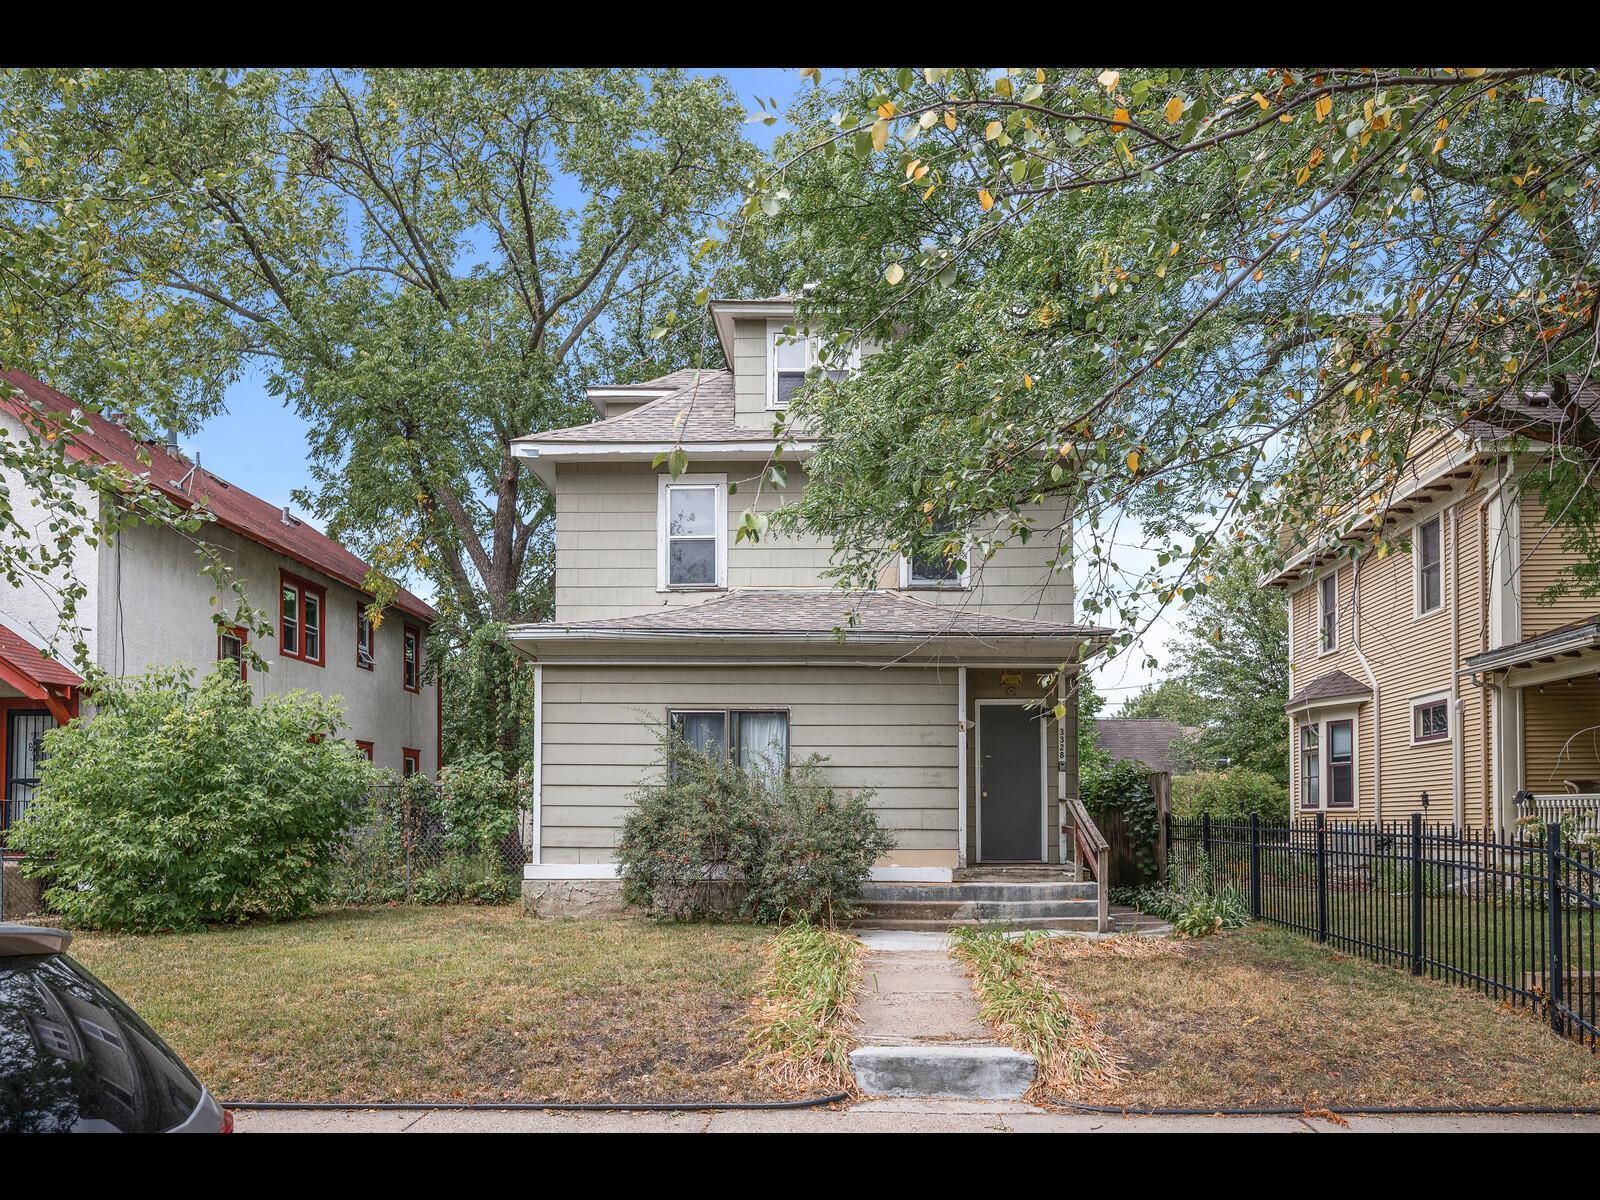
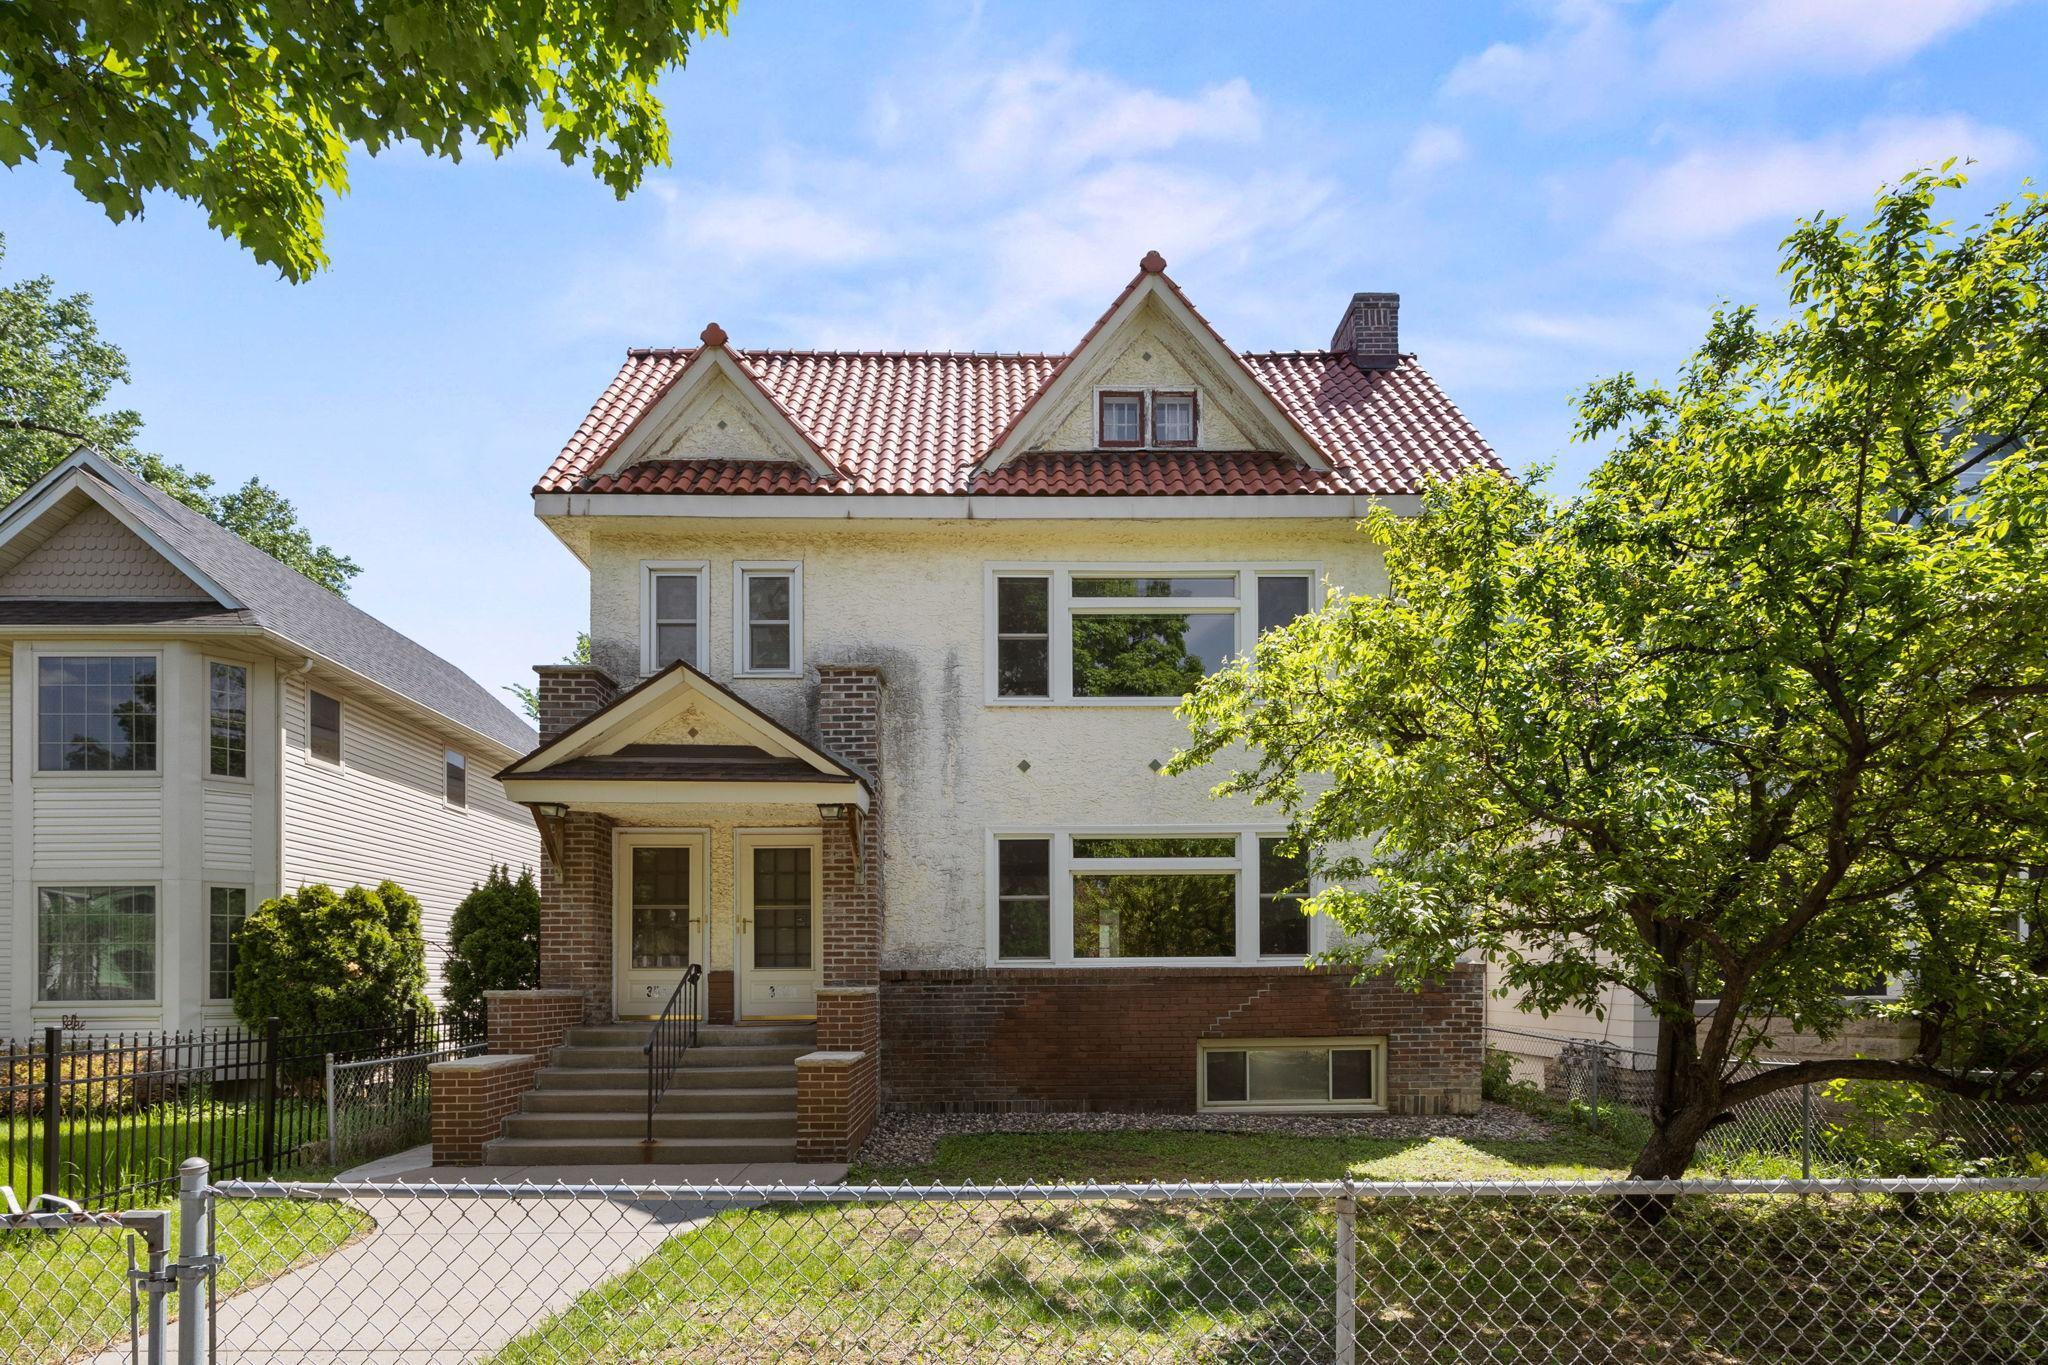
Active
$275,000
5
bds
|
3
ba
|
1,988
sqft
|
built
1906
3328 5th Ave S, Minneapolis, MN 55408
$-418
Cash flow
-7.9%
Cash-on-Cash Return
4.5%
Cap rate
0.7%
Rent to Value Ratio
Pending
$299,800
3
bds
|
1
ba
|
1,696
sqft
|
built
1952
541 105th Ln NW, Minneapolis, MN 55448
$-284
Cash flow
-4.9%
Cash-on-Cash Return
5.1%
Cap rate
0.7%
Rent to Value Ratio
Active
$350,000
3
bds
|
2
ba
|
1,914
sqft
|
built
1900
2538 University Ave NE, Minneapolis, MN 55418
$92
Cash flow
1.4%
Cash-on-Cash Return
6.6%
Cap rate
0.9%
Rent to Value Ratio
Active
$469,900
2
bds
|
3
ba
|
1,965
sqft
|
built
2007
929 Portland Ave, Minneapolis, MN 55404
$-1,613
Cash flow
-17.9%
Cash-on-Cash Return
2.2%
Cap rate
0.9%
Rent to Value Ratio
Active
$237,400
3
bds
|
2
ba
|
1,277
sqft
|
built
1982
1814 Skyline Curv, Minneapolis, MN 55411
$-188
Cash flow
-4.1%
Cash-on-Cash Return
5.3%
Cap rate
1.1%
Rent to Value Ratio
Active
$569,900
7
bds
|
3
ba
|
3,840
sqft
|
built
1963
1733 37th Ave NE, Minneapolis, MN 55421
$-1,166
Cash flow
-10.7%
Cash-on-Cash Return
3.8%
Cap rate
0.6%
Rent to Value Ratio
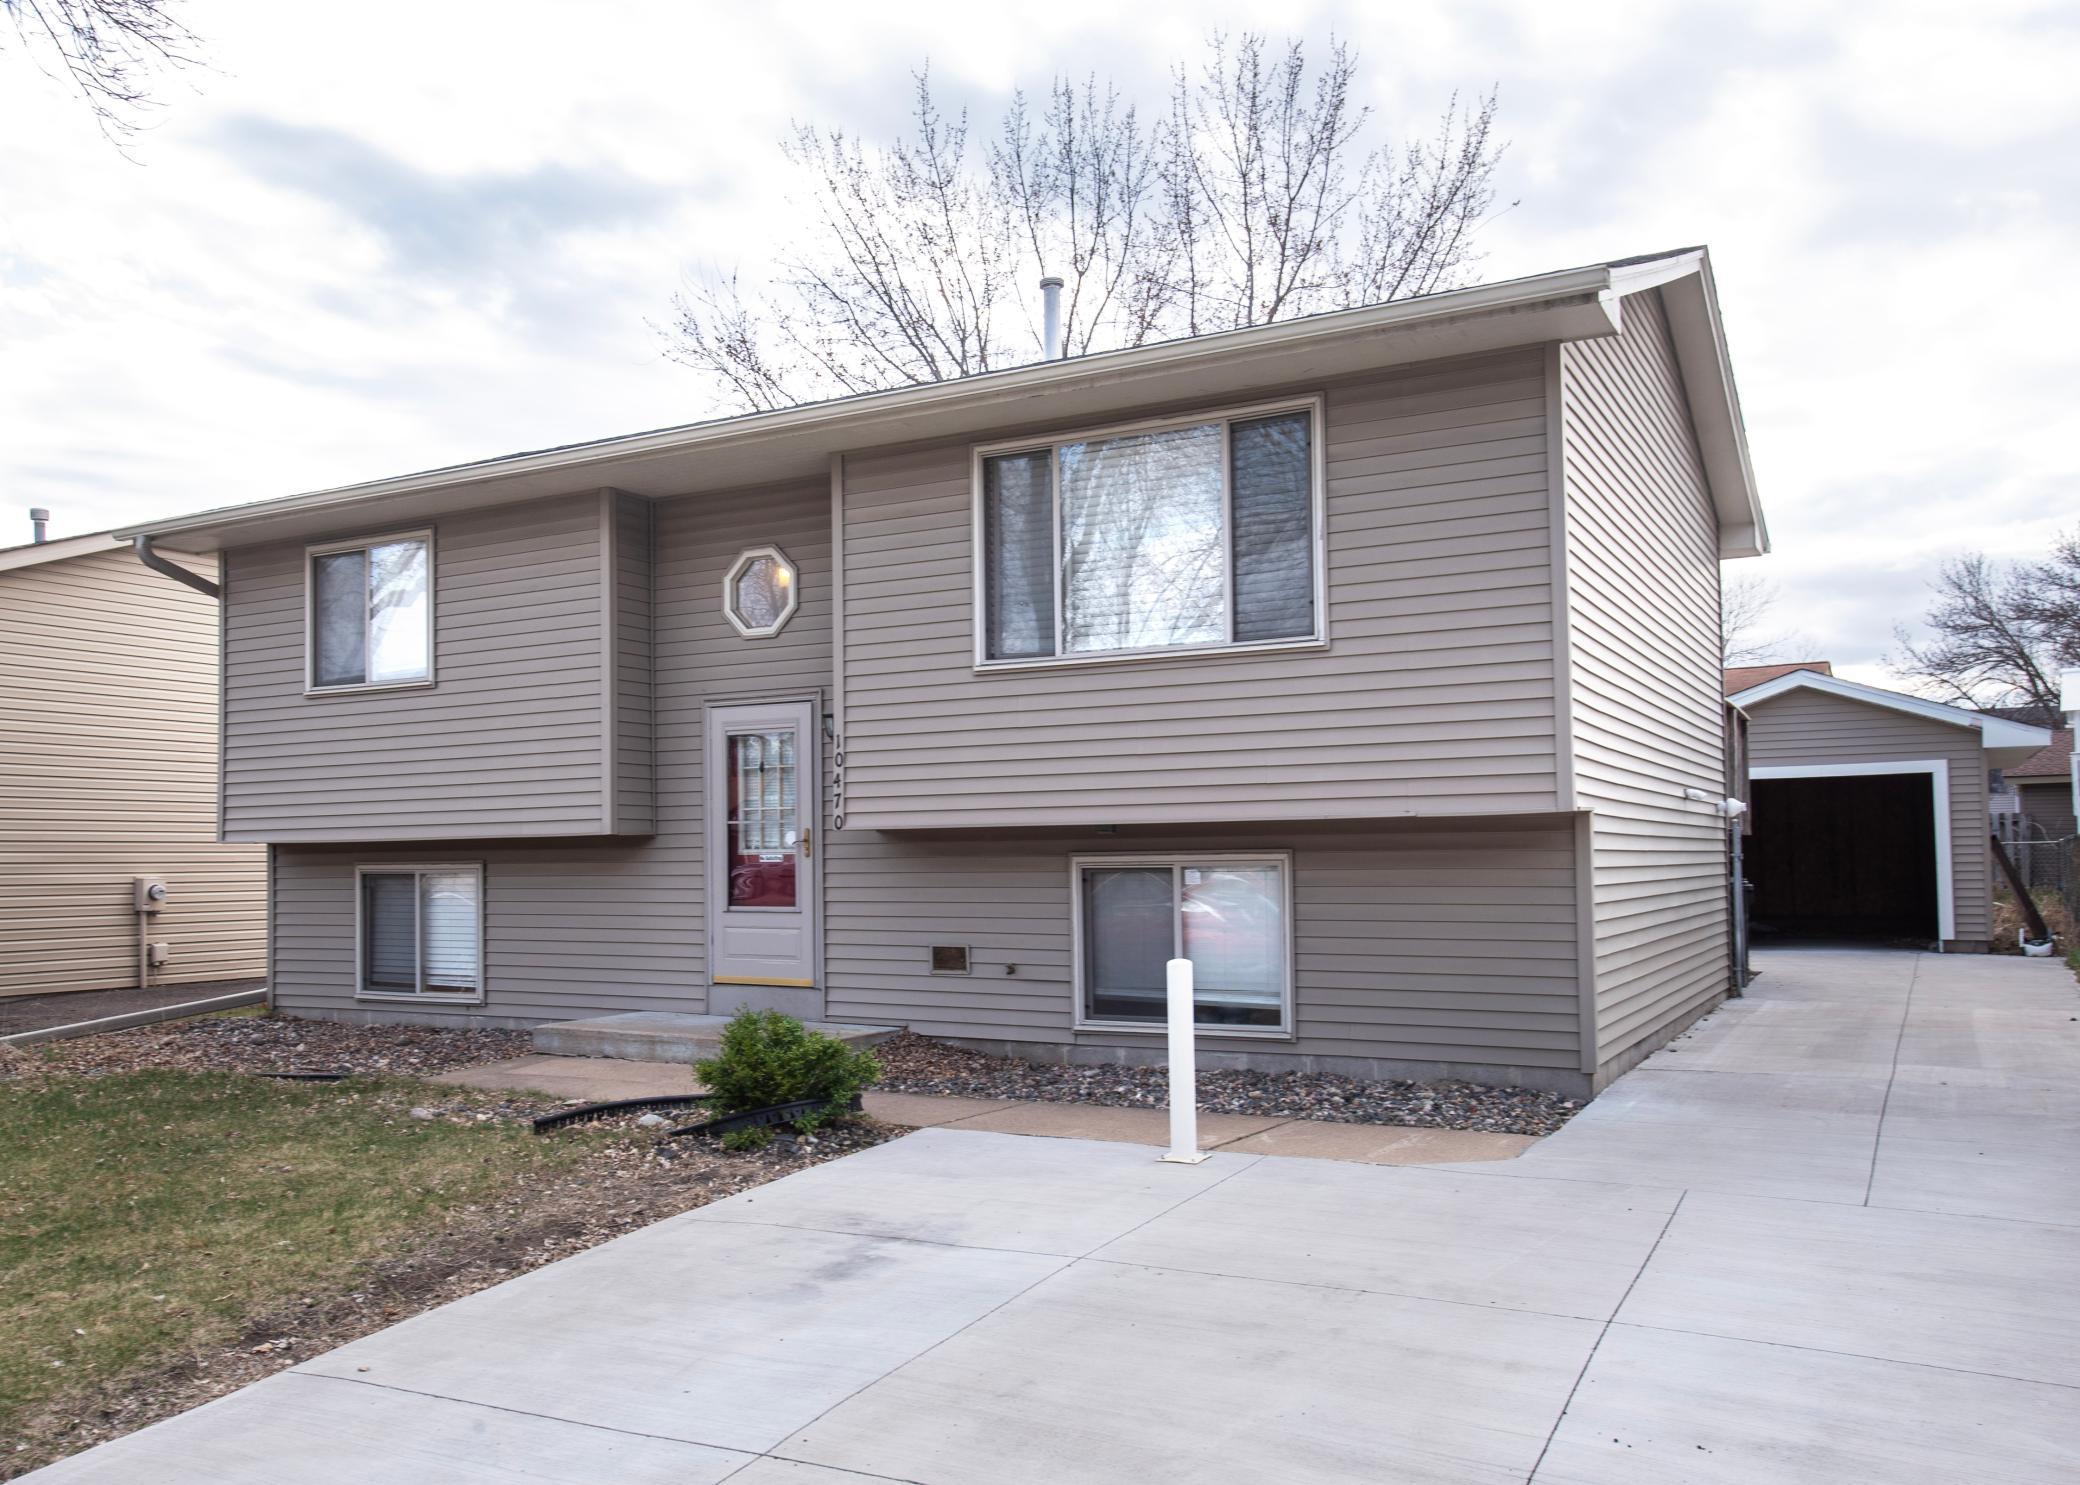
Pending
$329,000
4
bds
|
2
ba
|
1,511
sqft
|
built
1984
10470 Palm St NW, Minneapolis, MN 55433
$-376
Cash flow
-6.0%
Cash-on-Cash Return
4.9%
Cap rate
0.7%
Rent to Value Ratio
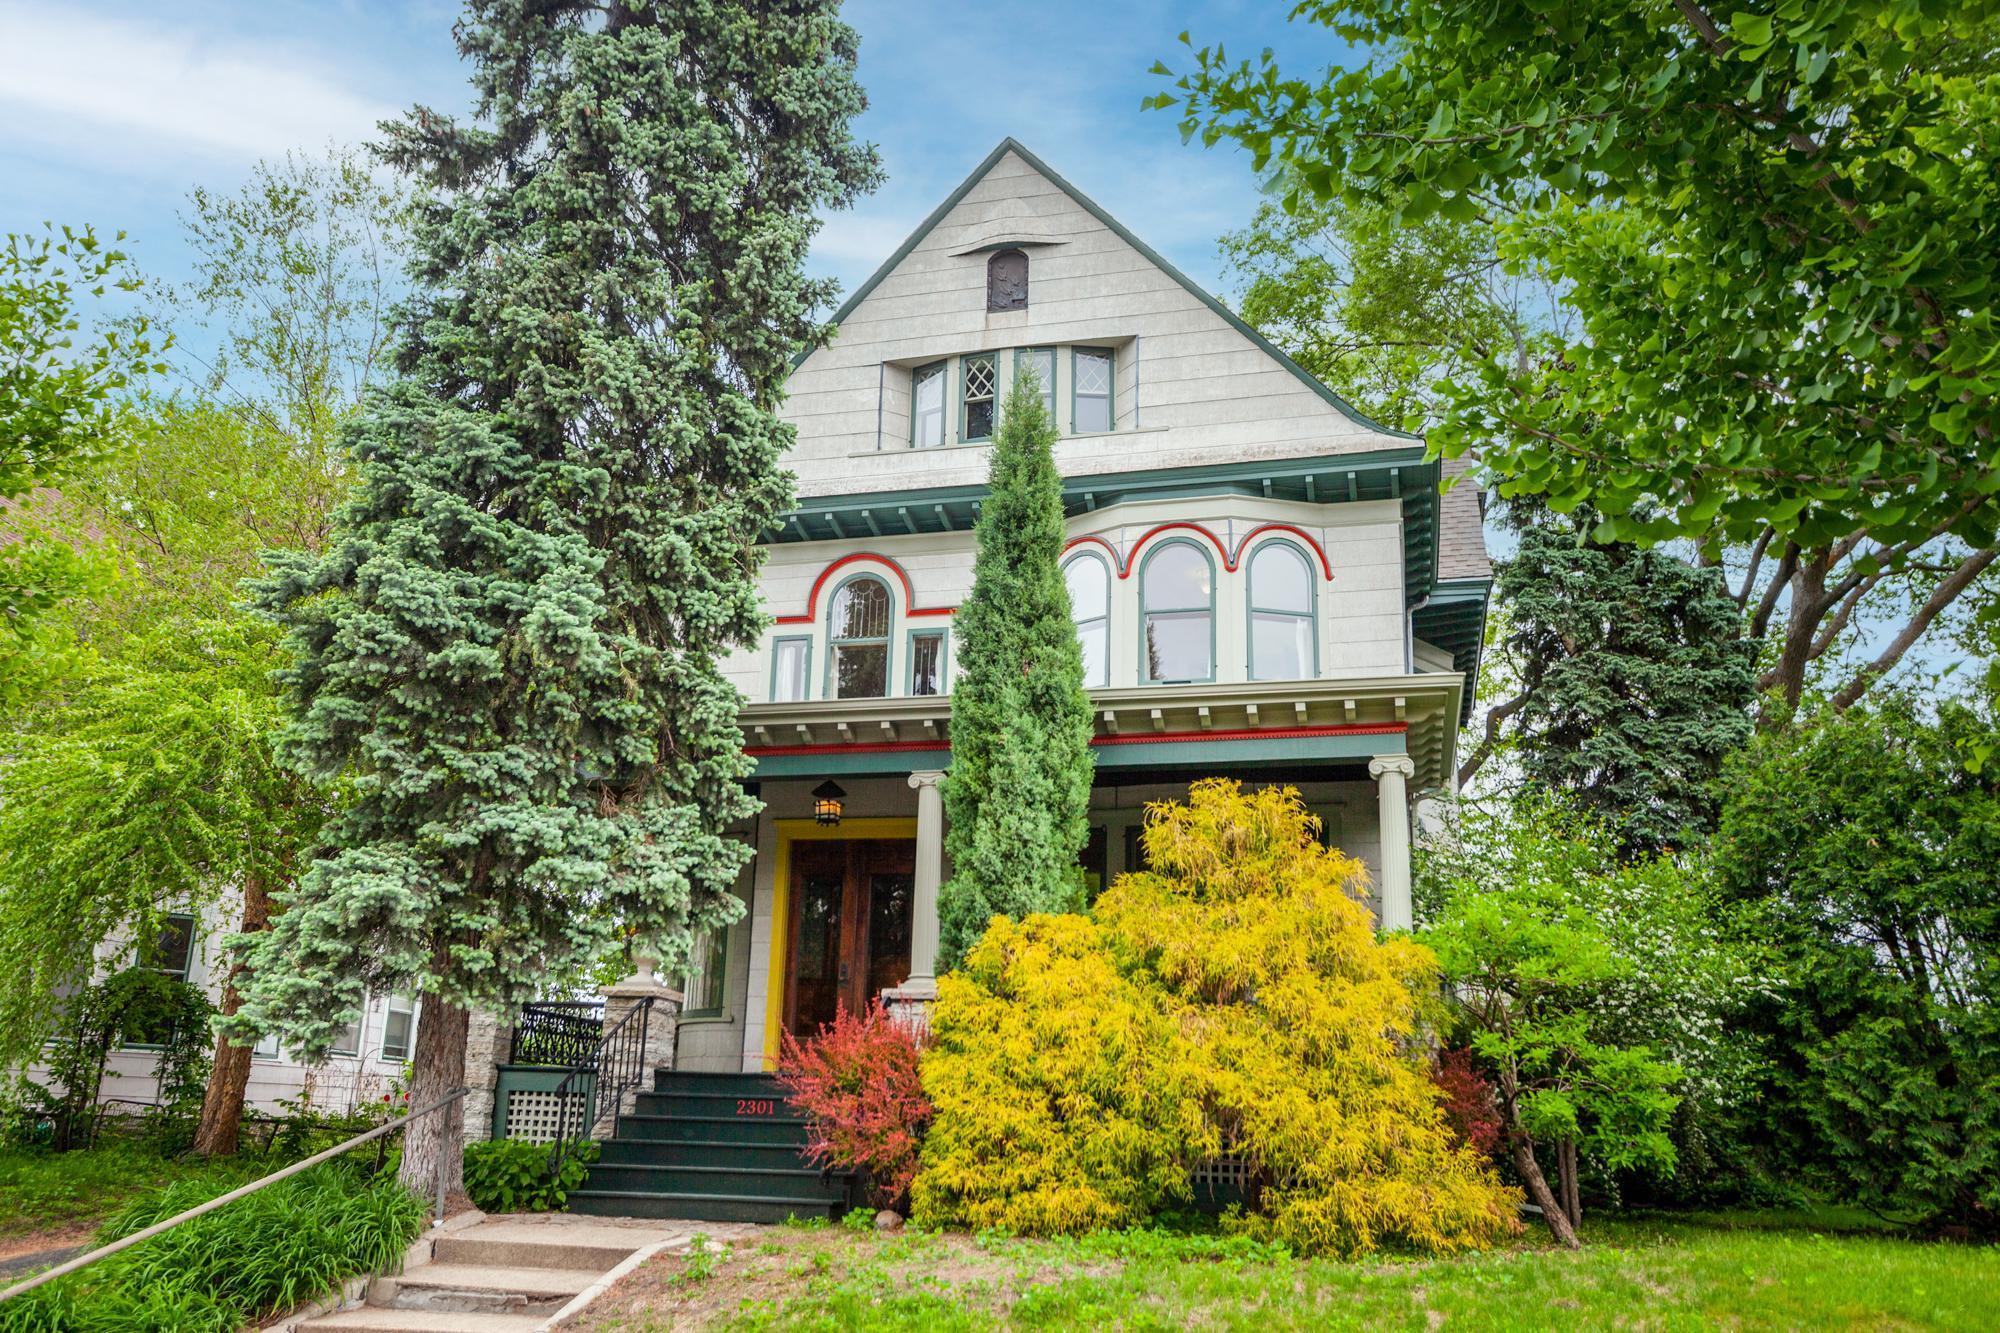
Active
$575,000
5
bds
|
2
ba
|
3,345
sqft
|
built
1895
2301 Aldrich Ave S, Minneapolis, MN 55405
$-1,477
Cash flow
-13.4%
Cash-on-Cash Return
3.2%
Cap rate
0.6%
Rent to Value Ratio
Active
$195,000
1
bds
|
1
ba
|
733
sqft
|
built
2006
15 E Franklin Ave, Minneapolis, MN 55404
$-471
Cash flow
-12.6%
Cash-on-Cash Return
3.4%
Cap rate
0.8%
Rent to Value Ratio
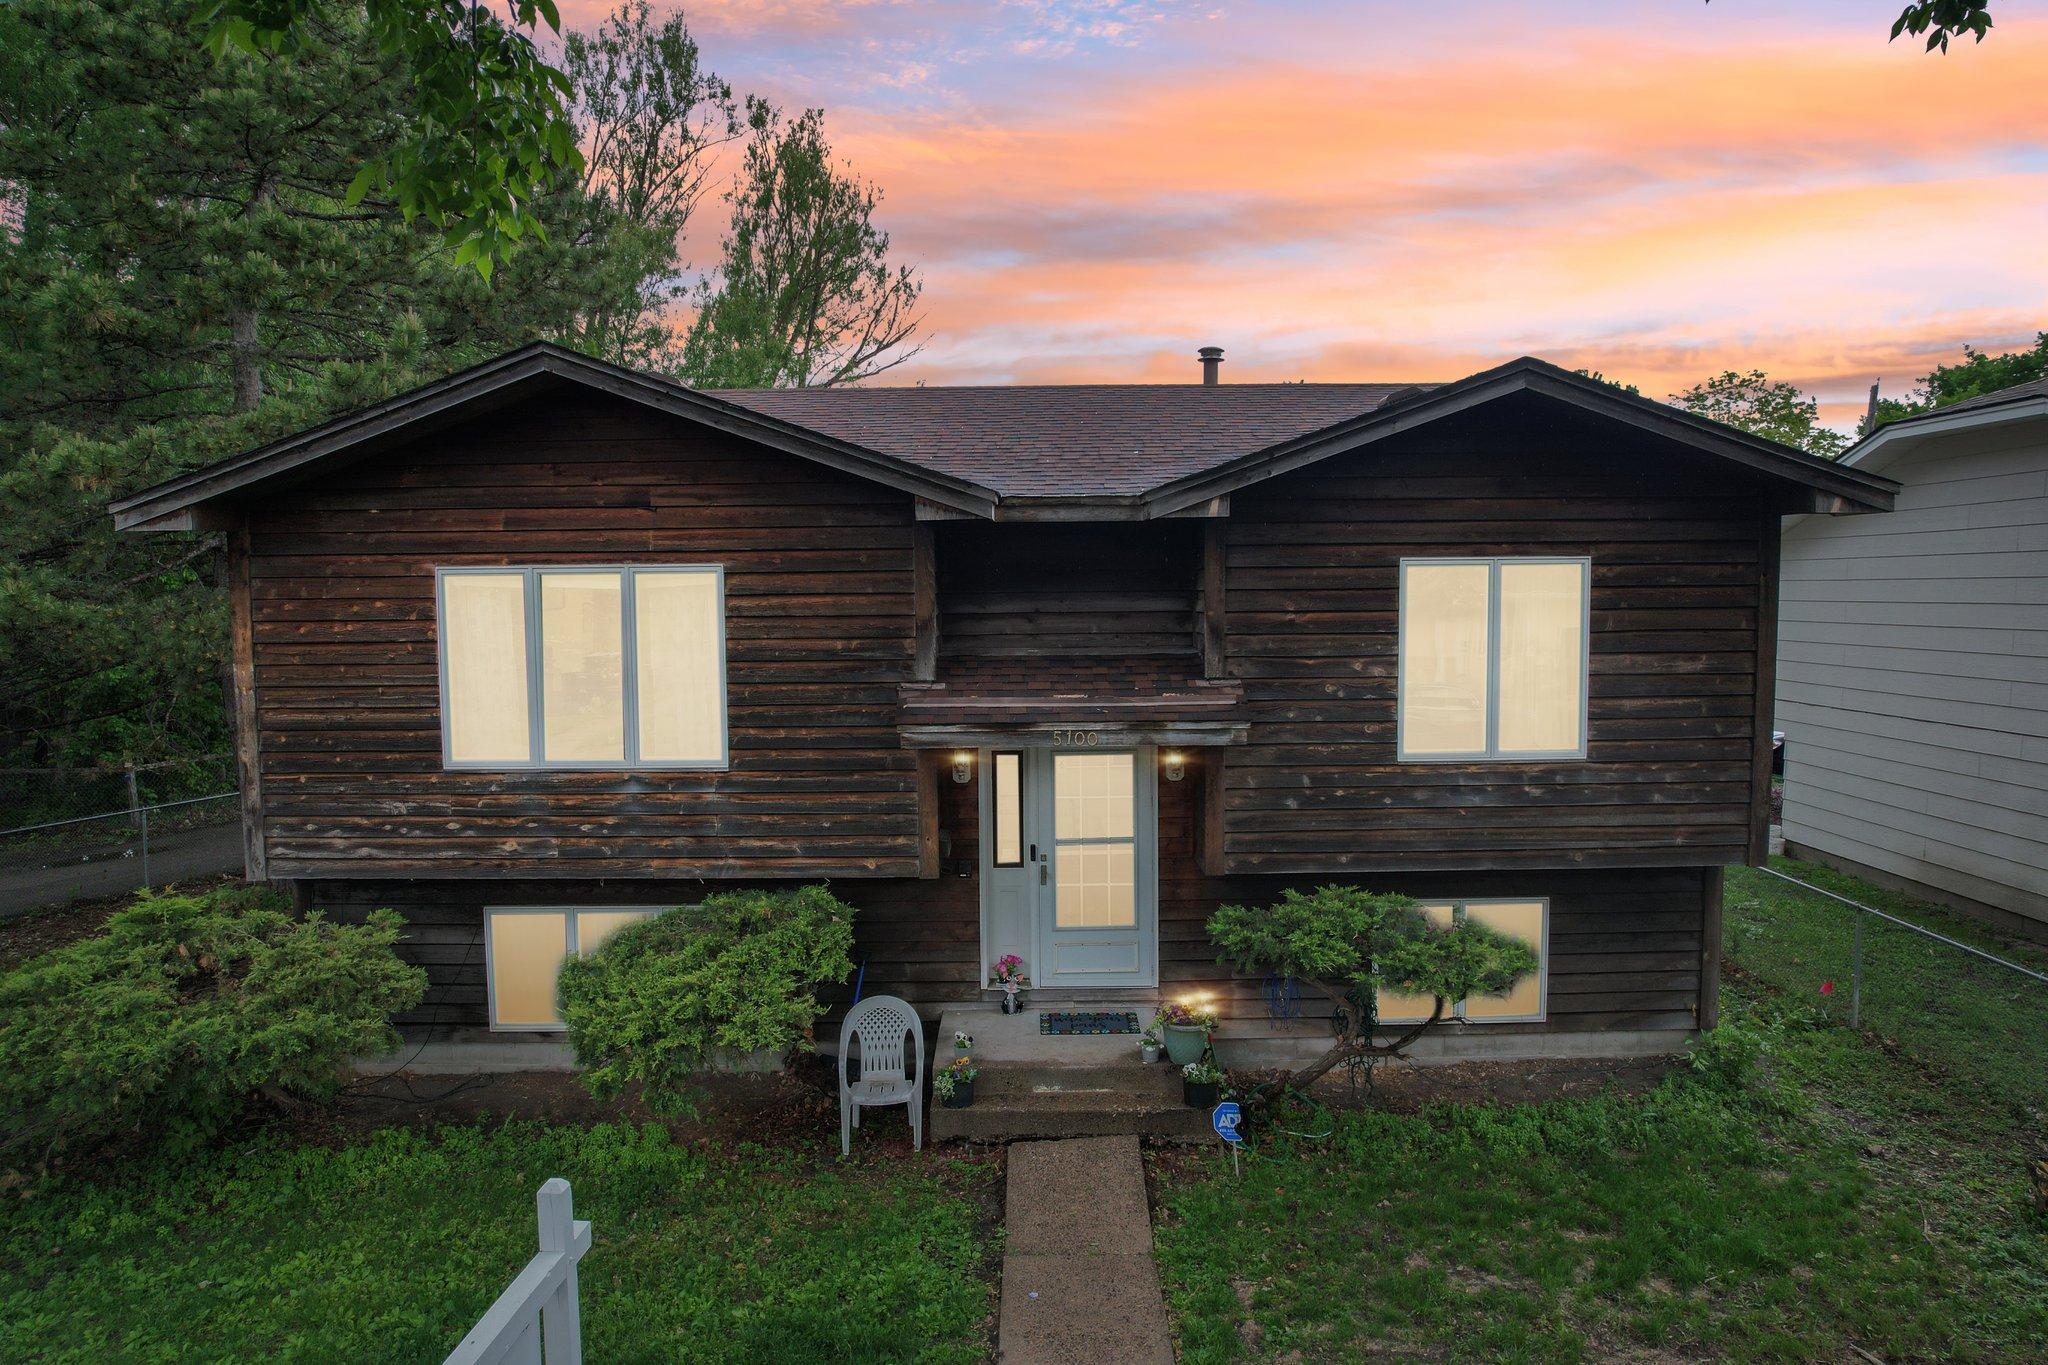
Active
$294,999
3
bds
|
2
ba
|
936
sqft
|
built
1988
5100 Thomas Ave N, Minneapolis, MN 55430
$-591
Cash flow
-10.5%
Cash-on-Cash Return
3.9%
Cap rate
0.6%
Rent to Value Ratio
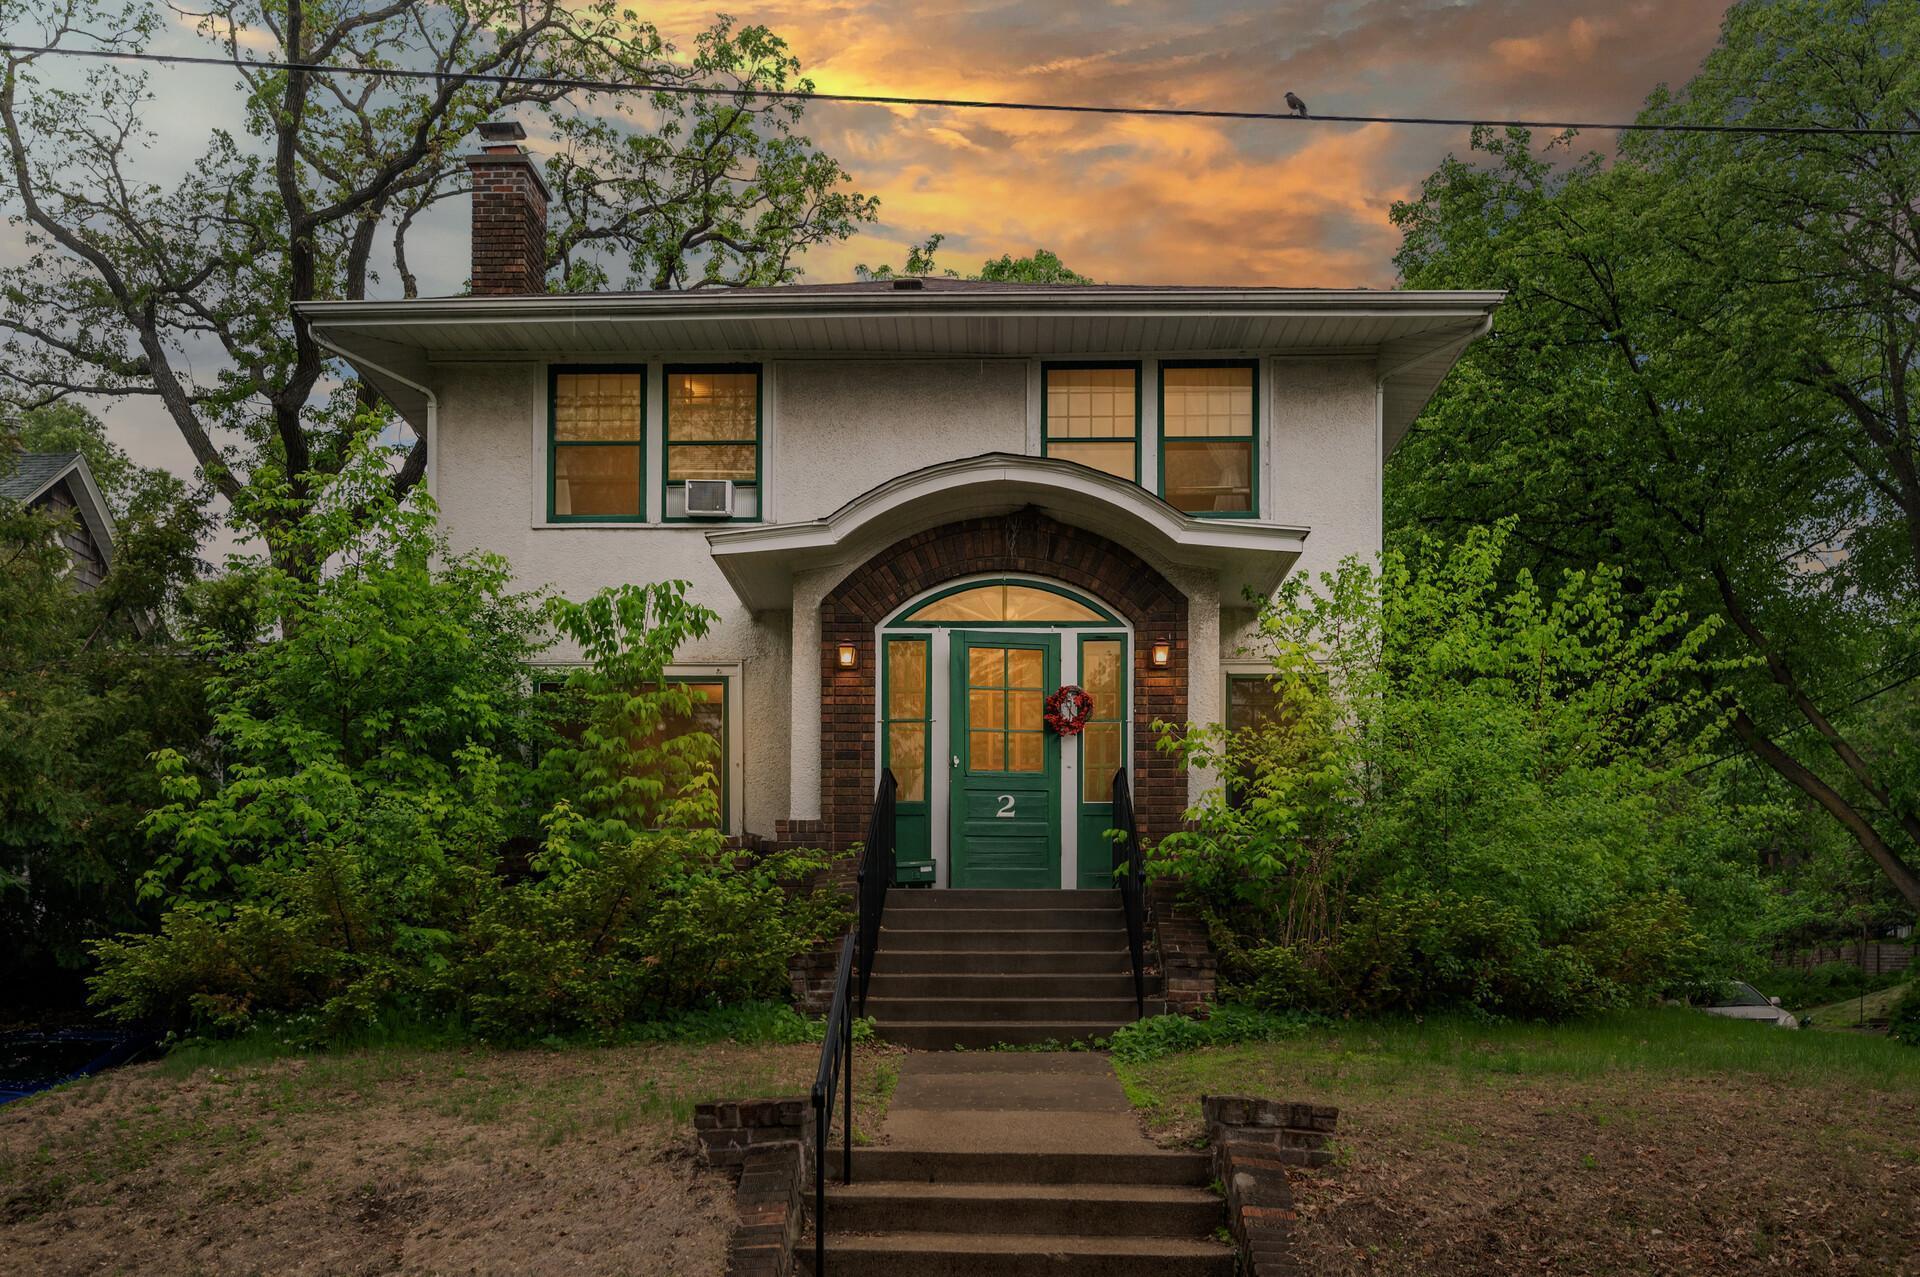
Pending
$419,900
4
bds
|
3
ba
|
2,320
sqft
|
built
1922
2 Melbourne Ave SE, Minneapolis, MN 55414
$-521
Cash flow
-6.5%
Cash-on-Cash Return
4.8%
Cap rate
0.8%
Rent to Value Ratio
Active
$219,900
2
bds
|
2
ba
|
1,205
sqft
|
built
2004
2530 E 34th St, Minneapolis, MN 55406
$-500
Cash flow
-11.9%
Cash-on-Cash Return
3.6%
Cap rate
0.9%
Rent to Value Ratio
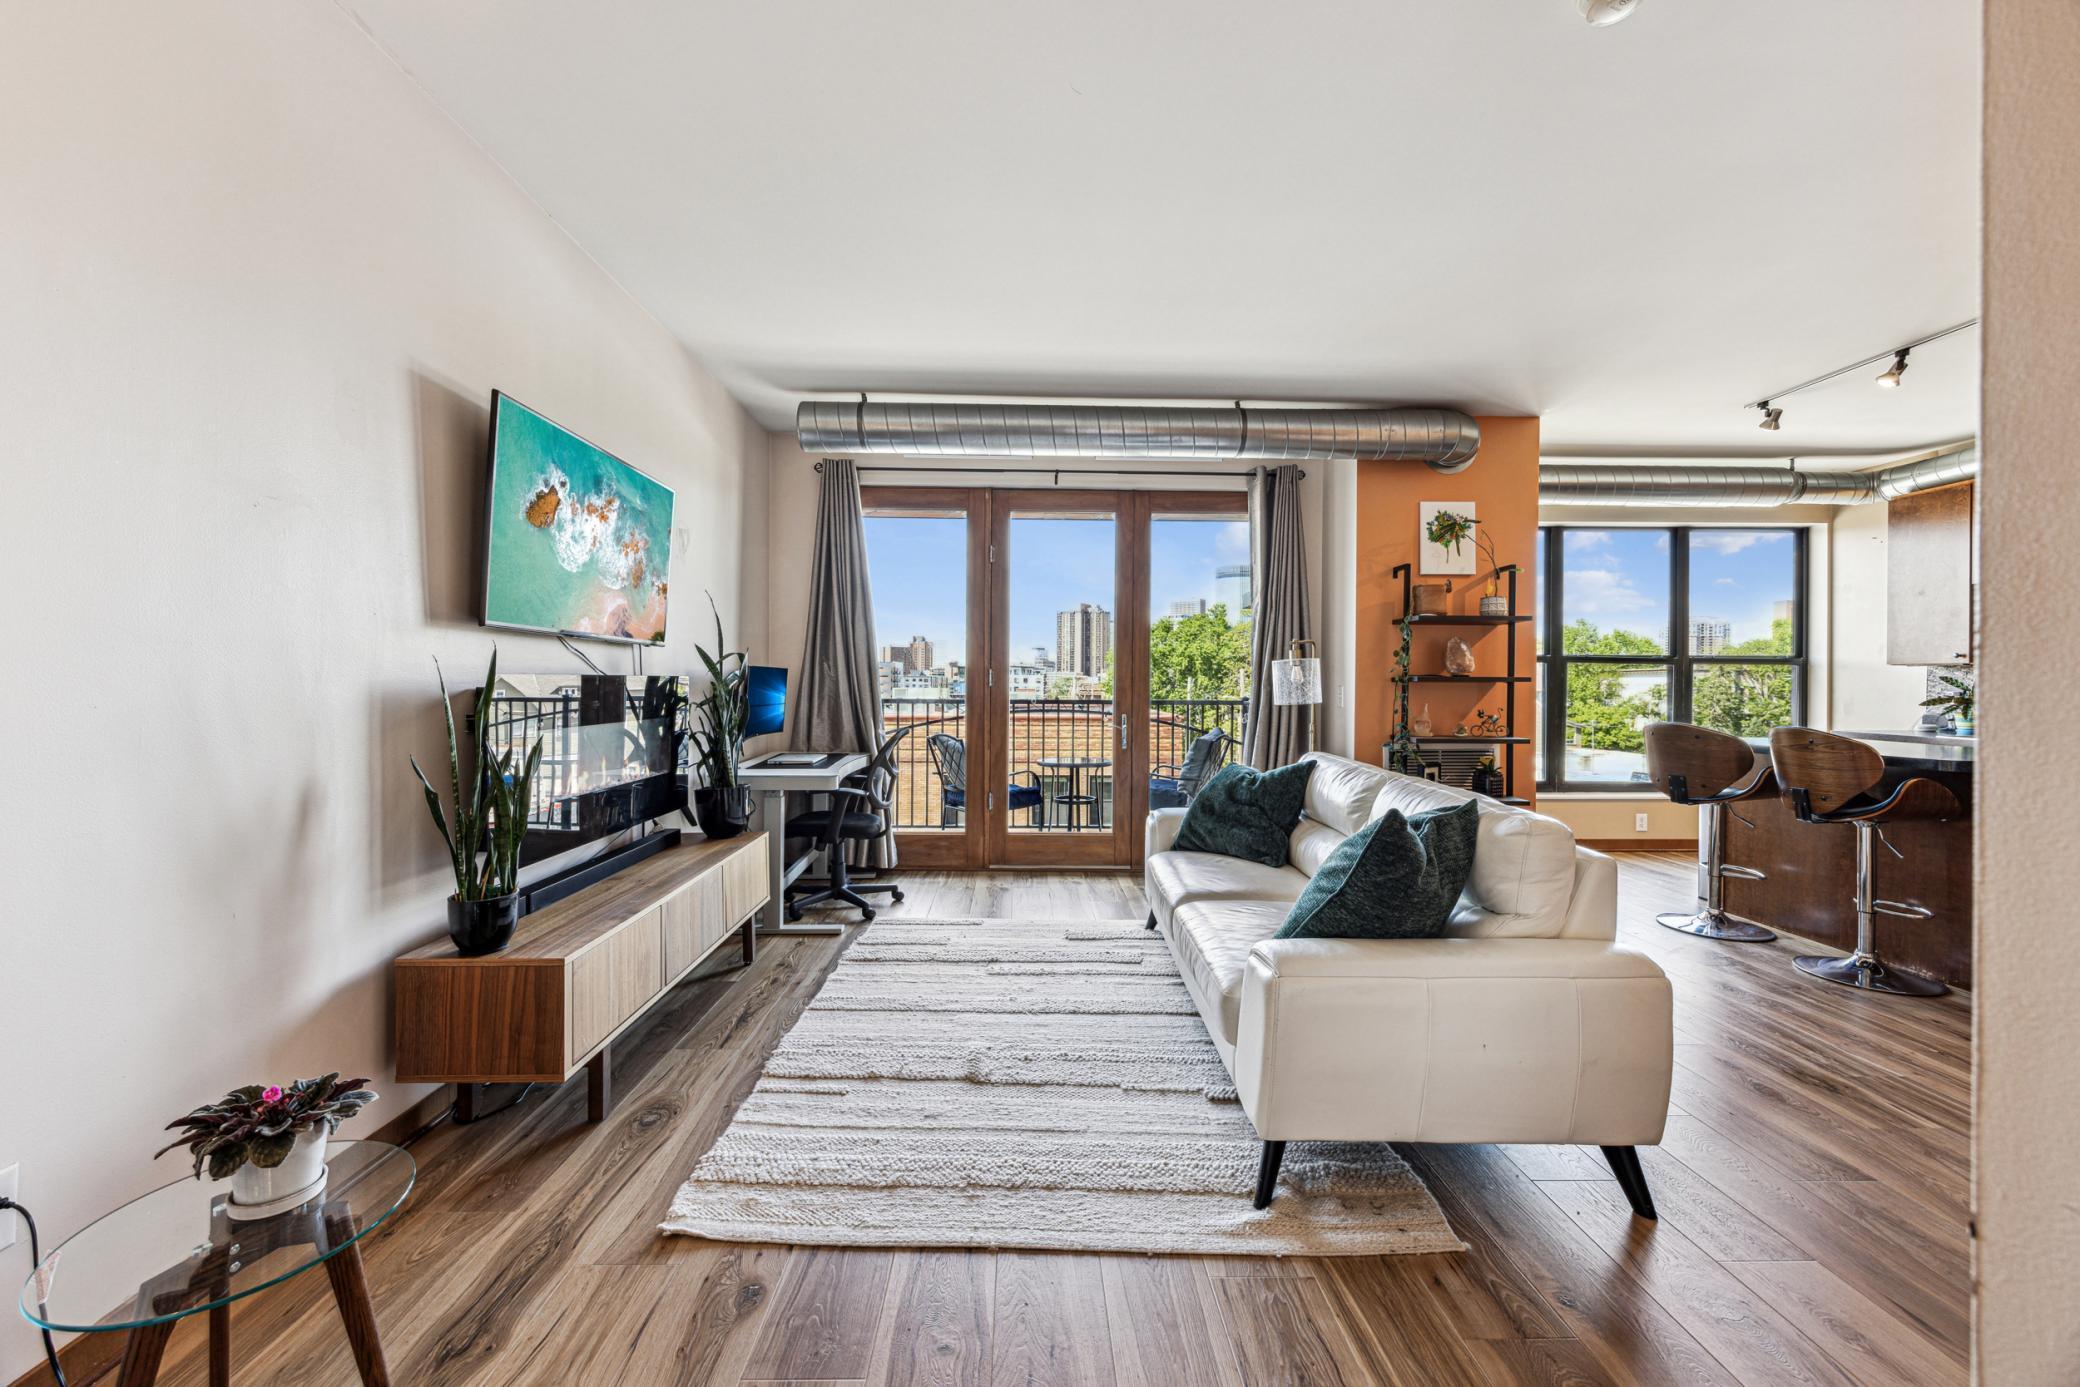
Active
$449,900
2
bds
|
2
ba
|
1,264
sqft
|
built
1989
401 S 1st St, Minneapolis, MN 55401
$-1,862
Cash flow
-21.6%
Cash-on-Cash Return
1.3%
Cap rate
0.6%
Rent to Value Ratio
Active
$99,900
2
bds
|
1
ba
|
800
sqft
|
built
1947
4642 Camden Ave N, Minneapolis, MN 55412
$-393
Cash flow
-20.5%
Cash-on-Cash Return
1.6%
Cap rate
1.4%
Rent to Value Ratio

Active
$379,900
2
bds
|
2
ba
|
1,061
sqft
|
built
2004
2840 Bryant Ave S, Minneapolis, MN 55408
$-1,036
Cash flow
-14.2%
Cash-on-Cash Return
3.0%
Cap rate
0.7%
Rent to Value Ratio
Active
$244,900
2
bds
|
2
ba
|
1,121
sqft
|
built
1965
15 S 1st St, Minneapolis, MN 55401
$-1,142
Cash flow
-24.3%
Cash-on-Cash Return
0.7%
Cap rate
0.8%
Rent to Value Ratio
Active
$1,695,000
7
bds
|
8
ba
|
6,860
sqft
|
built
1908
1647 W 26th St, Minneapolis, MN 55405
$-3,999
Cash flow
-12.3%
Cash-on-Cash Return
3.5%
Cap rate
0.7%
Rent to Value Ratio
Active
$1,350,000
4
bds
|
3
ba
|
4,434
sqft
|
built
1993
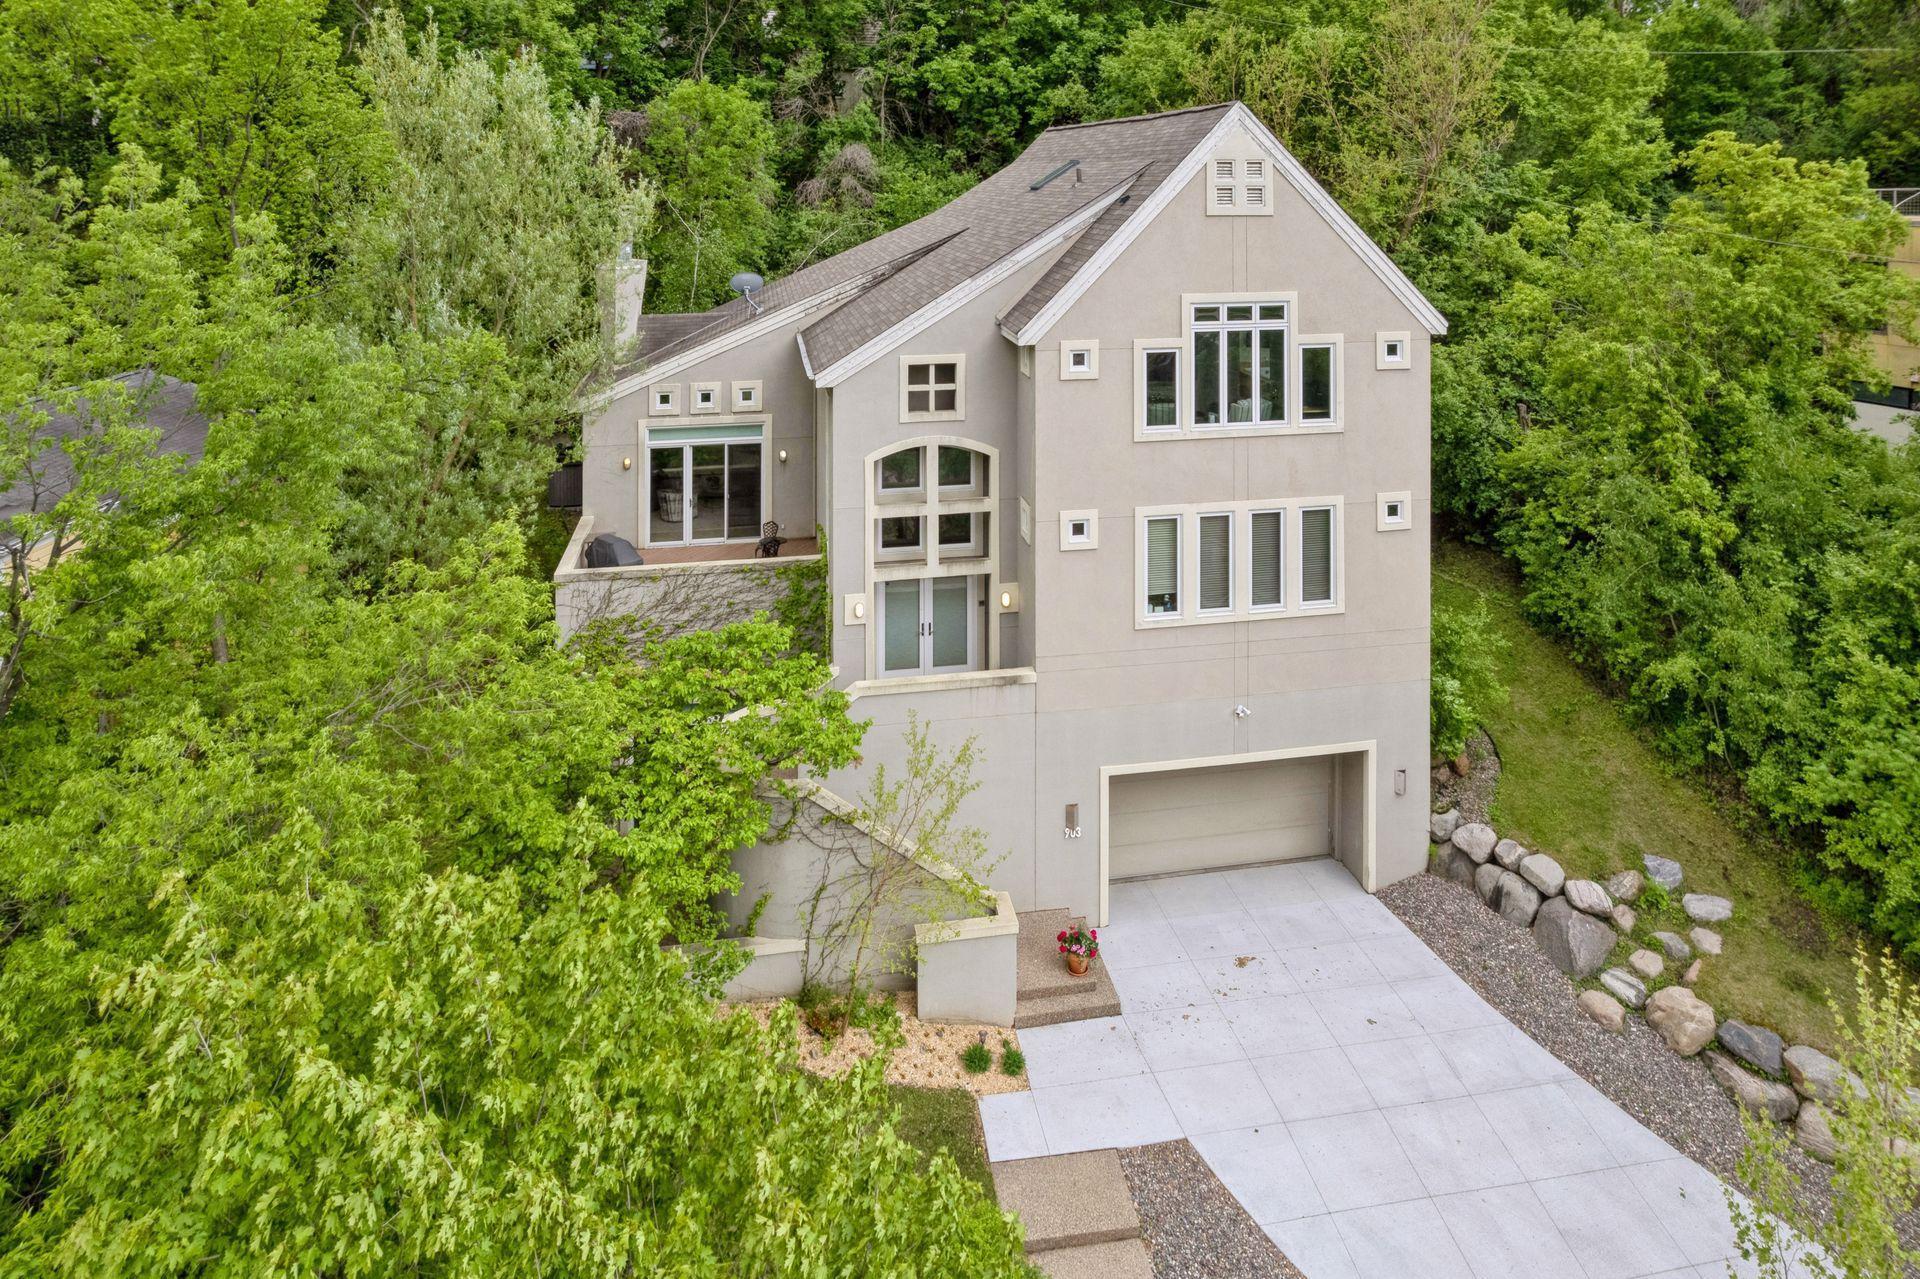
903 Kenwood Pkwy, Minneapolis, MN 55403
$-5,340
Cash flow
-20.6%
Cash-on-Cash Return
1.5%
Cap rate
0.4%
Rent to Value Ratio
Active
$459,900
4
bds
|
2
ba
|
2,113
sqft
|
built
1893
3435 Blaisdell Ave, Minneapolis, MN 55408
$-1,323
Cash flow
-15.0%
Cash-on-Cash Return
2.8%
Cap rate
0.5%
Rent to Value Ratio
Active
$925,000
5
bds
|
5
ba
|
4,660
sqft
|
built
2014
16135 52nd Pl N, Minneapolis, MN 55446
$-2,570
Cash flow
-14.5%
Cash-on-Cash Return
3.0%
Cap rate
0.5%
Rent to Value Ratio
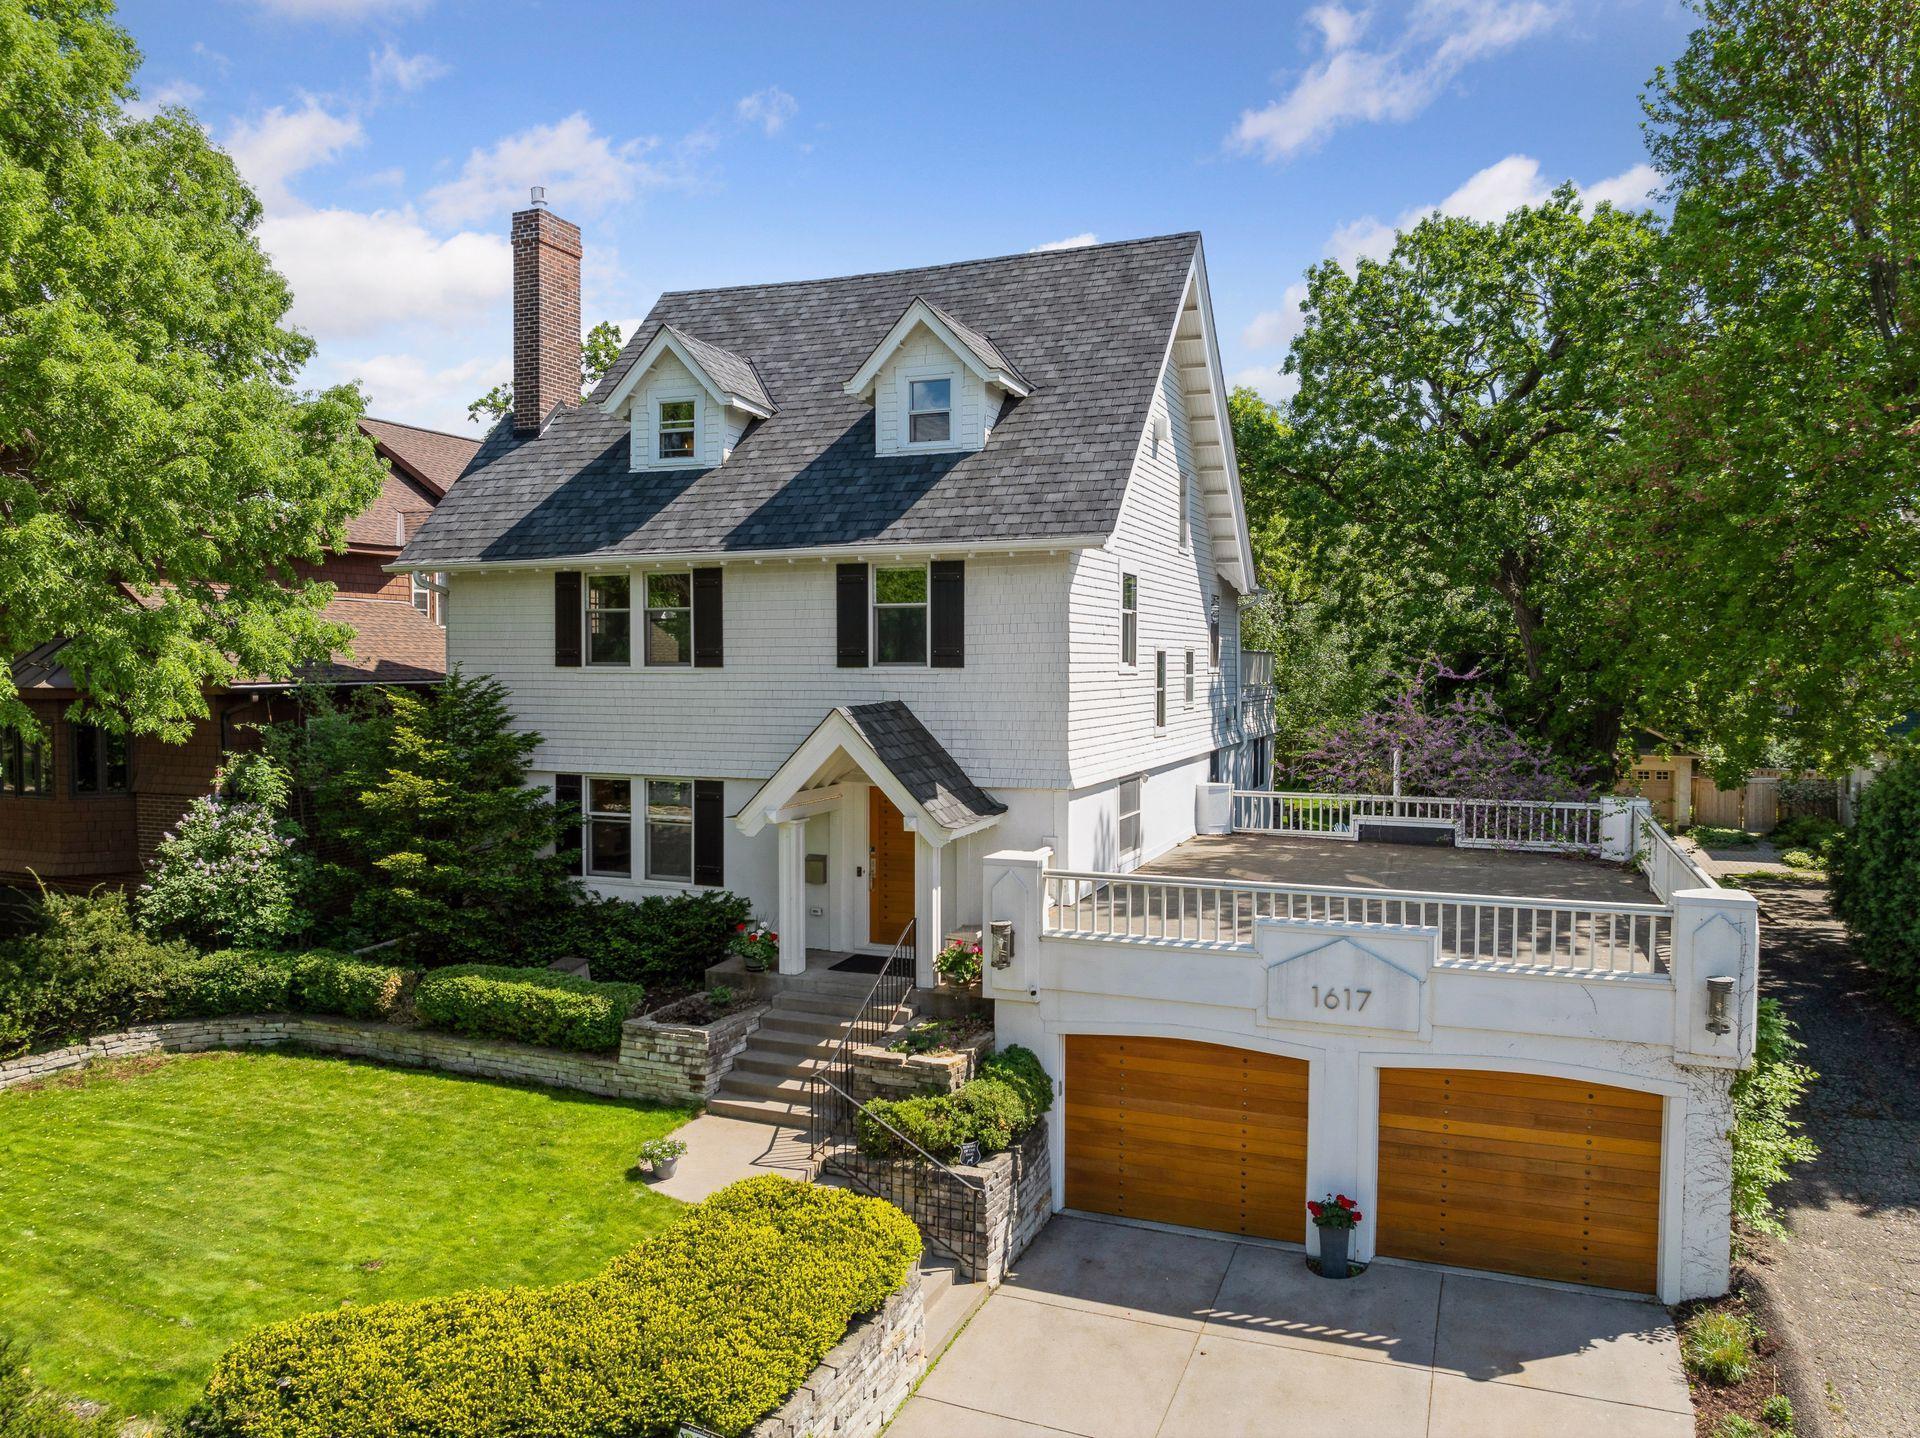
Active
$1,575,000
4
bds
|
5
ba
|
4,181
sqft
|
built
1907
1617 W Franklin Ave, Minneapolis, MN 55405
$-6,563
Cash flow
-21.7%
Cash-on-Cash Return
1.3%
Cap rate
0.3%
Rent to Value Ratio
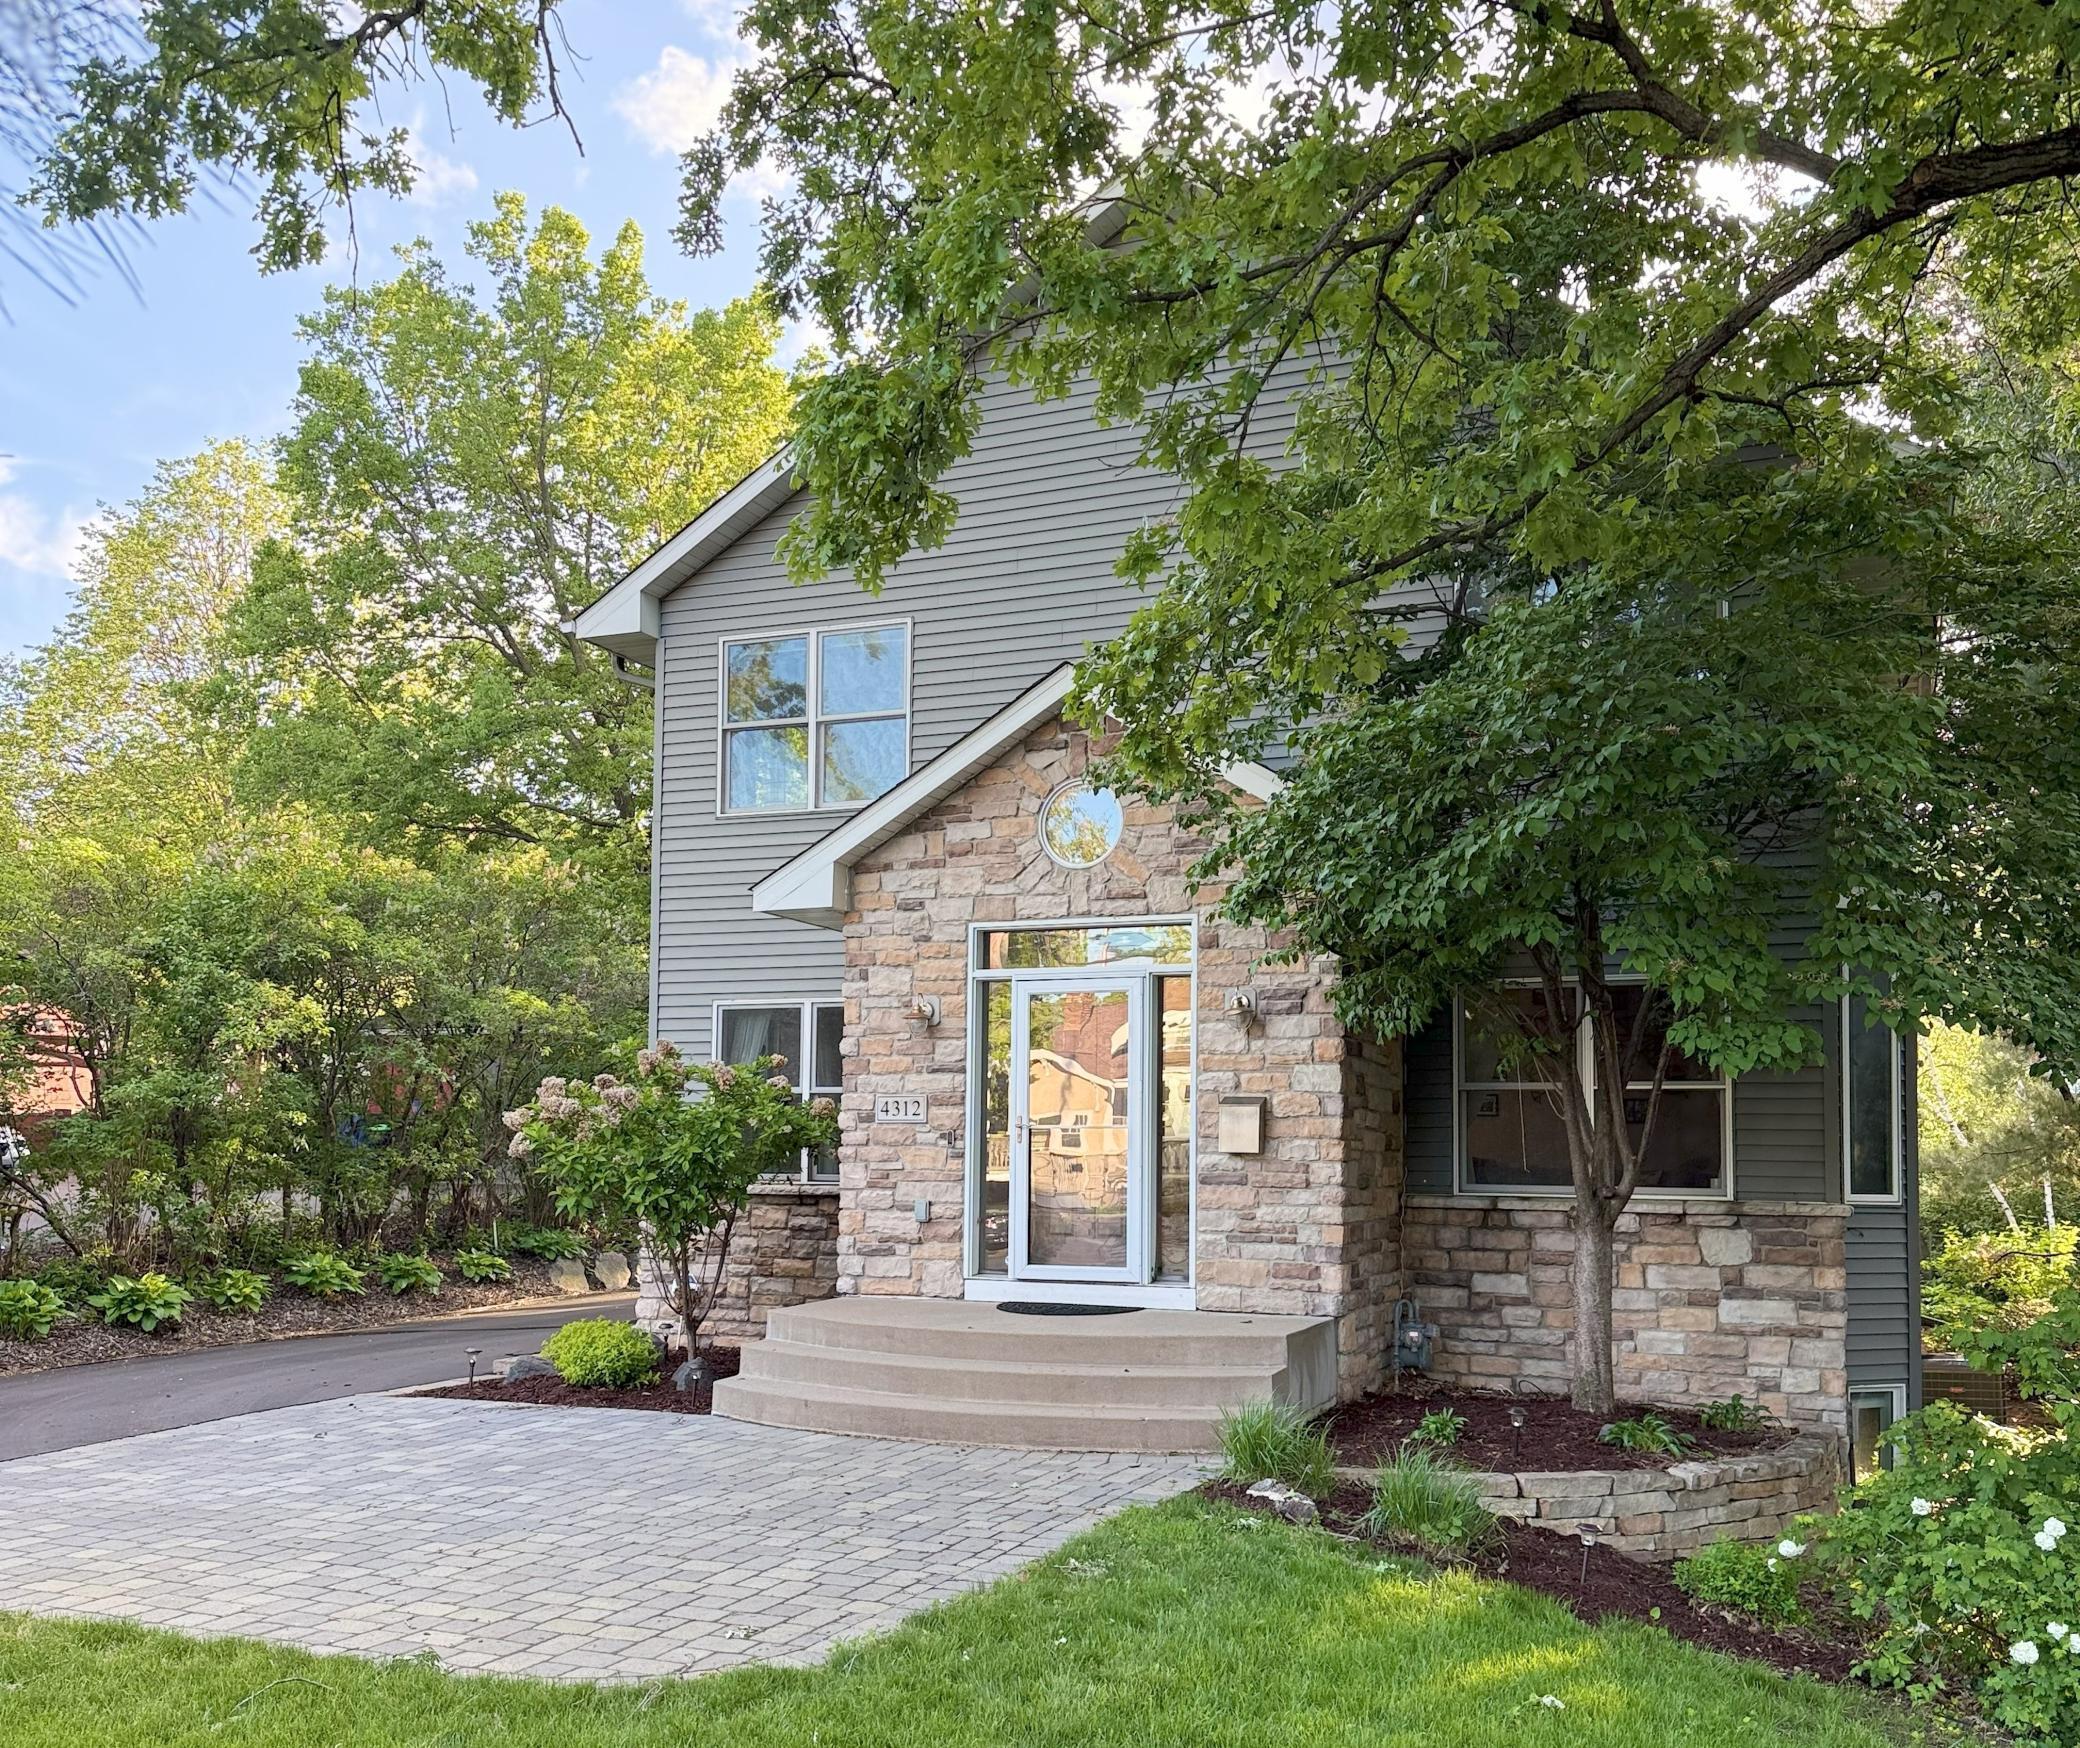
Active
$899,900
4
bds
|
4
ba
|
3,838
sqft
|
built
2005
4312 France Ave S, Minneapolis, MN 55410
$-2,086
Cash flow
-12.1%
Cash-on-Cash Return
3.5%
Cap rate
0.6%
Rent to Value Ratio
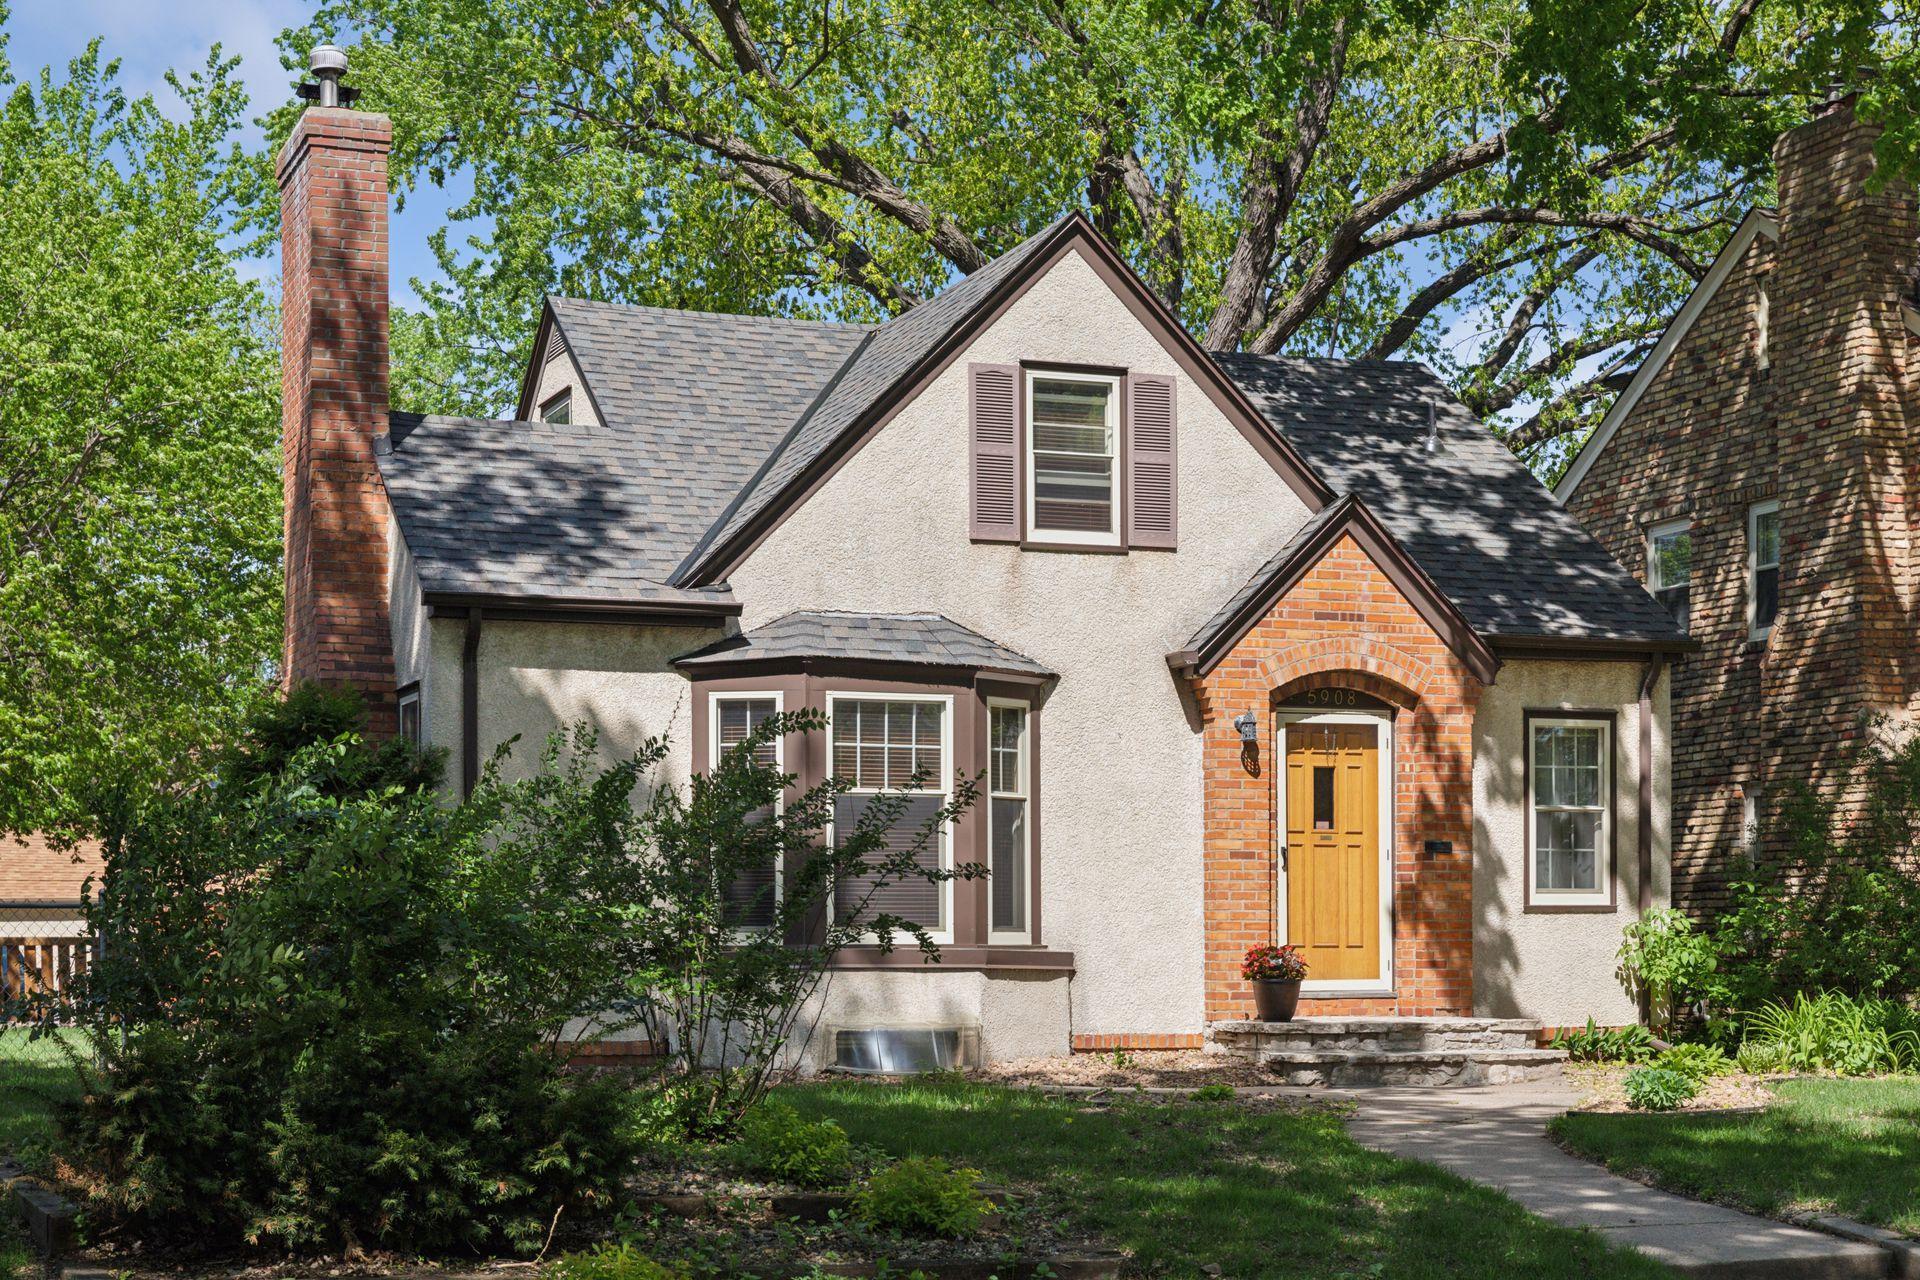
Active
$498,750
4
bds
|
3
ba
|
2,536
sqft
|
built
1941
5908 Park Ave, Minneapolis, MN 55417
$-888
Cash flow
-9.3%
Cash-on-Cash Return
4.1%
Cap rate
0.6%
Rent to Value Ratio
Active
$525,000
7
bds
|
3
ba
|
3,615
sqft
|
built
1925
3549 Portland Ave, Minneapolis, MN 55407
$-1,920
Cash flow
-19.1%
Cash-on-Cash Return
1.9%
Cap rate
0.4%
Rent to Value Ratio
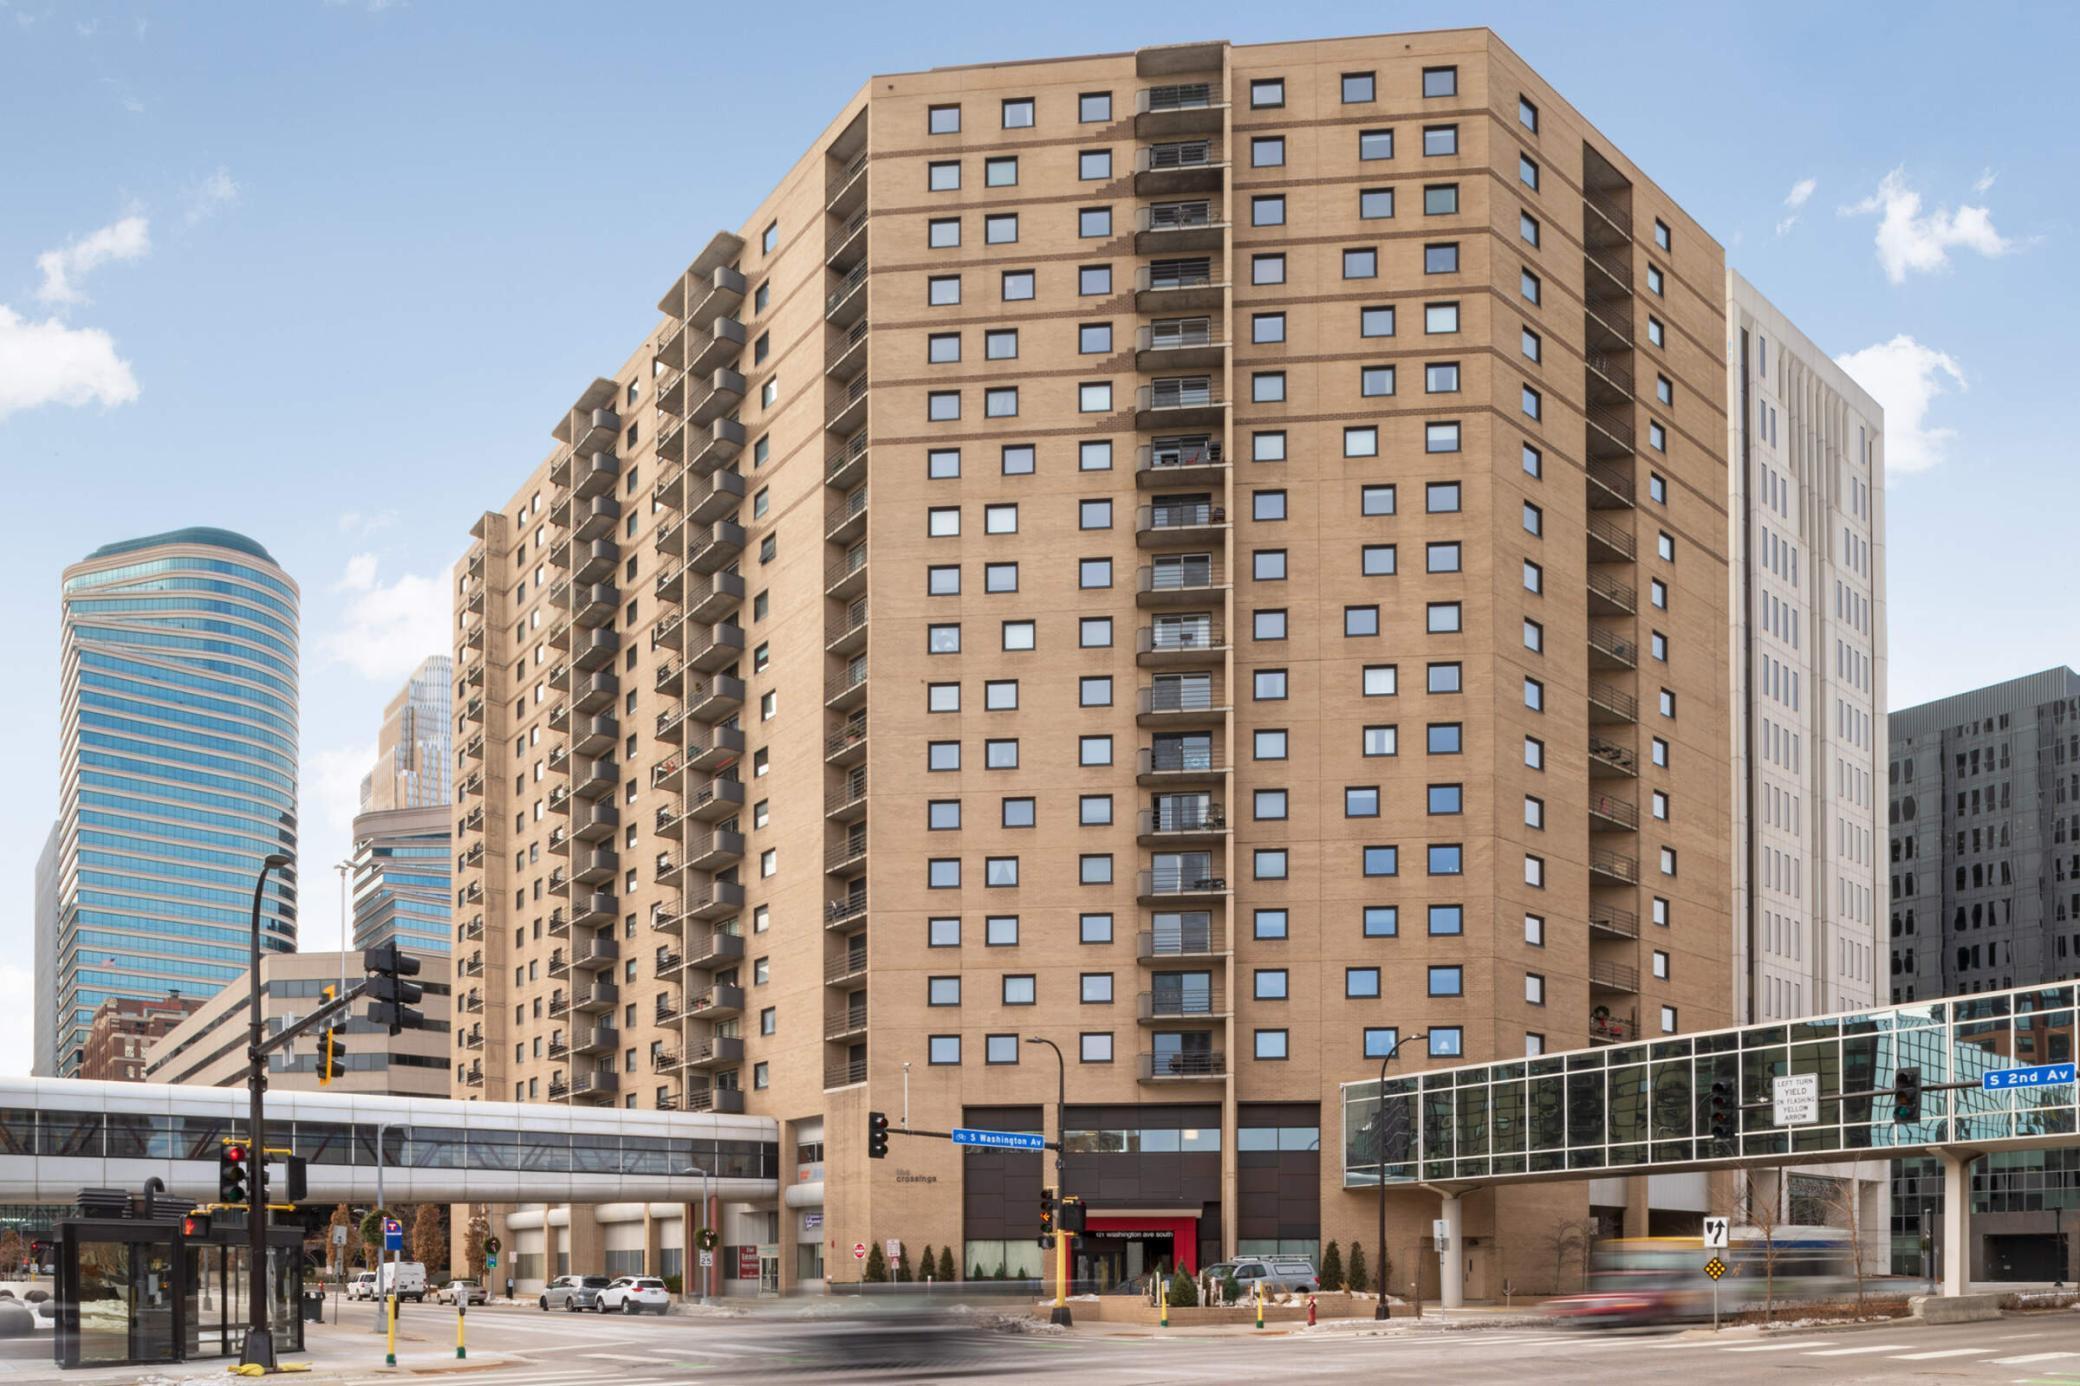
Active
$185,000
1
bds
|
1
ba
|
771
sqft
|
built
1981
121 Washington Ave S, Minneapolis, MN 55401
$-653
Cash flow
-18.4%
Cash-on-Cash Return
2.0%
Cap rate
0.9%
Rent to Value Ratio

Active
$120,000
1
bds
|
1
ba
|
780
sqft
|
built
1986
1425 W 28th St, Minneapolis, MN 55408
$-475
Cash flow
-20.7%
Cash-on-Cash Return
1.5%
Cap rate
1.2%
Rent to Value Ratio
Active
$299,900
4
bds
|
2
ba
|
1,490
sqft
|
built
1910
1711 22nd Ave NE, Minneapolis, MN 55418
$-9
Cash flow
-0.2%
Cash-on-Cash Return
6.2%
Cap rate
0.9%
Rent to Value Ratio
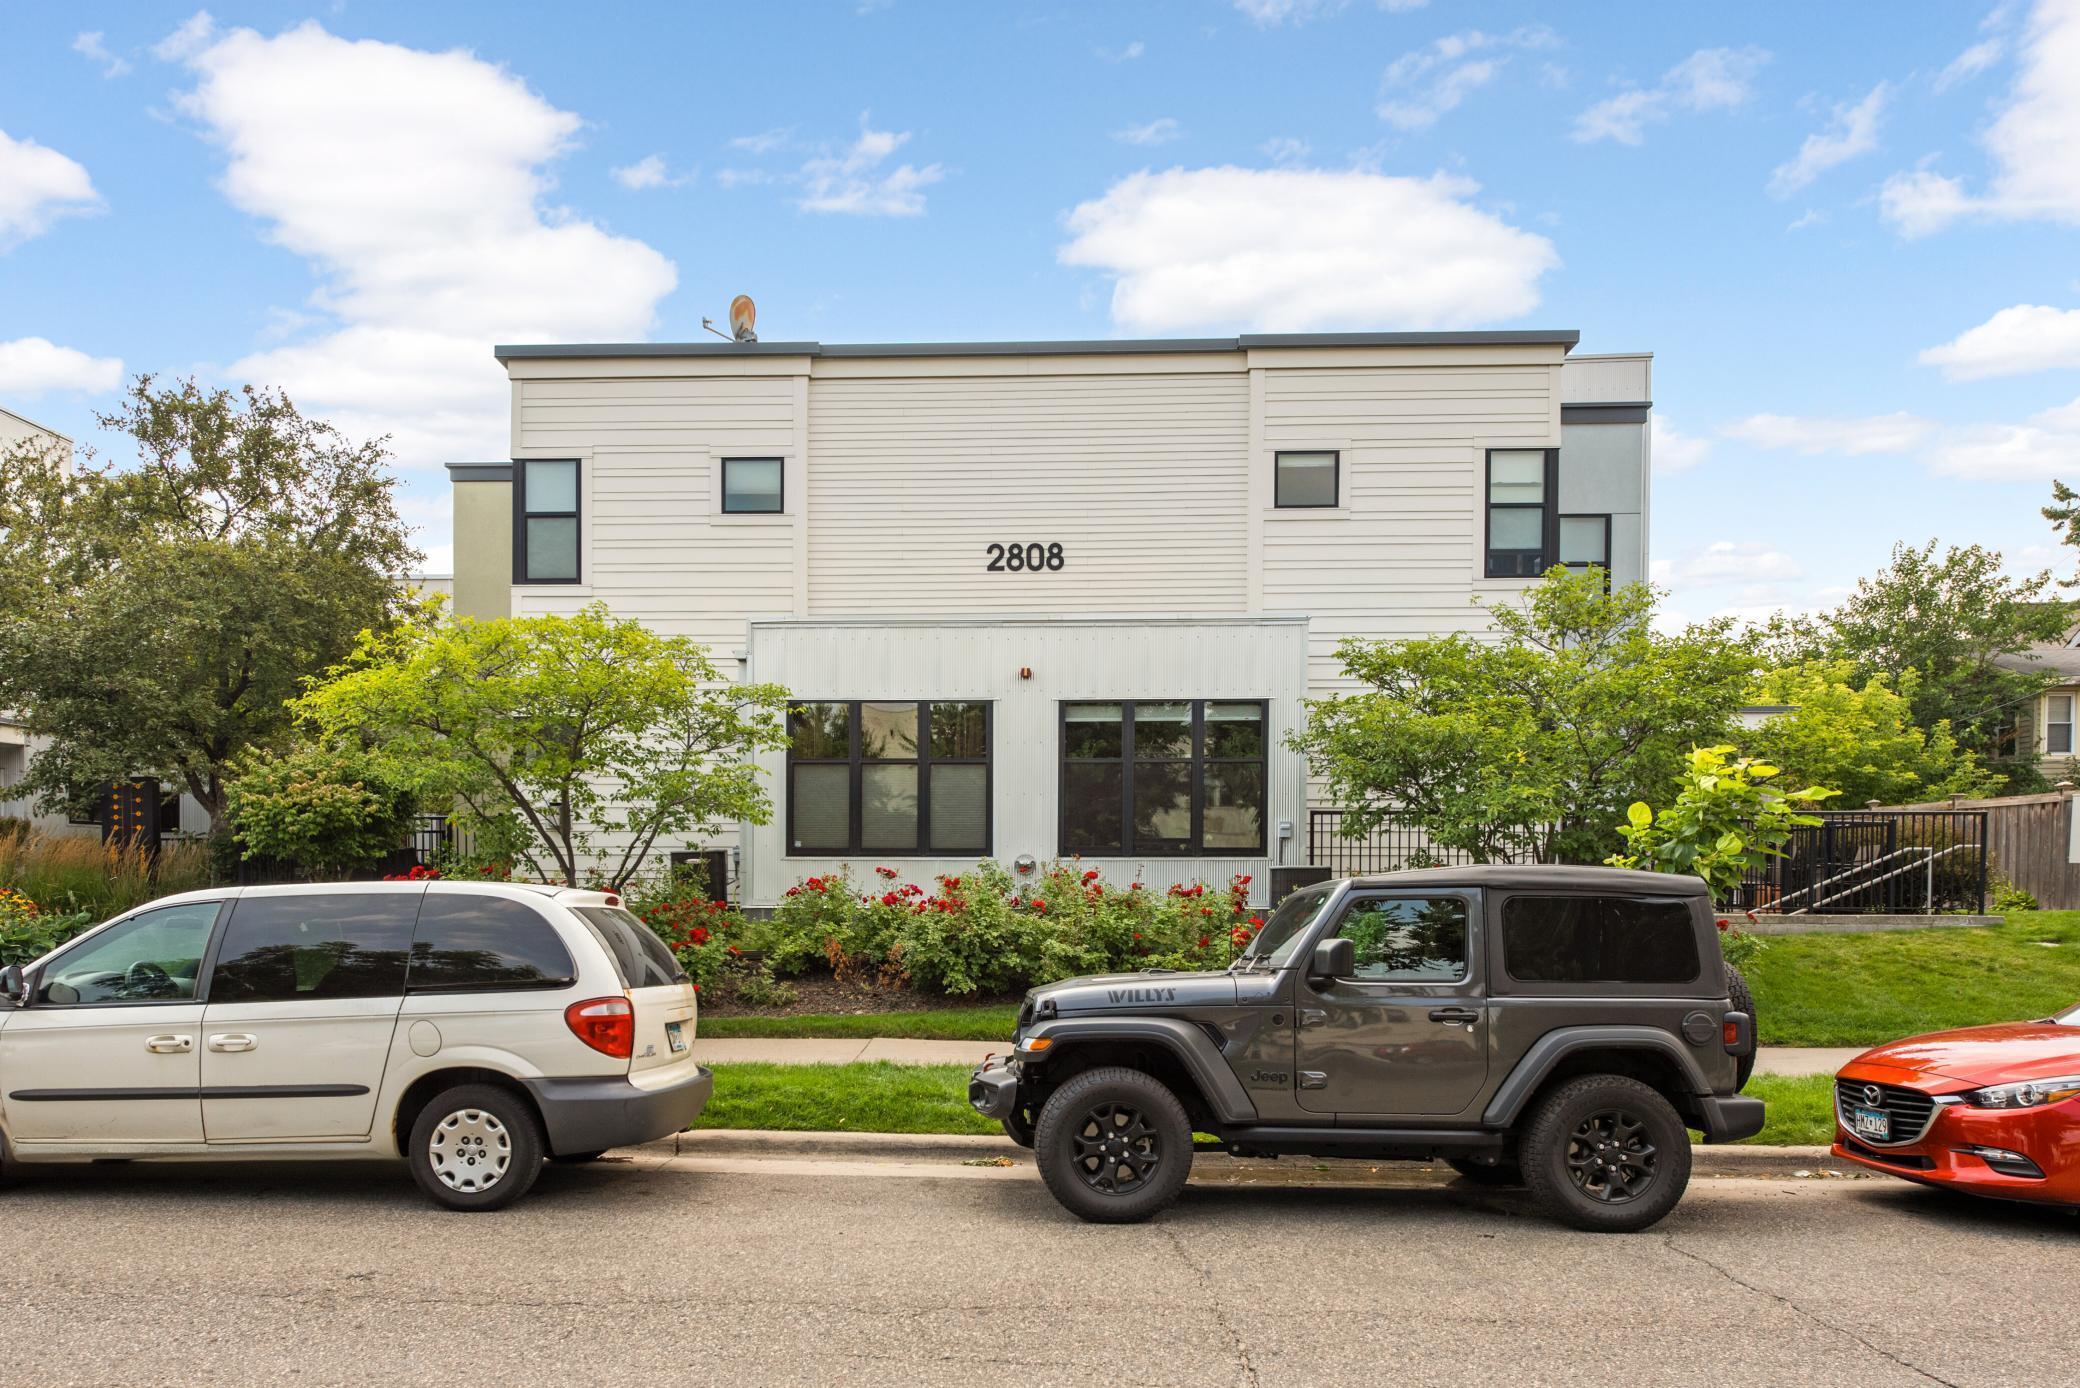
Active
$278,000
1
bds
|
2
ba
|
1,030
sqft
|
built
2005
2808 Aldrich Ave S, Minneapolis, MN 55408
$-756
Cash flow
-14.2%
Cash-on-Cash Return
3.0%
Cap rate
0.8%
Rent to Value Ratio
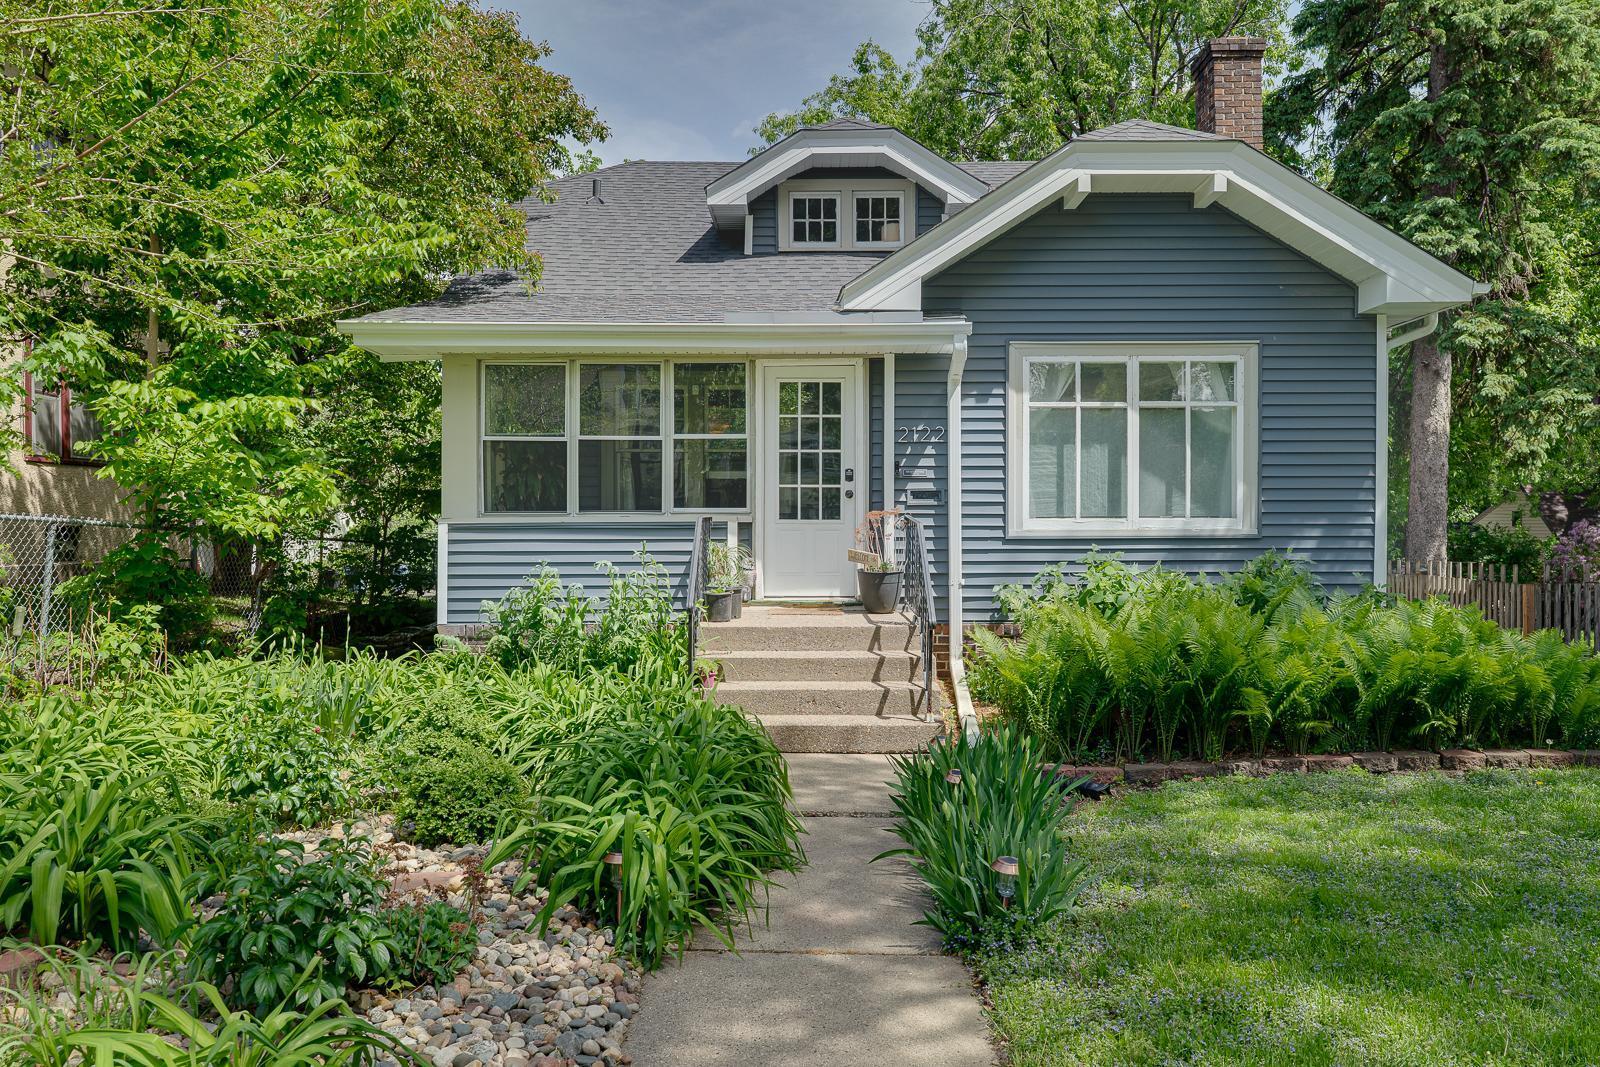
Active
$244,900
3
bds
|
1
ba
|
1,396
sqft
|
built
1924
2122 Thomas Ave N, Minneapolis, MN 55411
$-162
Cash flow
-3.5%
Cash-on-Cash Return
5.5%
Cap rate
0.8%
Rent to Value Ratio
Active
$279,900
1
bds
|
1
ba
|
455
sqft
|
built
2019
728 3rd St N, Minneapolis, MN 55401
$-993
Cash flow
-18.5%
Cash-on-Cash Return
2.0%
Cap rate
0.6%
Rent to Value Ratio
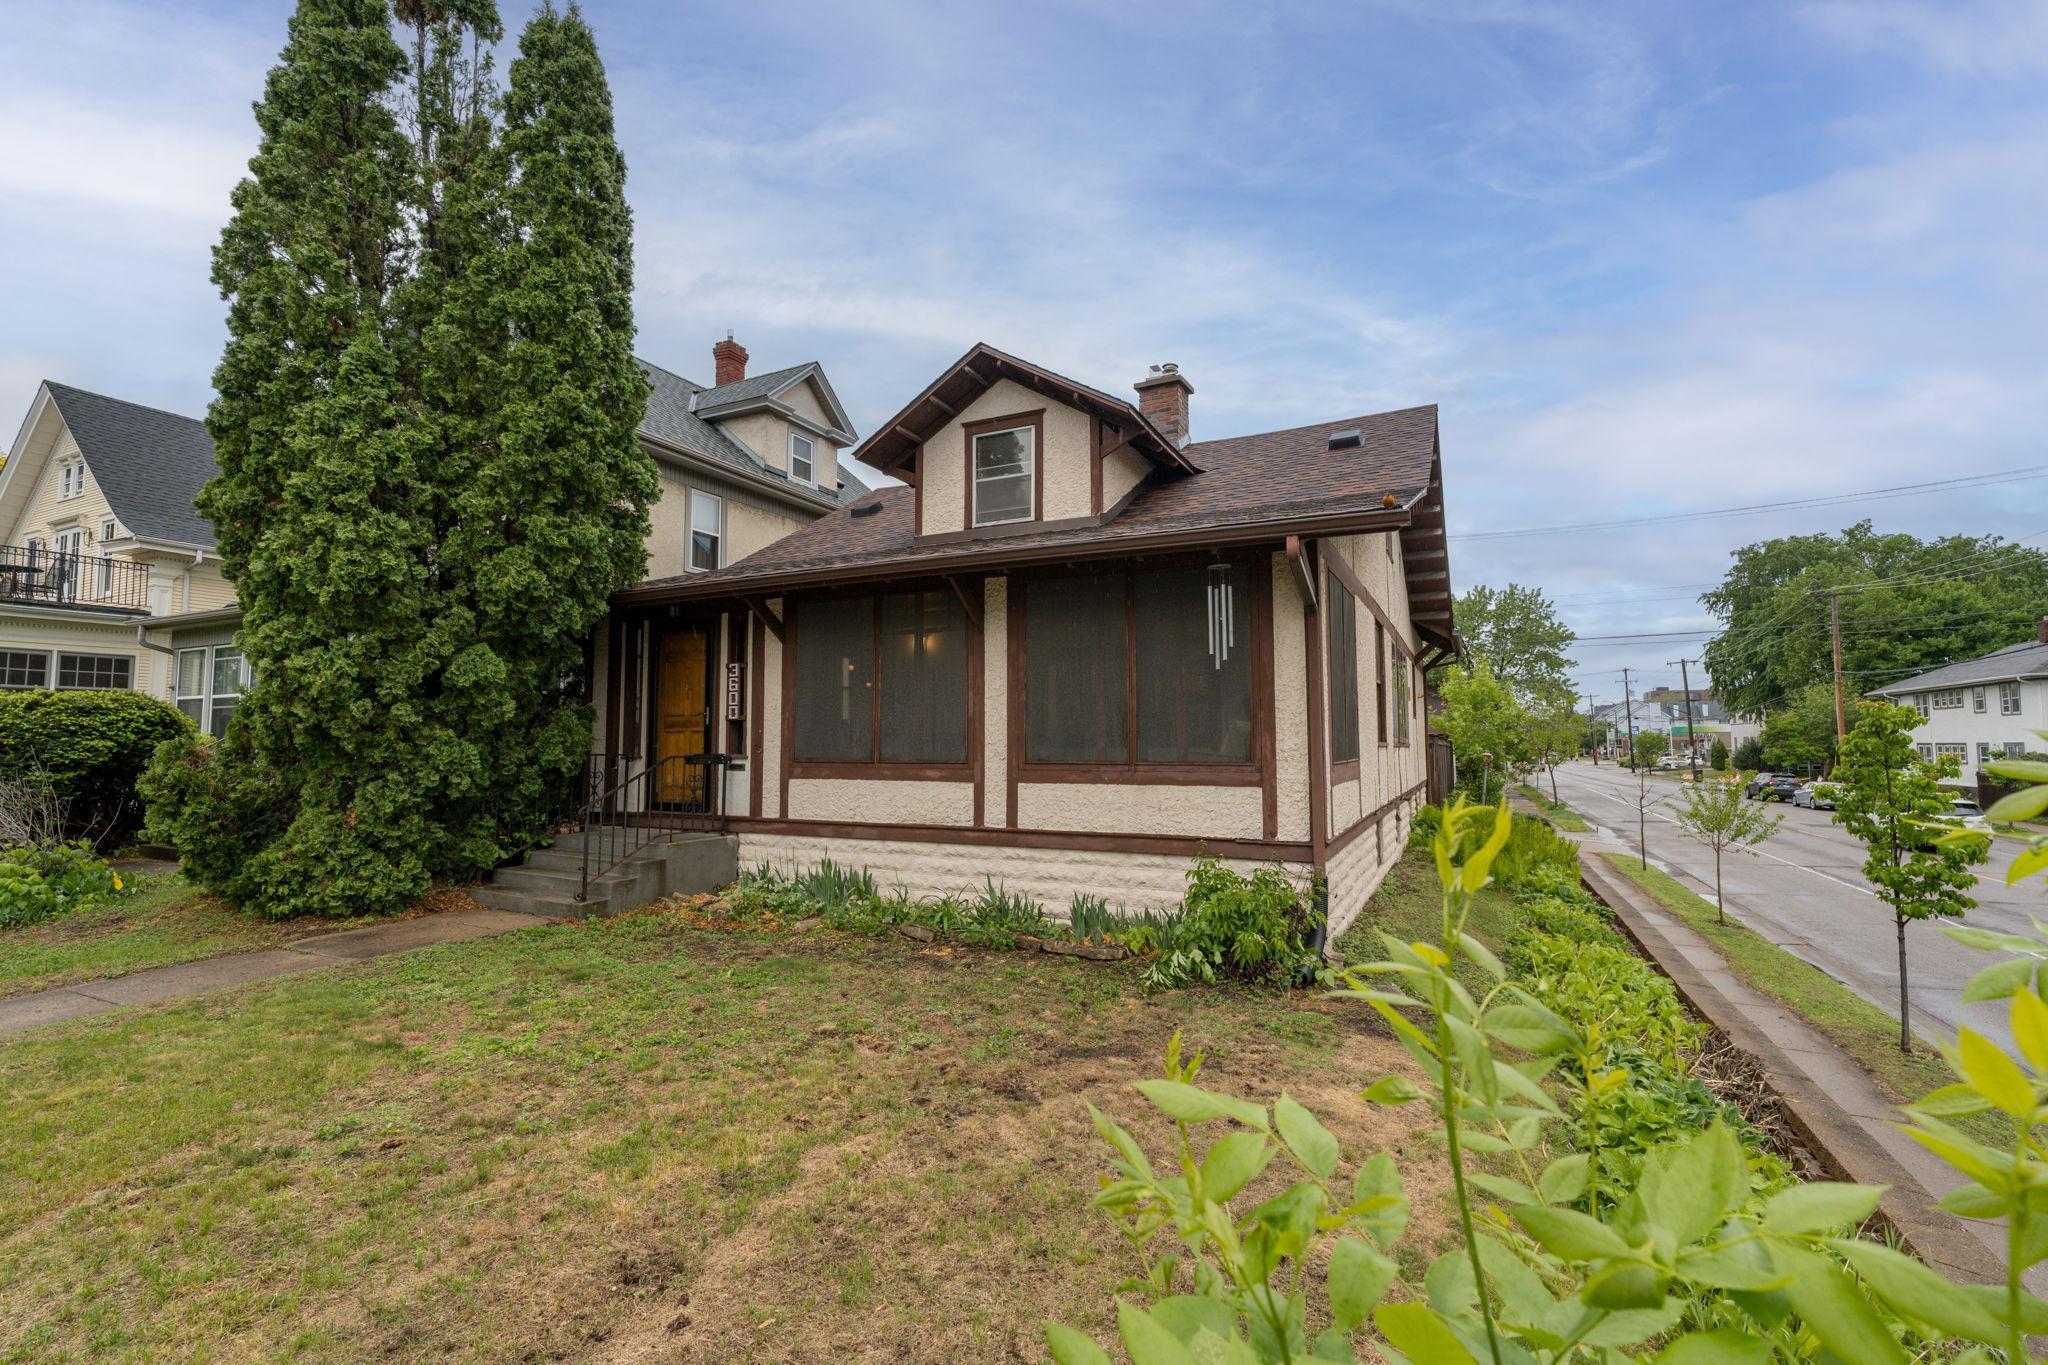
Active
$359,900
3
bds
|
2
ba
|
1,352
sqft
|
built
1910
3600 Harriet Ave, Minneapolis, MN 55409
$-491
Cash flow
-7.1%
Cash-on-Cash Return
4.6%
Cap rate
0.7%
Rent to Value Ratio

Active
$175,000
1
bds
|
1
ba
|
860
sqft
|
built
1986
1425 W 28th St, Minneapolis, MN 55408
$-858
Cash flow
-25.6%
Cash-on-Cash Return
0.4%
Cap rate
0.9%
Rent to Value Ratio

Active
$299,900
3
bds
|
2
ba
|
1,934
sqft
|
built
1917
4043 Penn Ave N, Minneapolis, MN 55412
$-464
Cash flow
-8.1%
Cash-on-Cash Return
4.4%
Cap rate
0.7%
Rent to Value Ratio
Active
$200,000
2
bds
|
1
ba
|
880
sqft
|
built
1984
138 96th Ln NE, Minneapolis, MN 55434
$-304
Cash flow
-7.9%
Cash-on-Cash Return
4.5%
Cap rate
0.8%
Rent to Value Ratio