Minneapolis, MN Investment Properties for Sale
Browse homes for sale and investment properties in Minneapolis, MN. Refine your search by price, property type, or more.
Best cash flowing properties in Minneapolis, MN
Active
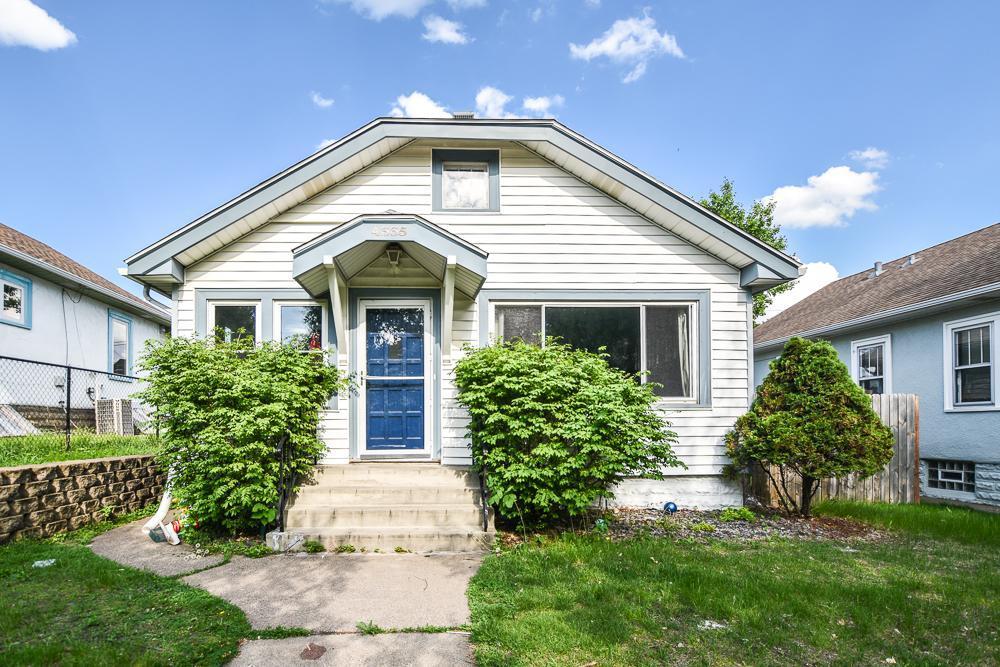
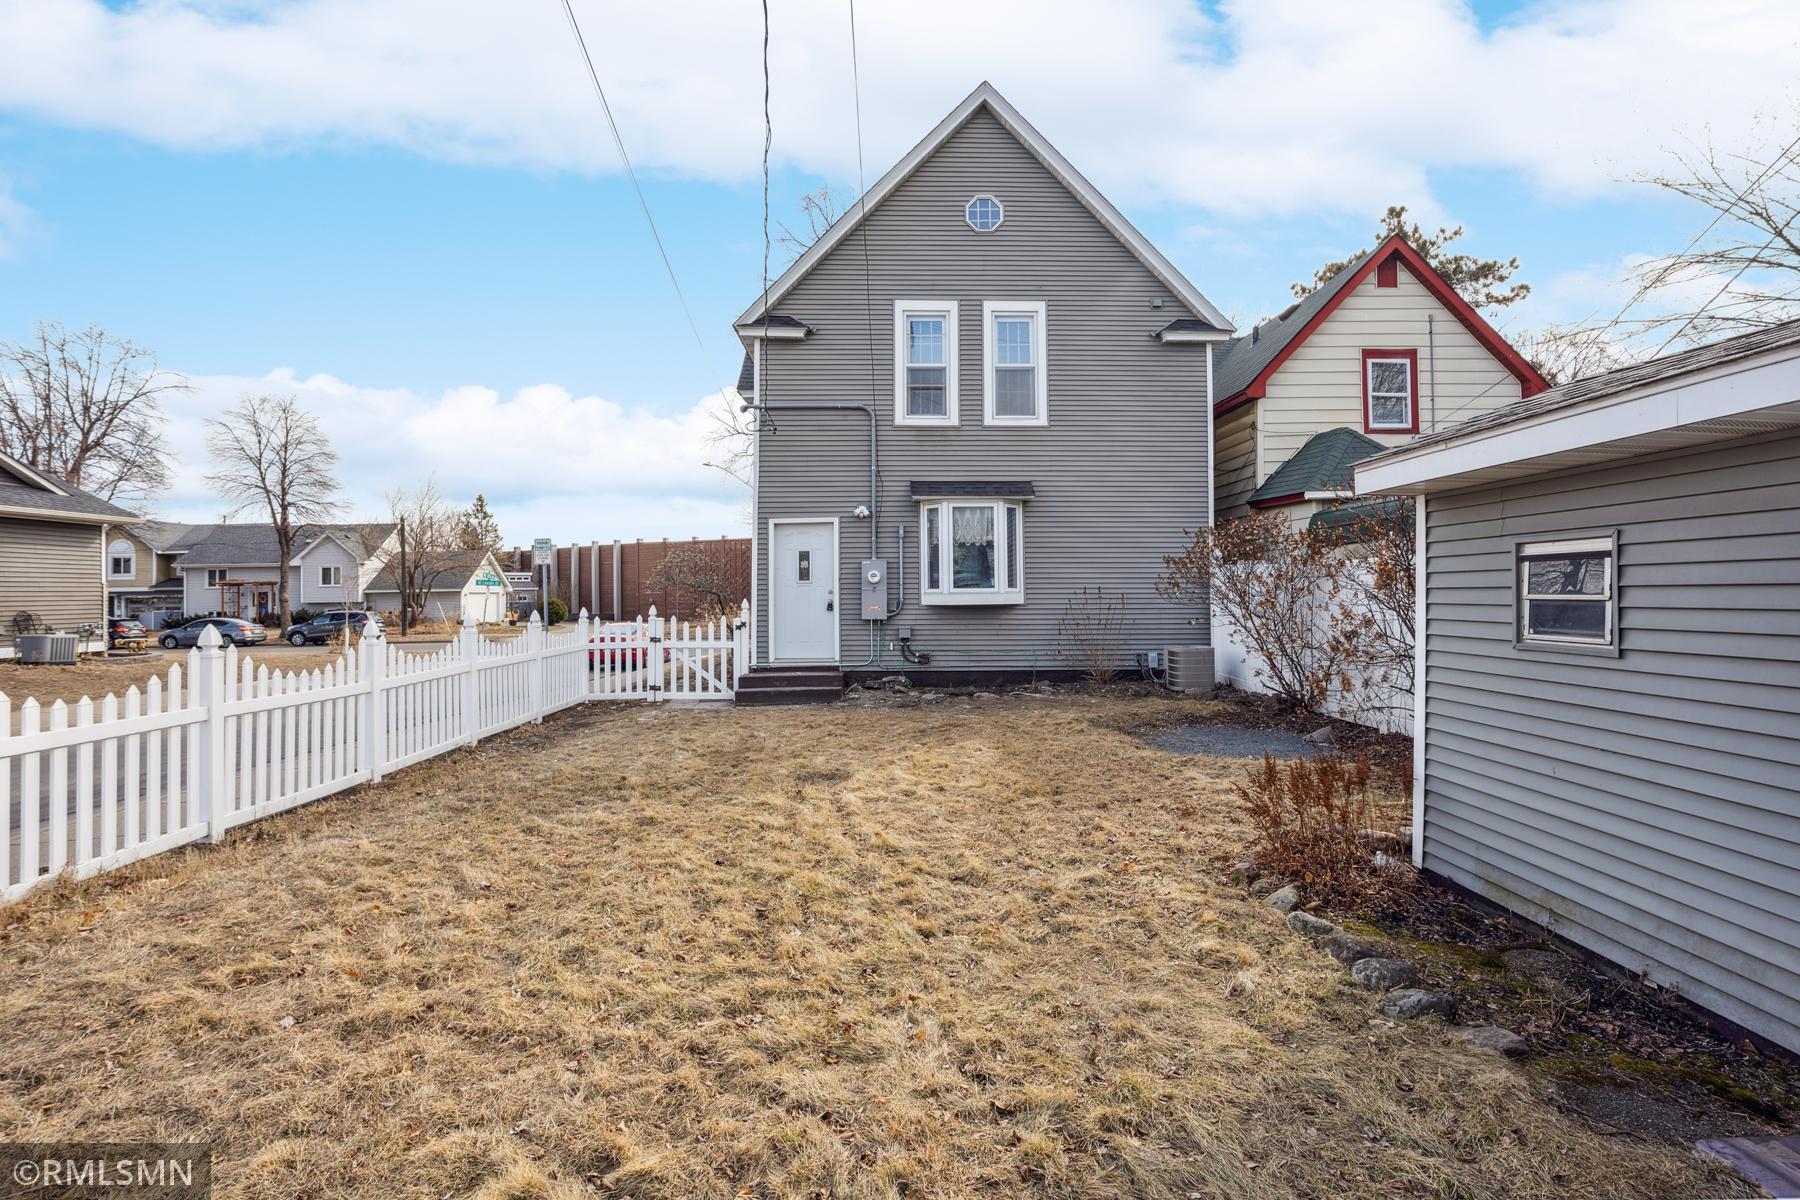
$285,000
3
bds
|
1
ba
|
1,327
sqft
|
built
1926
4335 5th Ave S, Minneapolis, MN 55409
$169
Cash flow
3.1%
Cash-on-Cash Return
6.4%
Cap rate
0.8%
Rent to Value Ratio
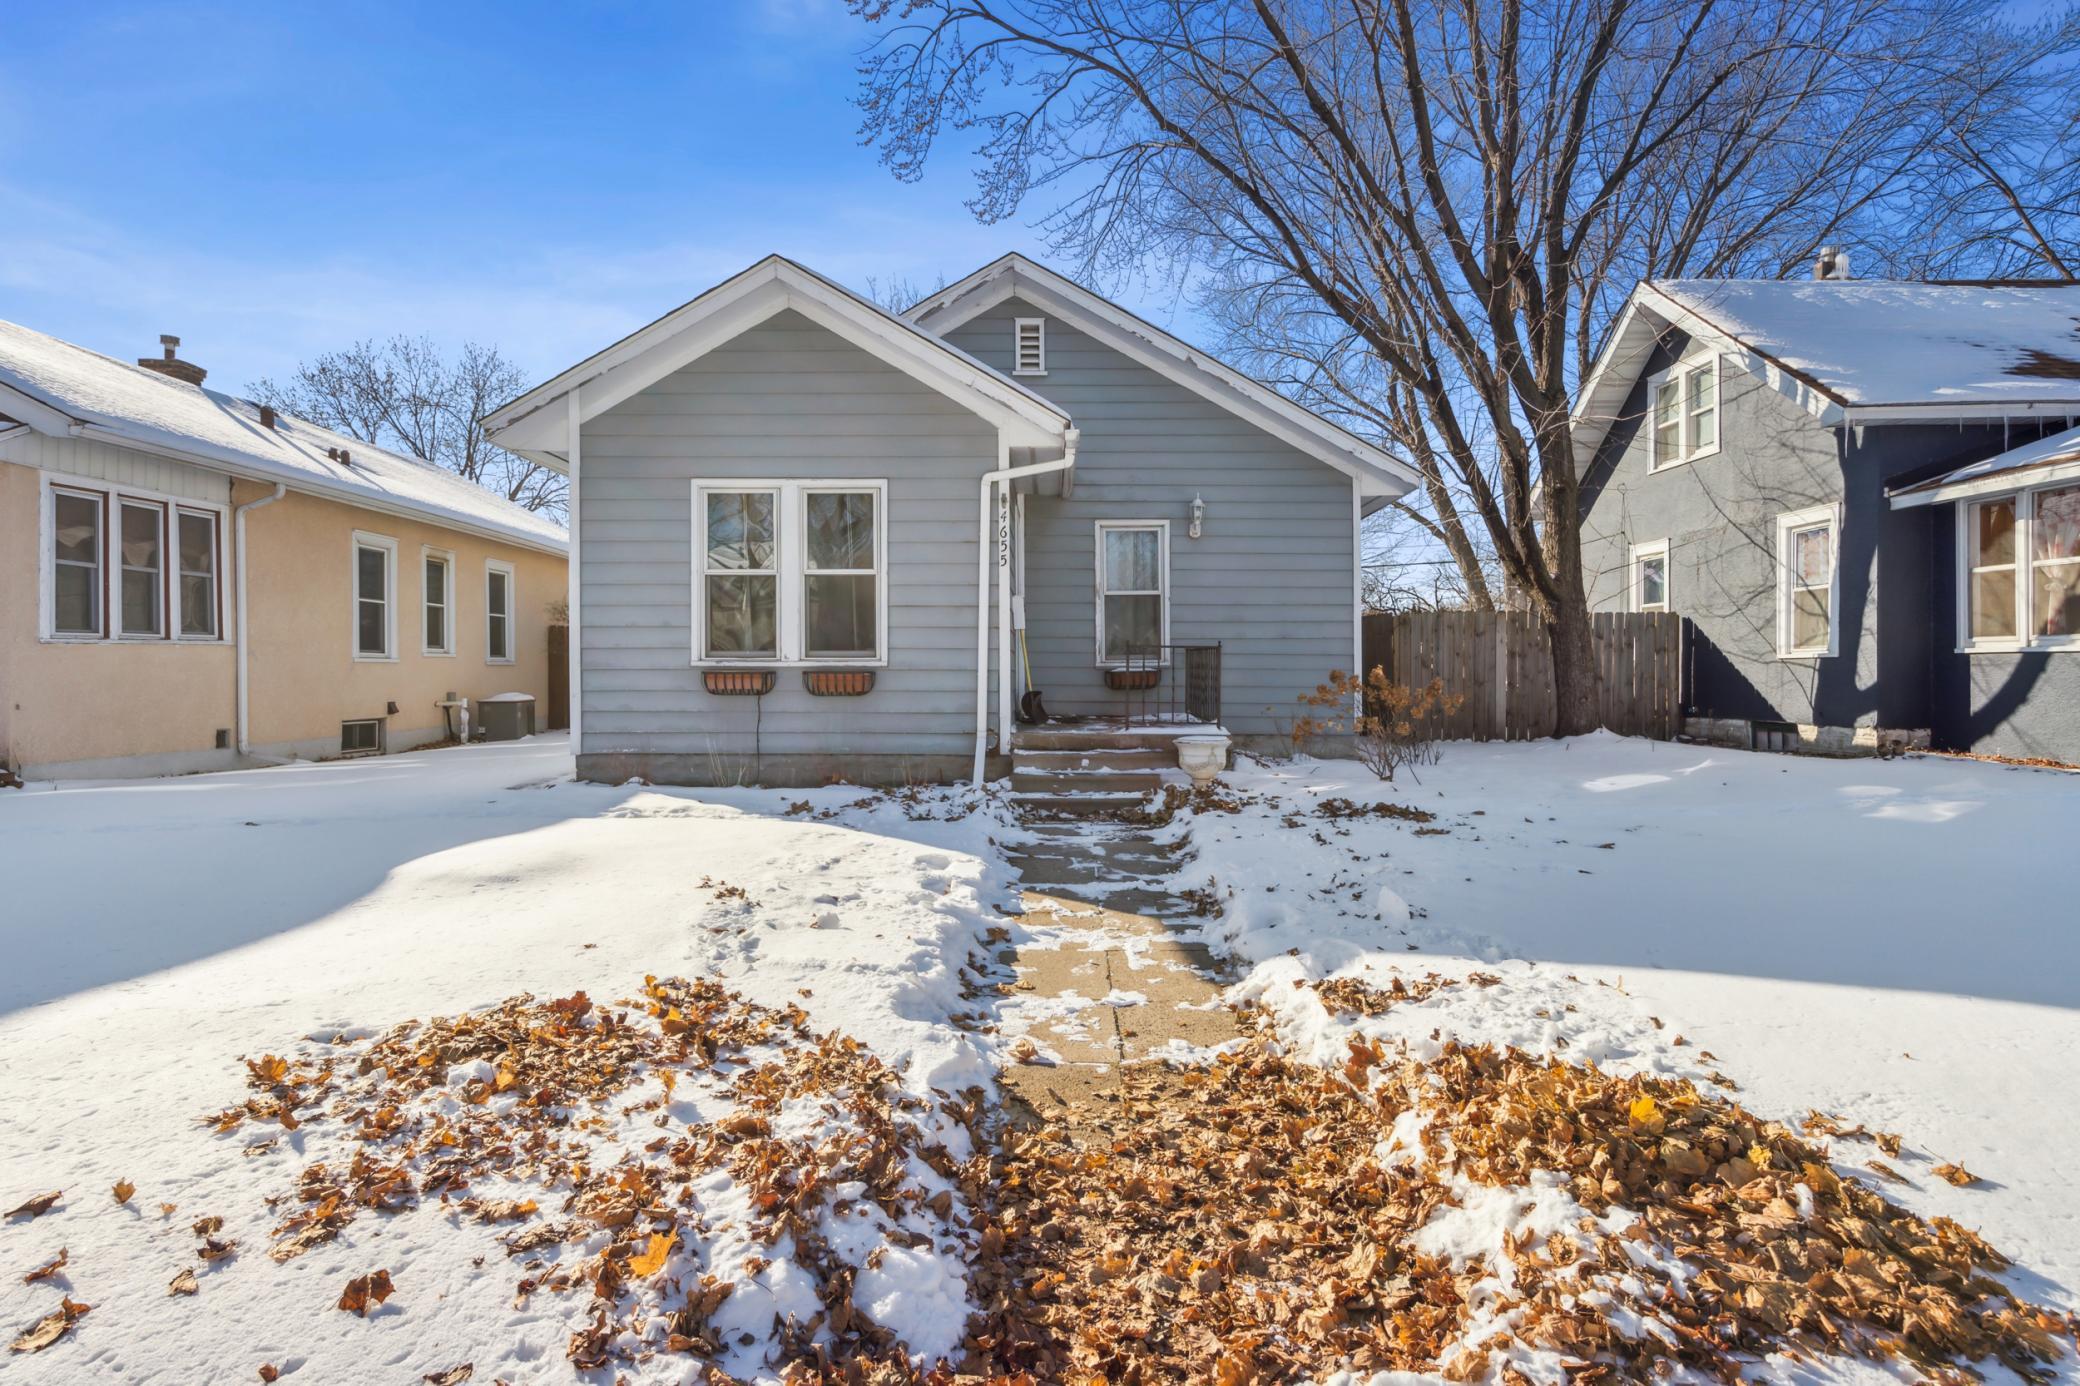
Active
$135,000
2
bds
|
1
ba
|
875
sqft
|
built
1923
4655 Emerson Ave N, Minneapolis, MN 55412
$-55
Cash flow
-2.1%
Cash-on-Cash Return
5.2%
Cap rate
1.0%
Rent to Value Ratio
1,012 out of 1,224 properties for sale in Minneapolis, MN
Limited Results Shown
Create a free account, or log in to reveal all property listings and enjoy the complete experience.
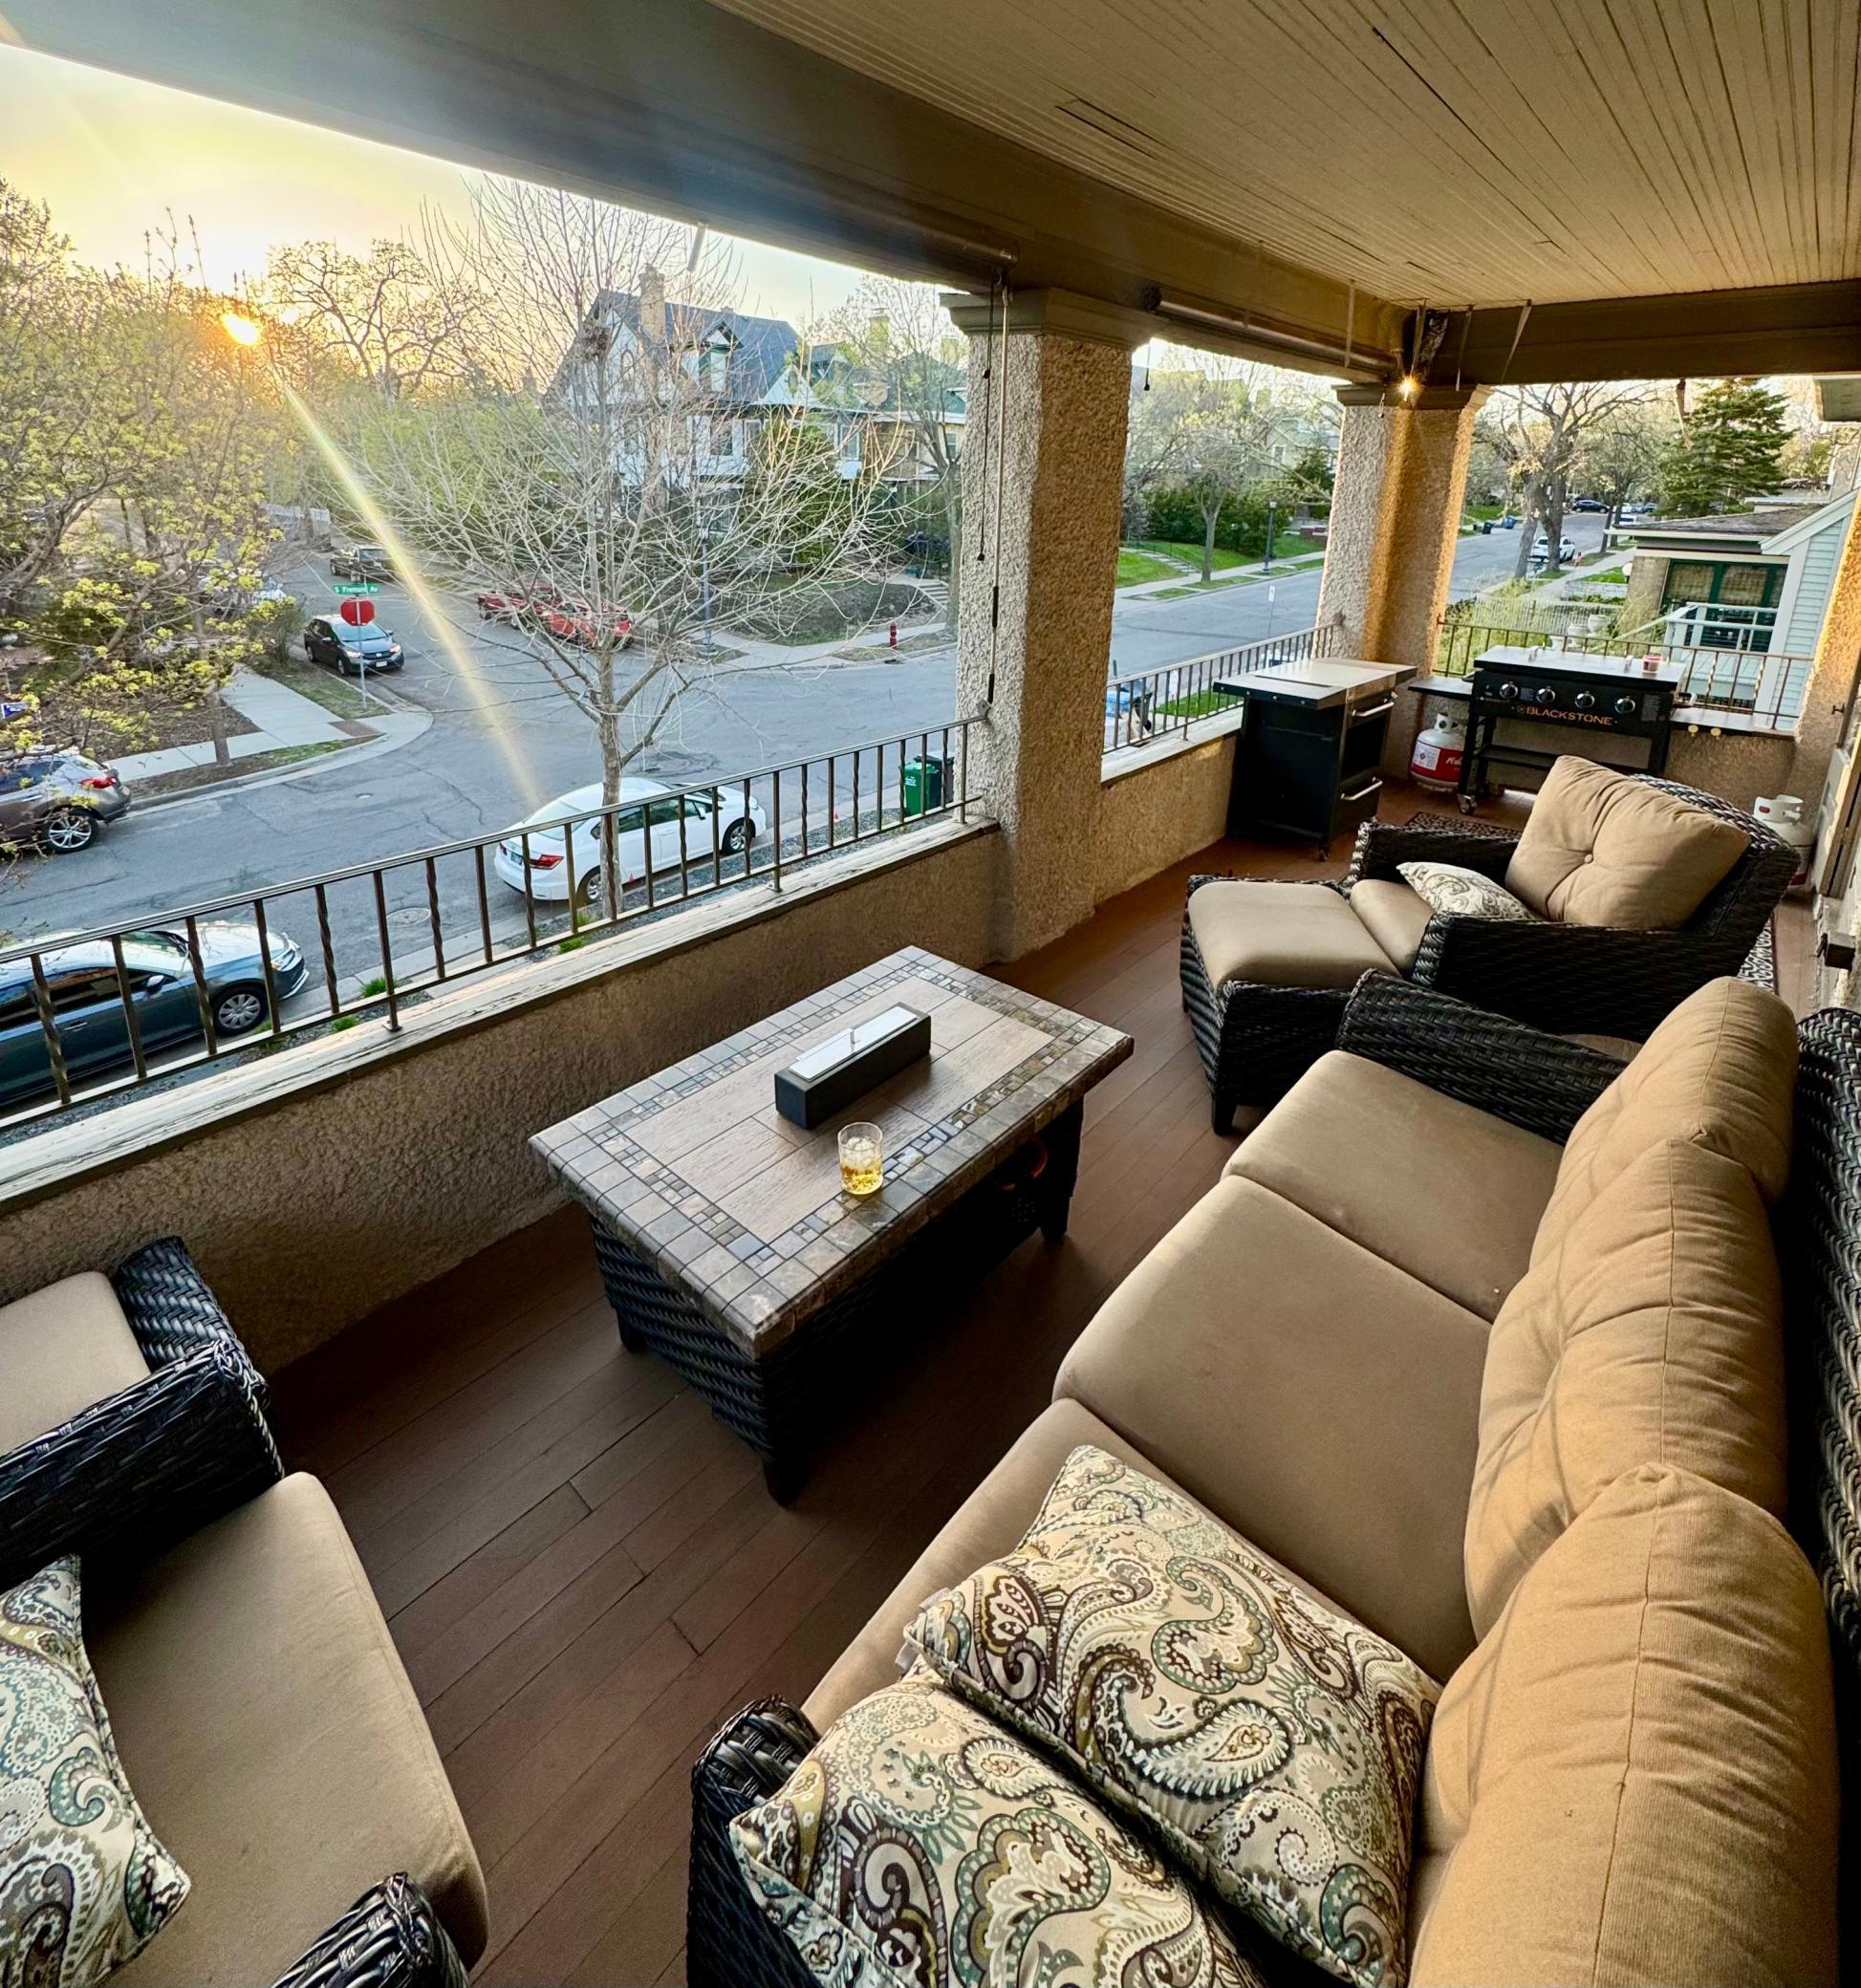
Active
$539,900
3
bds
|
2
ba
|
1,760
sqft
|
built
1909
1909 Fremont Ave S, Minneapolis, MN 55403
$-1,575
Cash flow
-15.2%
Cash-on-Cash Return
2.2%
Cap rate
0.5%
Rent to Value Ratio
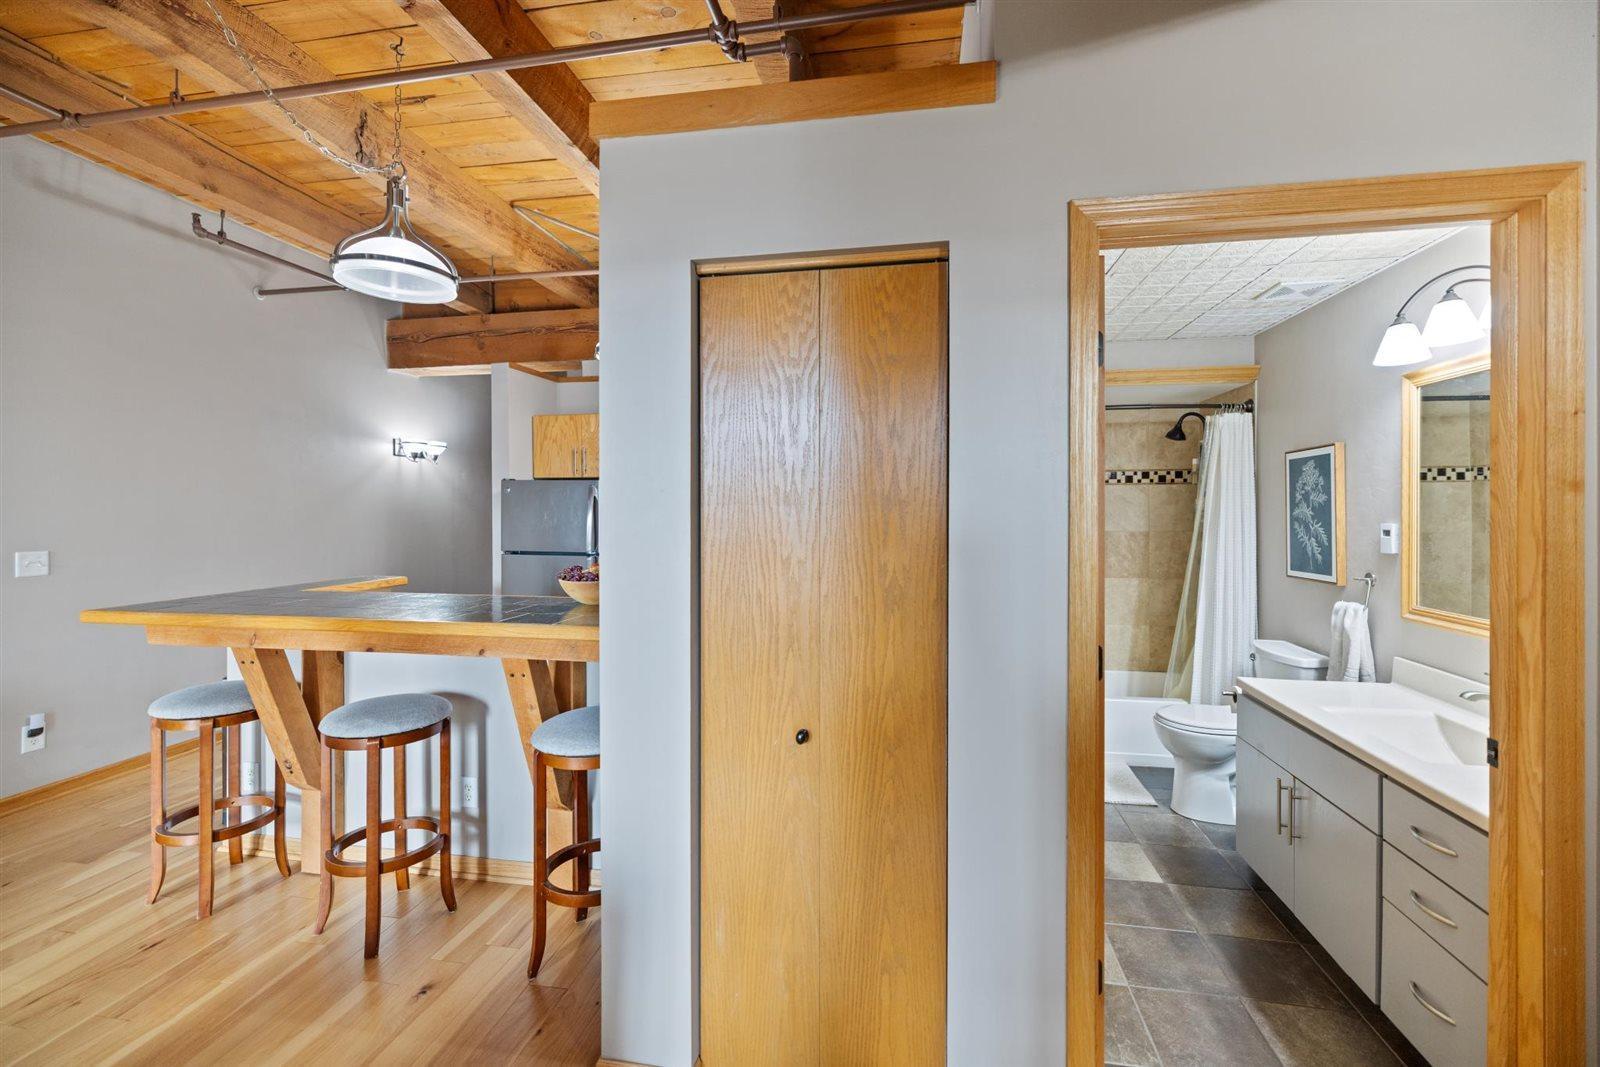
Active
$279,900
1
bds
|
1
ba
|
716
sqft
|
built
1900
400 N 1st St, Minneapolis, MN 55401
$-962
Cash flow
-17.9%
Cash-on-Cash Return
1.6%
Cap rate
0.6%
Rent to Value Ratio
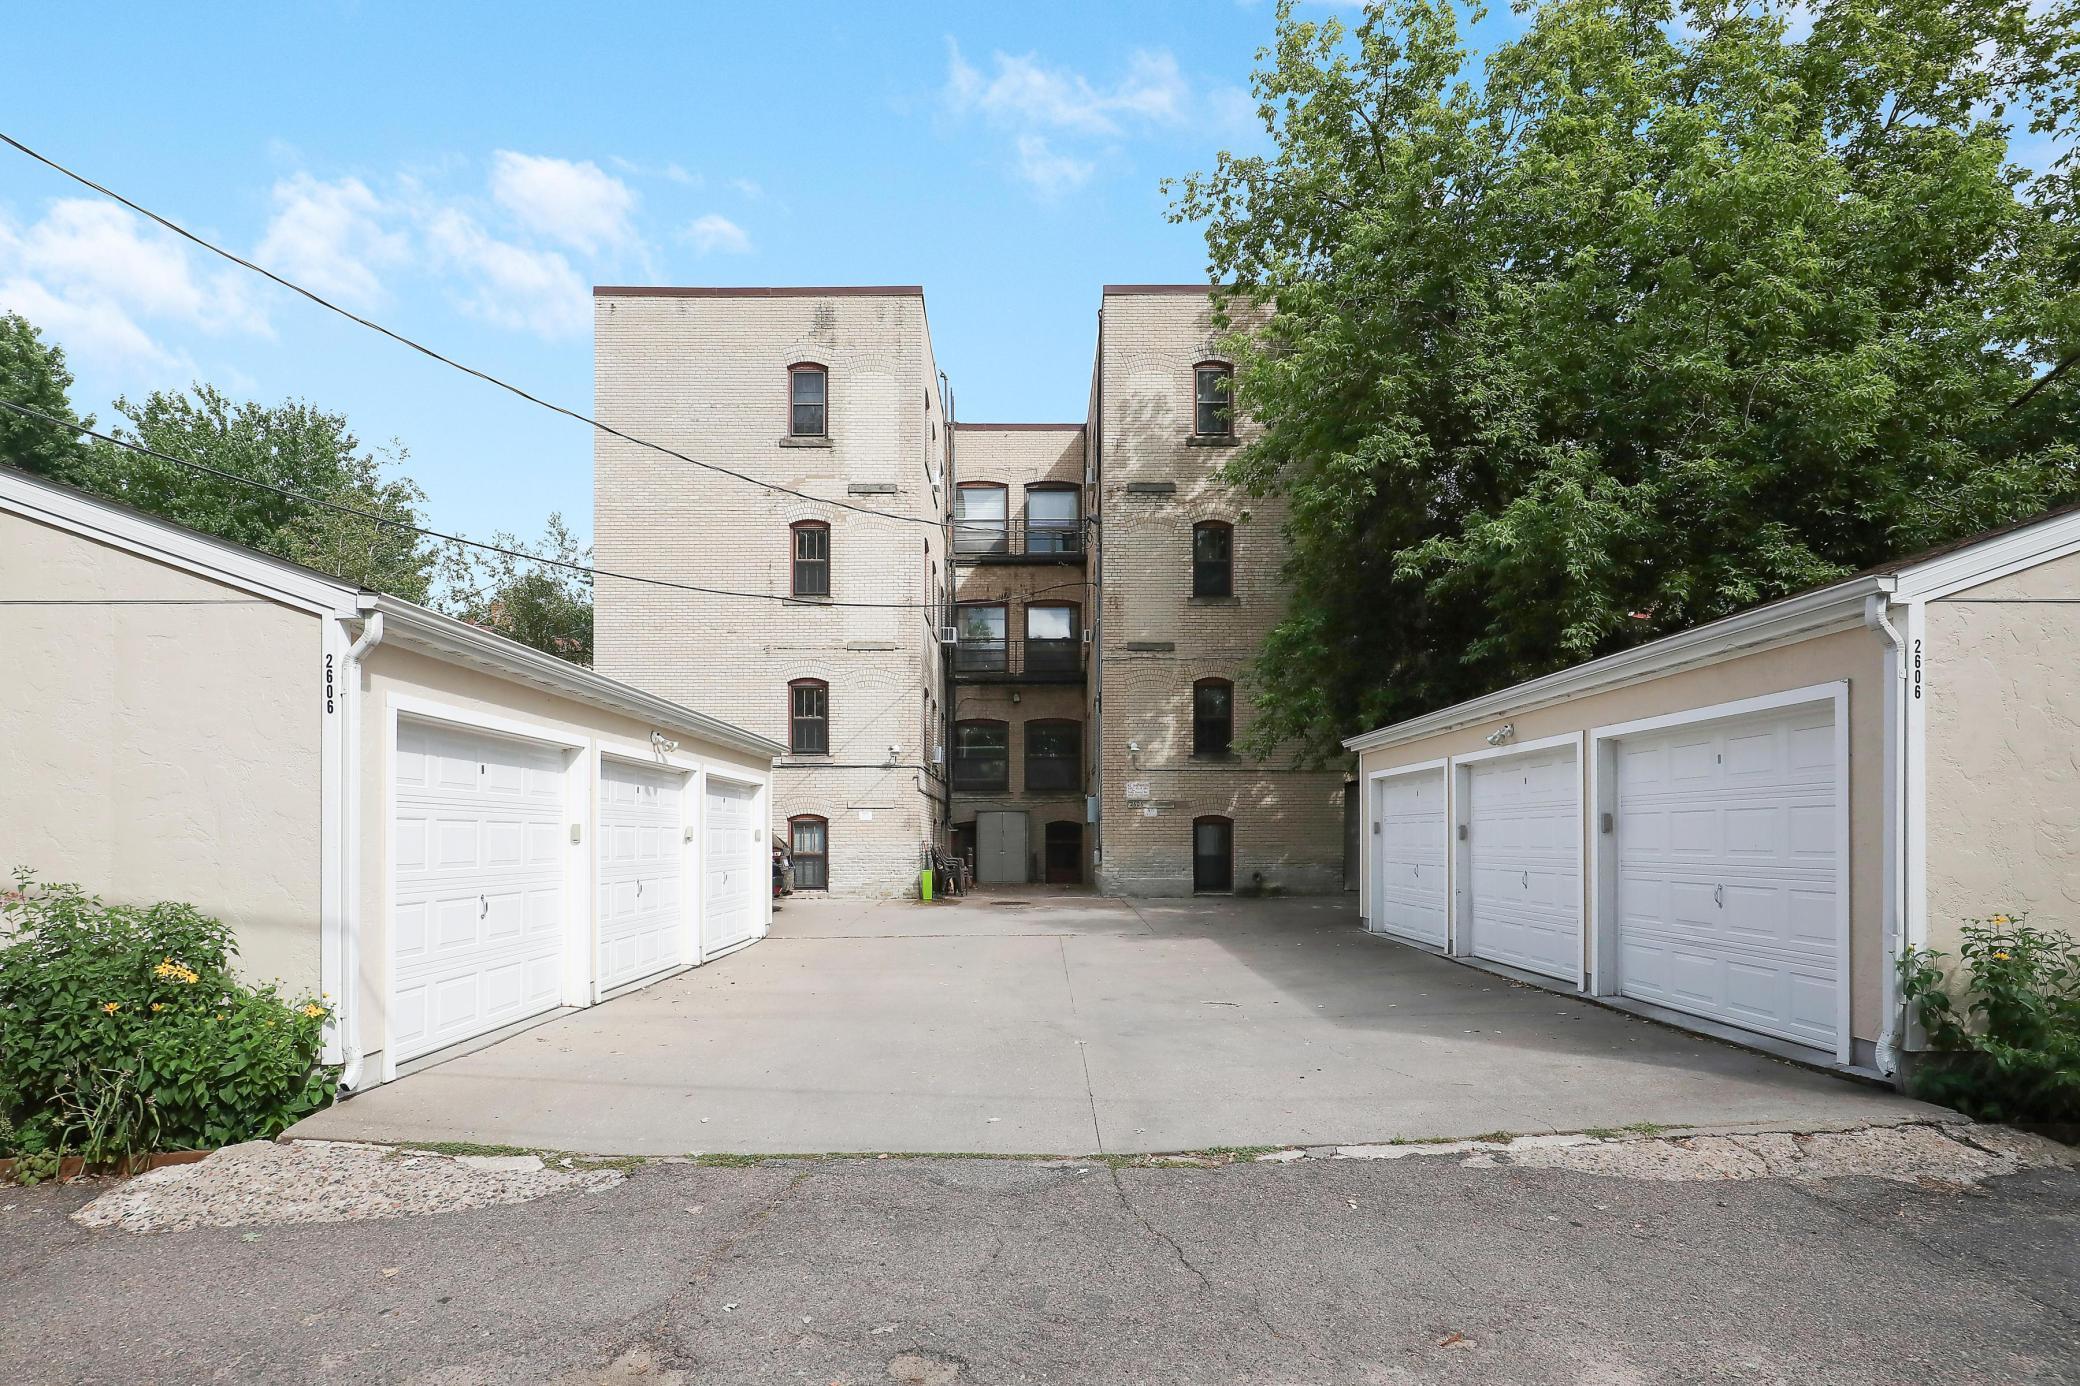
Active
$190,000
1
bds
|
1
ba
|
650
sqft
|
built
1912
2606 Humboldt Ave S, Minneapolis, MN 55408
$-513
Cash flow
-14.1%
Cash-on-Cash Return
2.4%
Cap rate
0.7%
Rent to Value Ratio
Active
$359,000
4
bds
|
2
ba
|
1,810
sqft
|
built
1900
1134 Lincoln St NE, Minneapolis, MN 55413
$-509
Cash flow
-7.4%
Cash-on-Cash Return
4.0%
Cap rate
0.6%
Rent to Value Ratio
Active
$285,000
3
bds
|
1
ba
|
1,327
sqft
|
built
1926
4335 5th Ave S, Minneapolis, MN 55409
$169
Cash flow
3.1%
Cash-on-Cash Return
6.4%
Cap rate
0.8%
Rent to Value Ratio
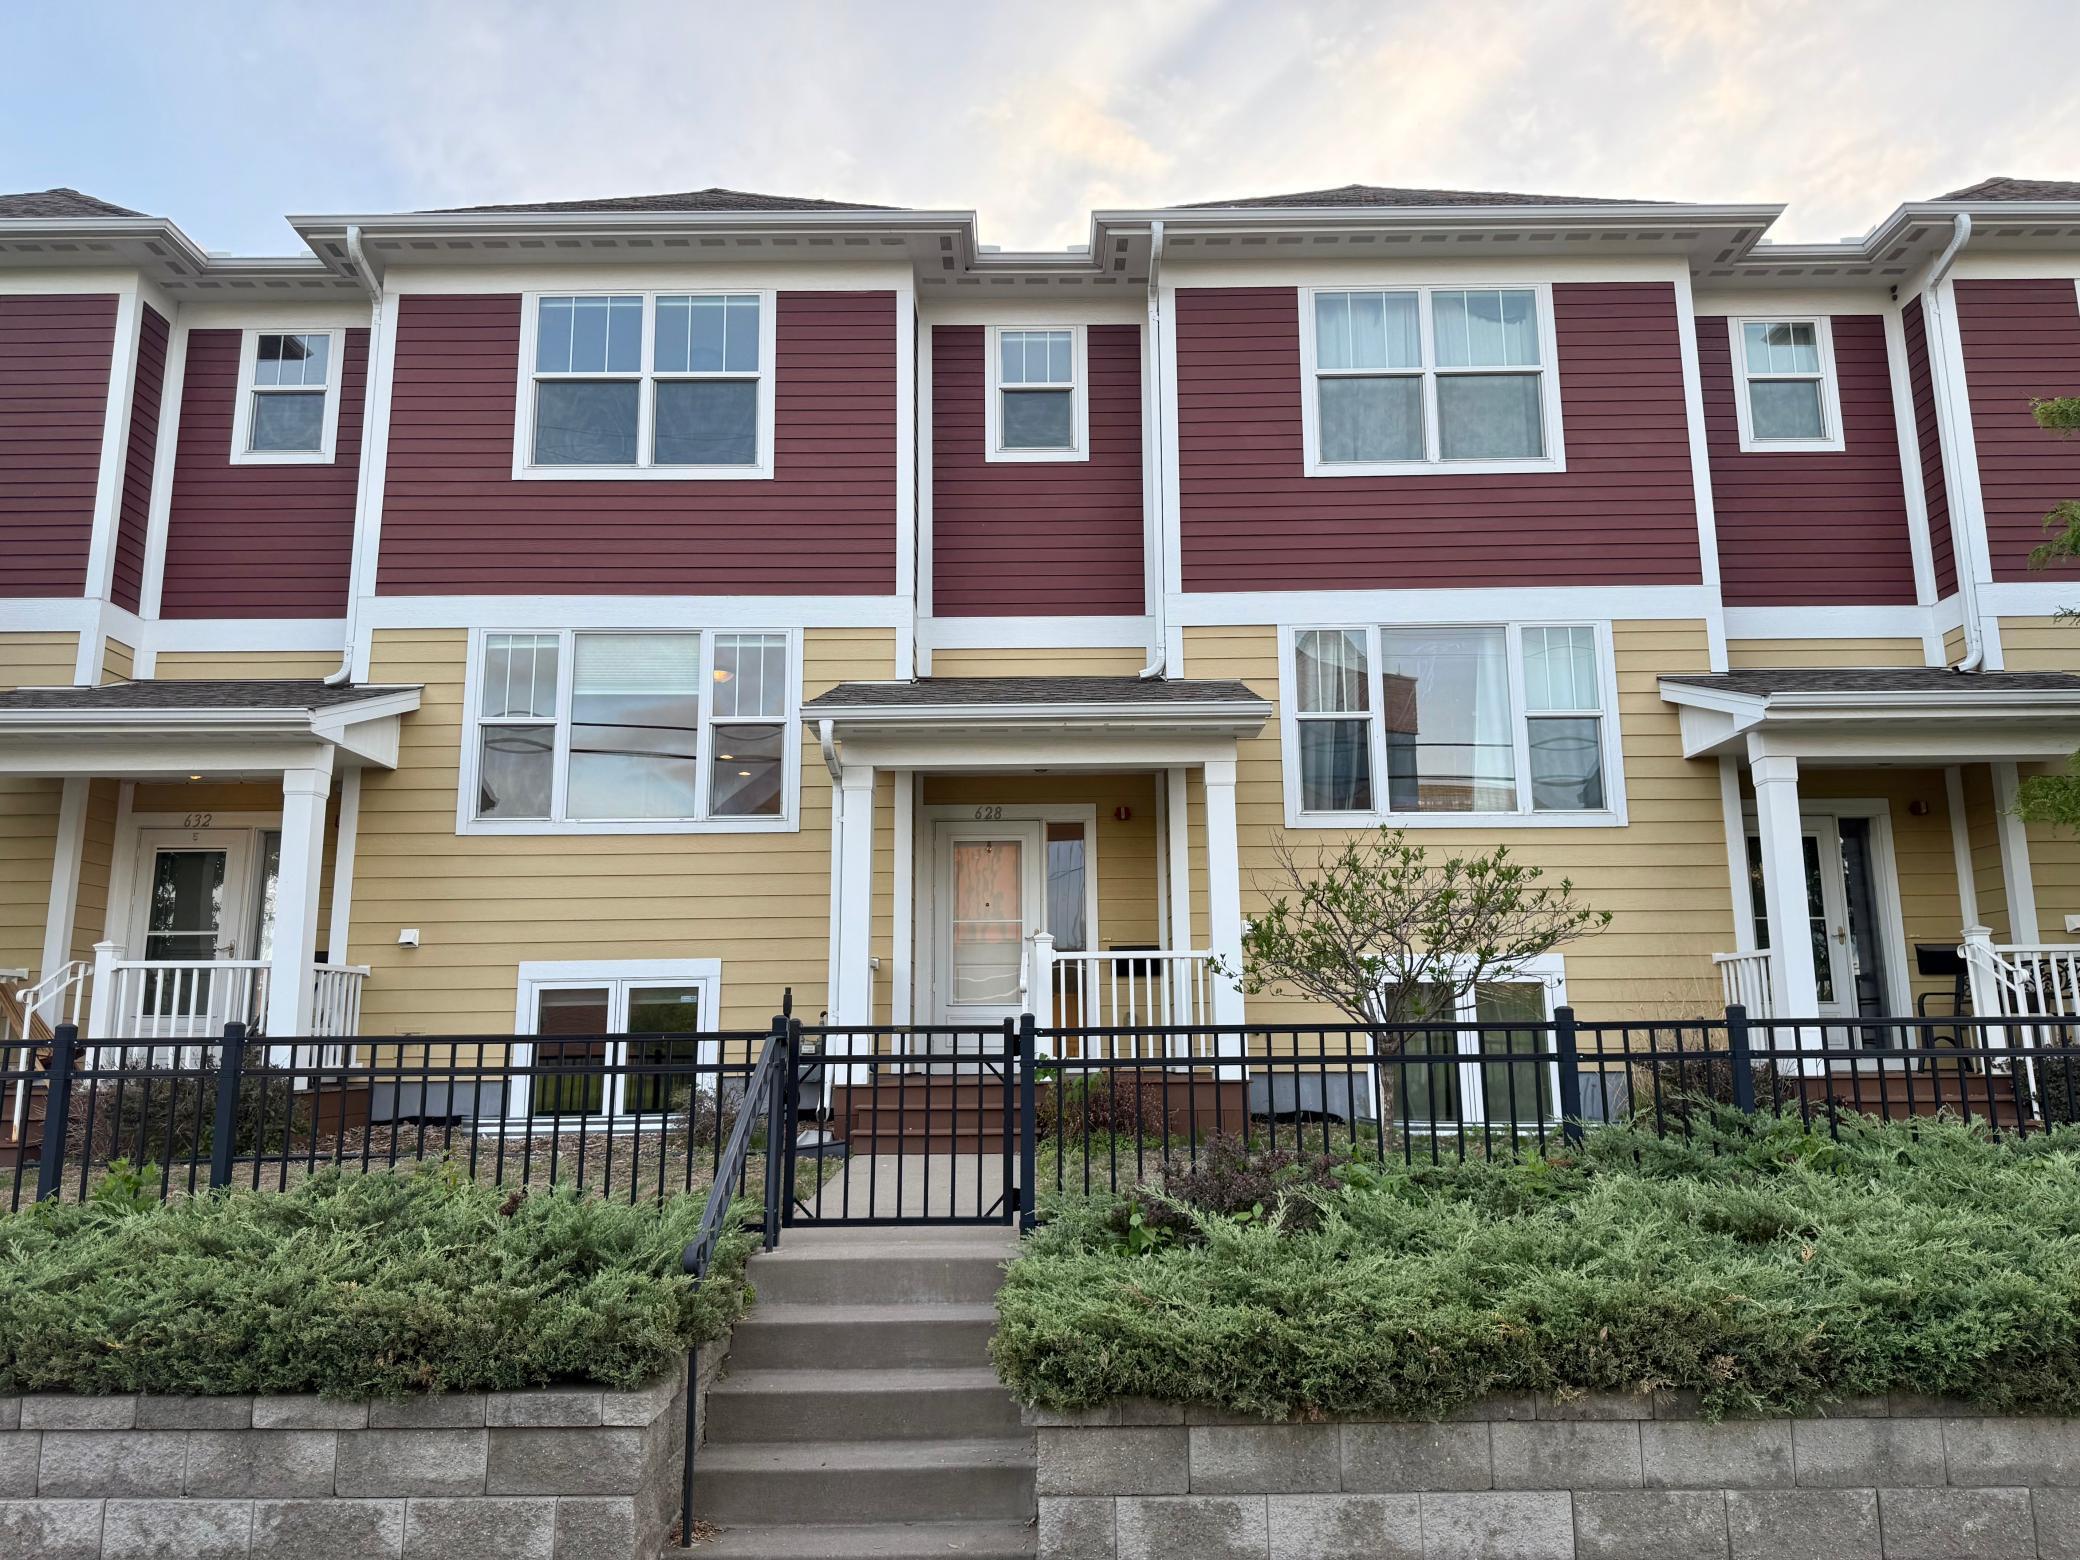
Active
$369,000
3
bds
|
4
ba
|
2,194
sqft
|
built
2015
628 20th Ave S, Minneapolis, MN 55454
$-714
Cash flow
-10.1%
Cash-on-Cash Return
3.4%
Cap rate
0.8%
Rent to Value Ratio
Active
$429,900
3
bds
|
2
ba
|
1,760
sqft
|
built
1894
3115 Harriet Ave, Minneapolis, MN 55408
$-672
Cash flow
-8.2%
Cash-on-Cash Return
3.8%
Cap rate
0.7%
Rent to Value Ratio
Active
$525,000
5
bds
|
4
ba
|
3,489
sqft
|
built
1952
3522 Benjamin St NE, Minneapolis, MN 55418
$-1,526
Cash flow
-15.2%
Cash-on-Cash Return
2.2%
Cap rate
0.4%
Rent to Value Ratio
Active
$664,900
8
bds
|
4
ba
|
4,500
sqft
|
built
1962
5116 Edgewood Ave N, Minneapolis, MN 55428
$-2,402
Cash flow
-18.8%
Cash-on-Cash Return
1.3%
Cap rate
0.3%
Rent to Value Ratio

Active
$3,495,000
4
bds
|
8
ba
|
8,323
sqft
|
built
1911
2427 E Lake Of The Isles Pkwy, Minneapolis, MN 55405
$-14,610
Cash flow
-21.8%
Cash-on-Cash Return
0.7%
Cap rate
0.3%
Rent to Value Ratio
Active
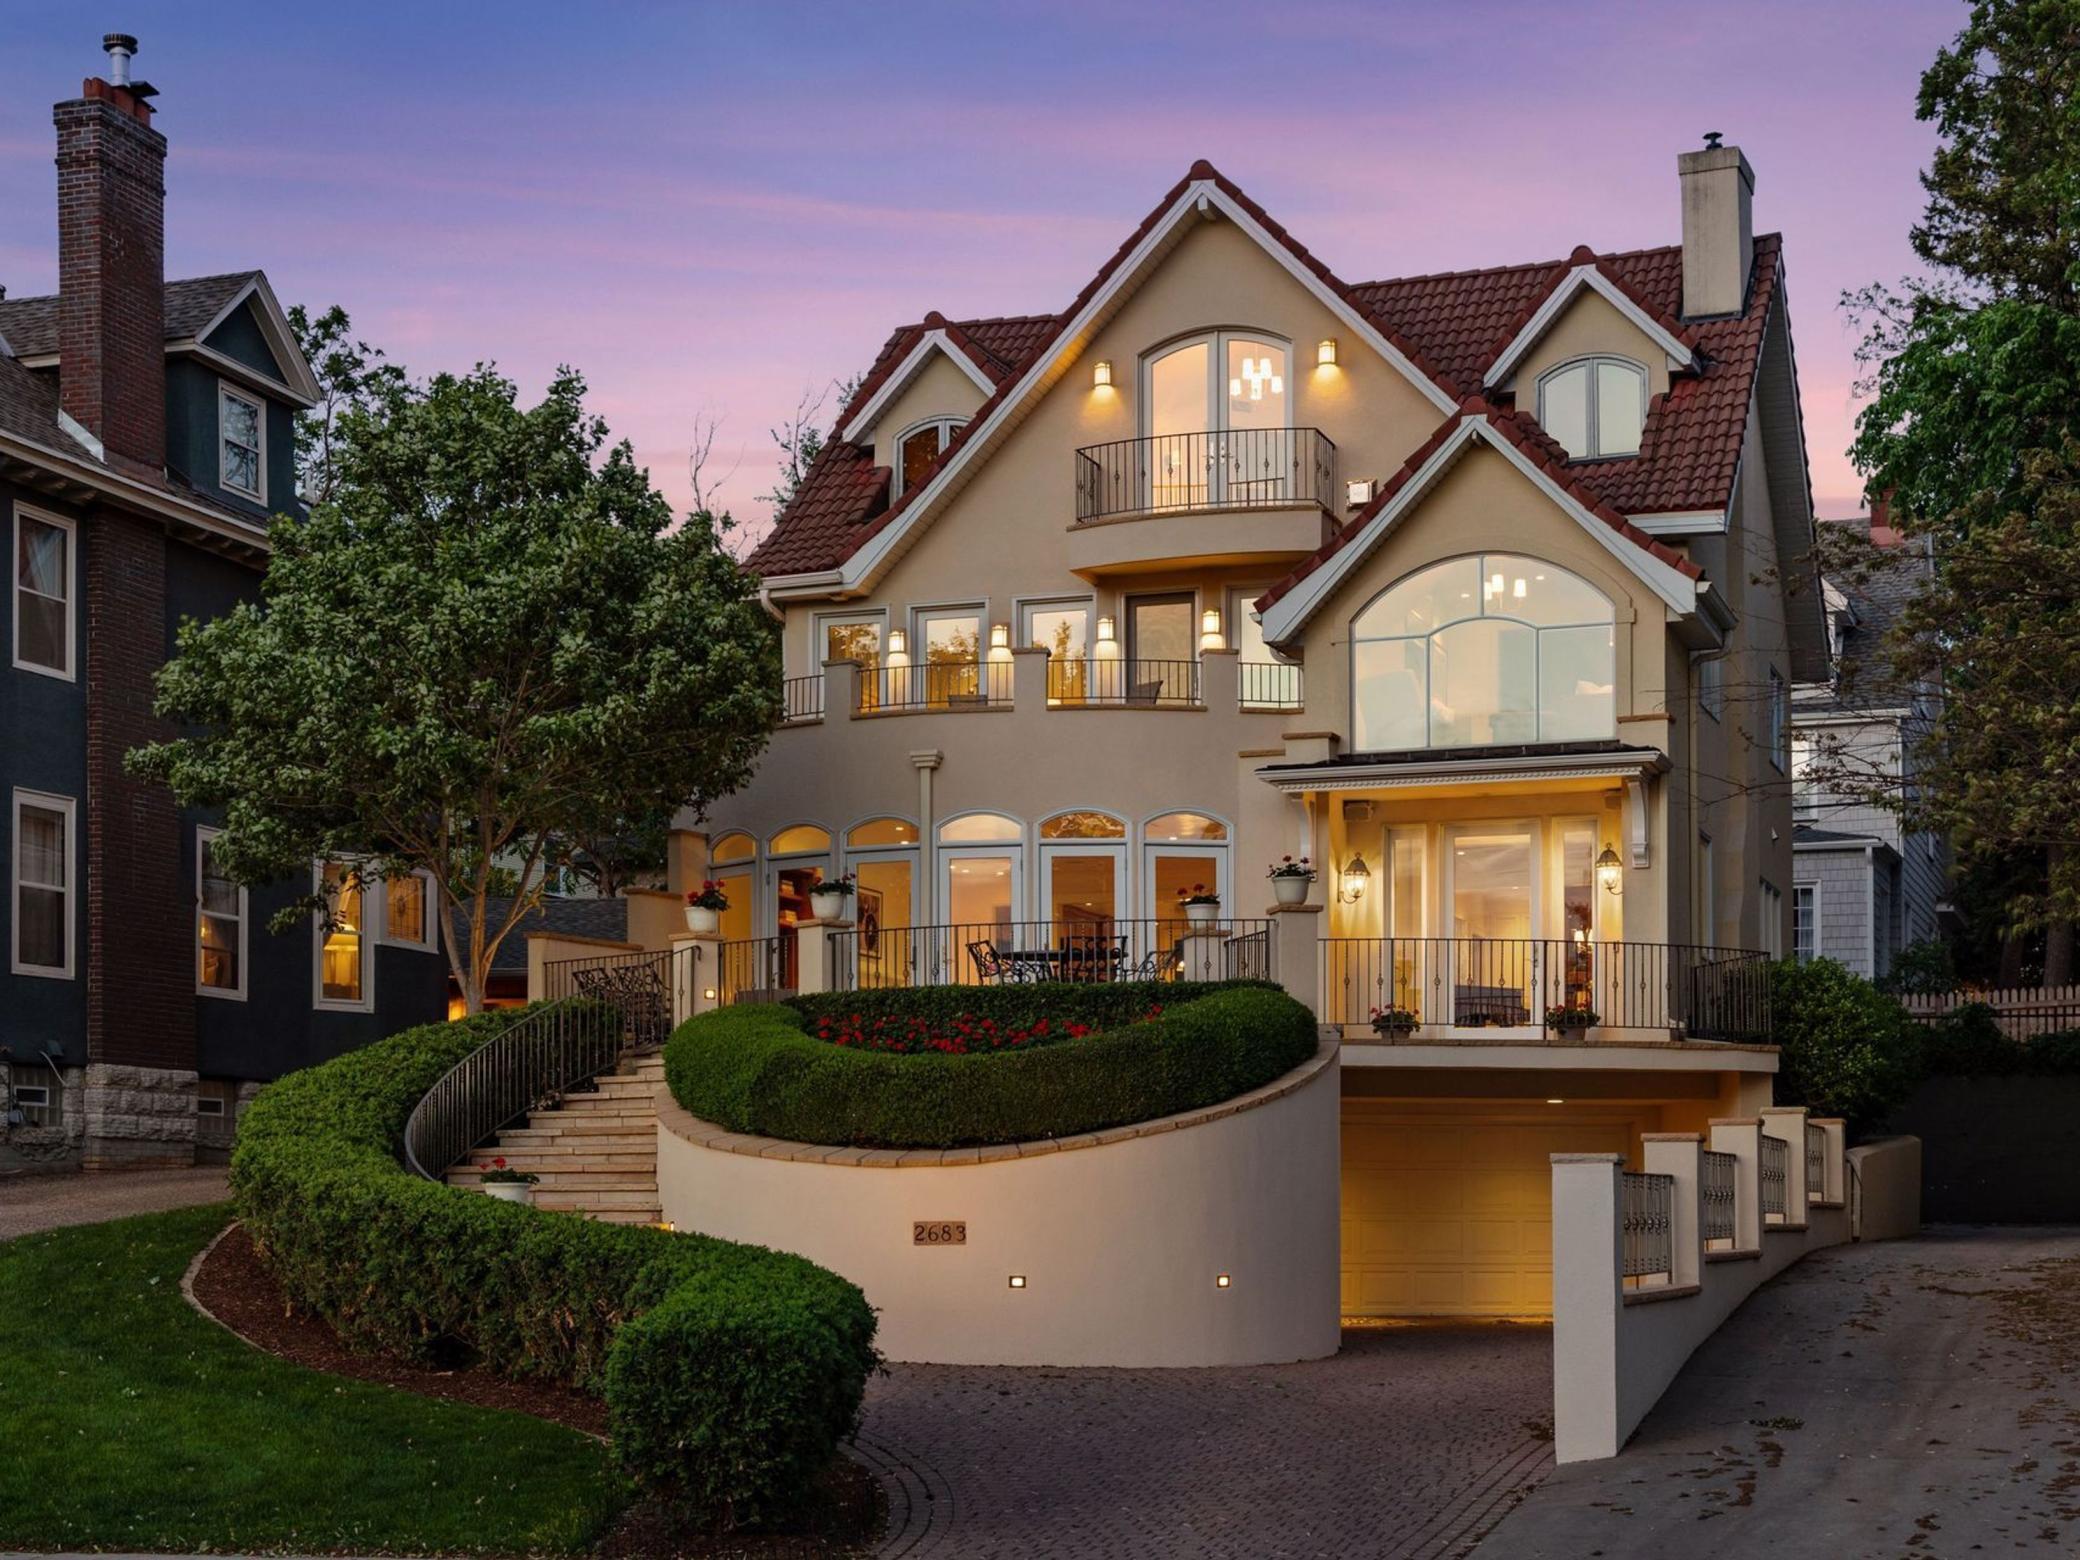
$2,375,000
3
bds
|
3
ba
|
4,033
sqft
|
built
1907
2683 E Lake Of The Isles Pkwy, Minneapolis, MN 55408
$-10,312
Cash flow
-22.7%
Cash-on-Cash Return
0.5%
Cap rate
0.2%
Rent to Value Ratio
Active
$649,000
8
bds
|
4
ba
|
4,920
sqft
|
built
1909
822 W 35th St, Minneapolis, MN 55408
$-2,204
Cash flow
-17.7%
Cash-on-Cash Return
1.6%
Cap rate
0.4%
Rent to Value Ratio
Active
$700,000
2
bds
|
2
ba
|
978
sqft
|
built
2019
728 3rd St N, Minneapolis, MN 55401
$-2,184
Cash flow
-16.3%
Cash-on-Cash Return
1.9%
Cap rate
0.5%
Rent to Value Ratio
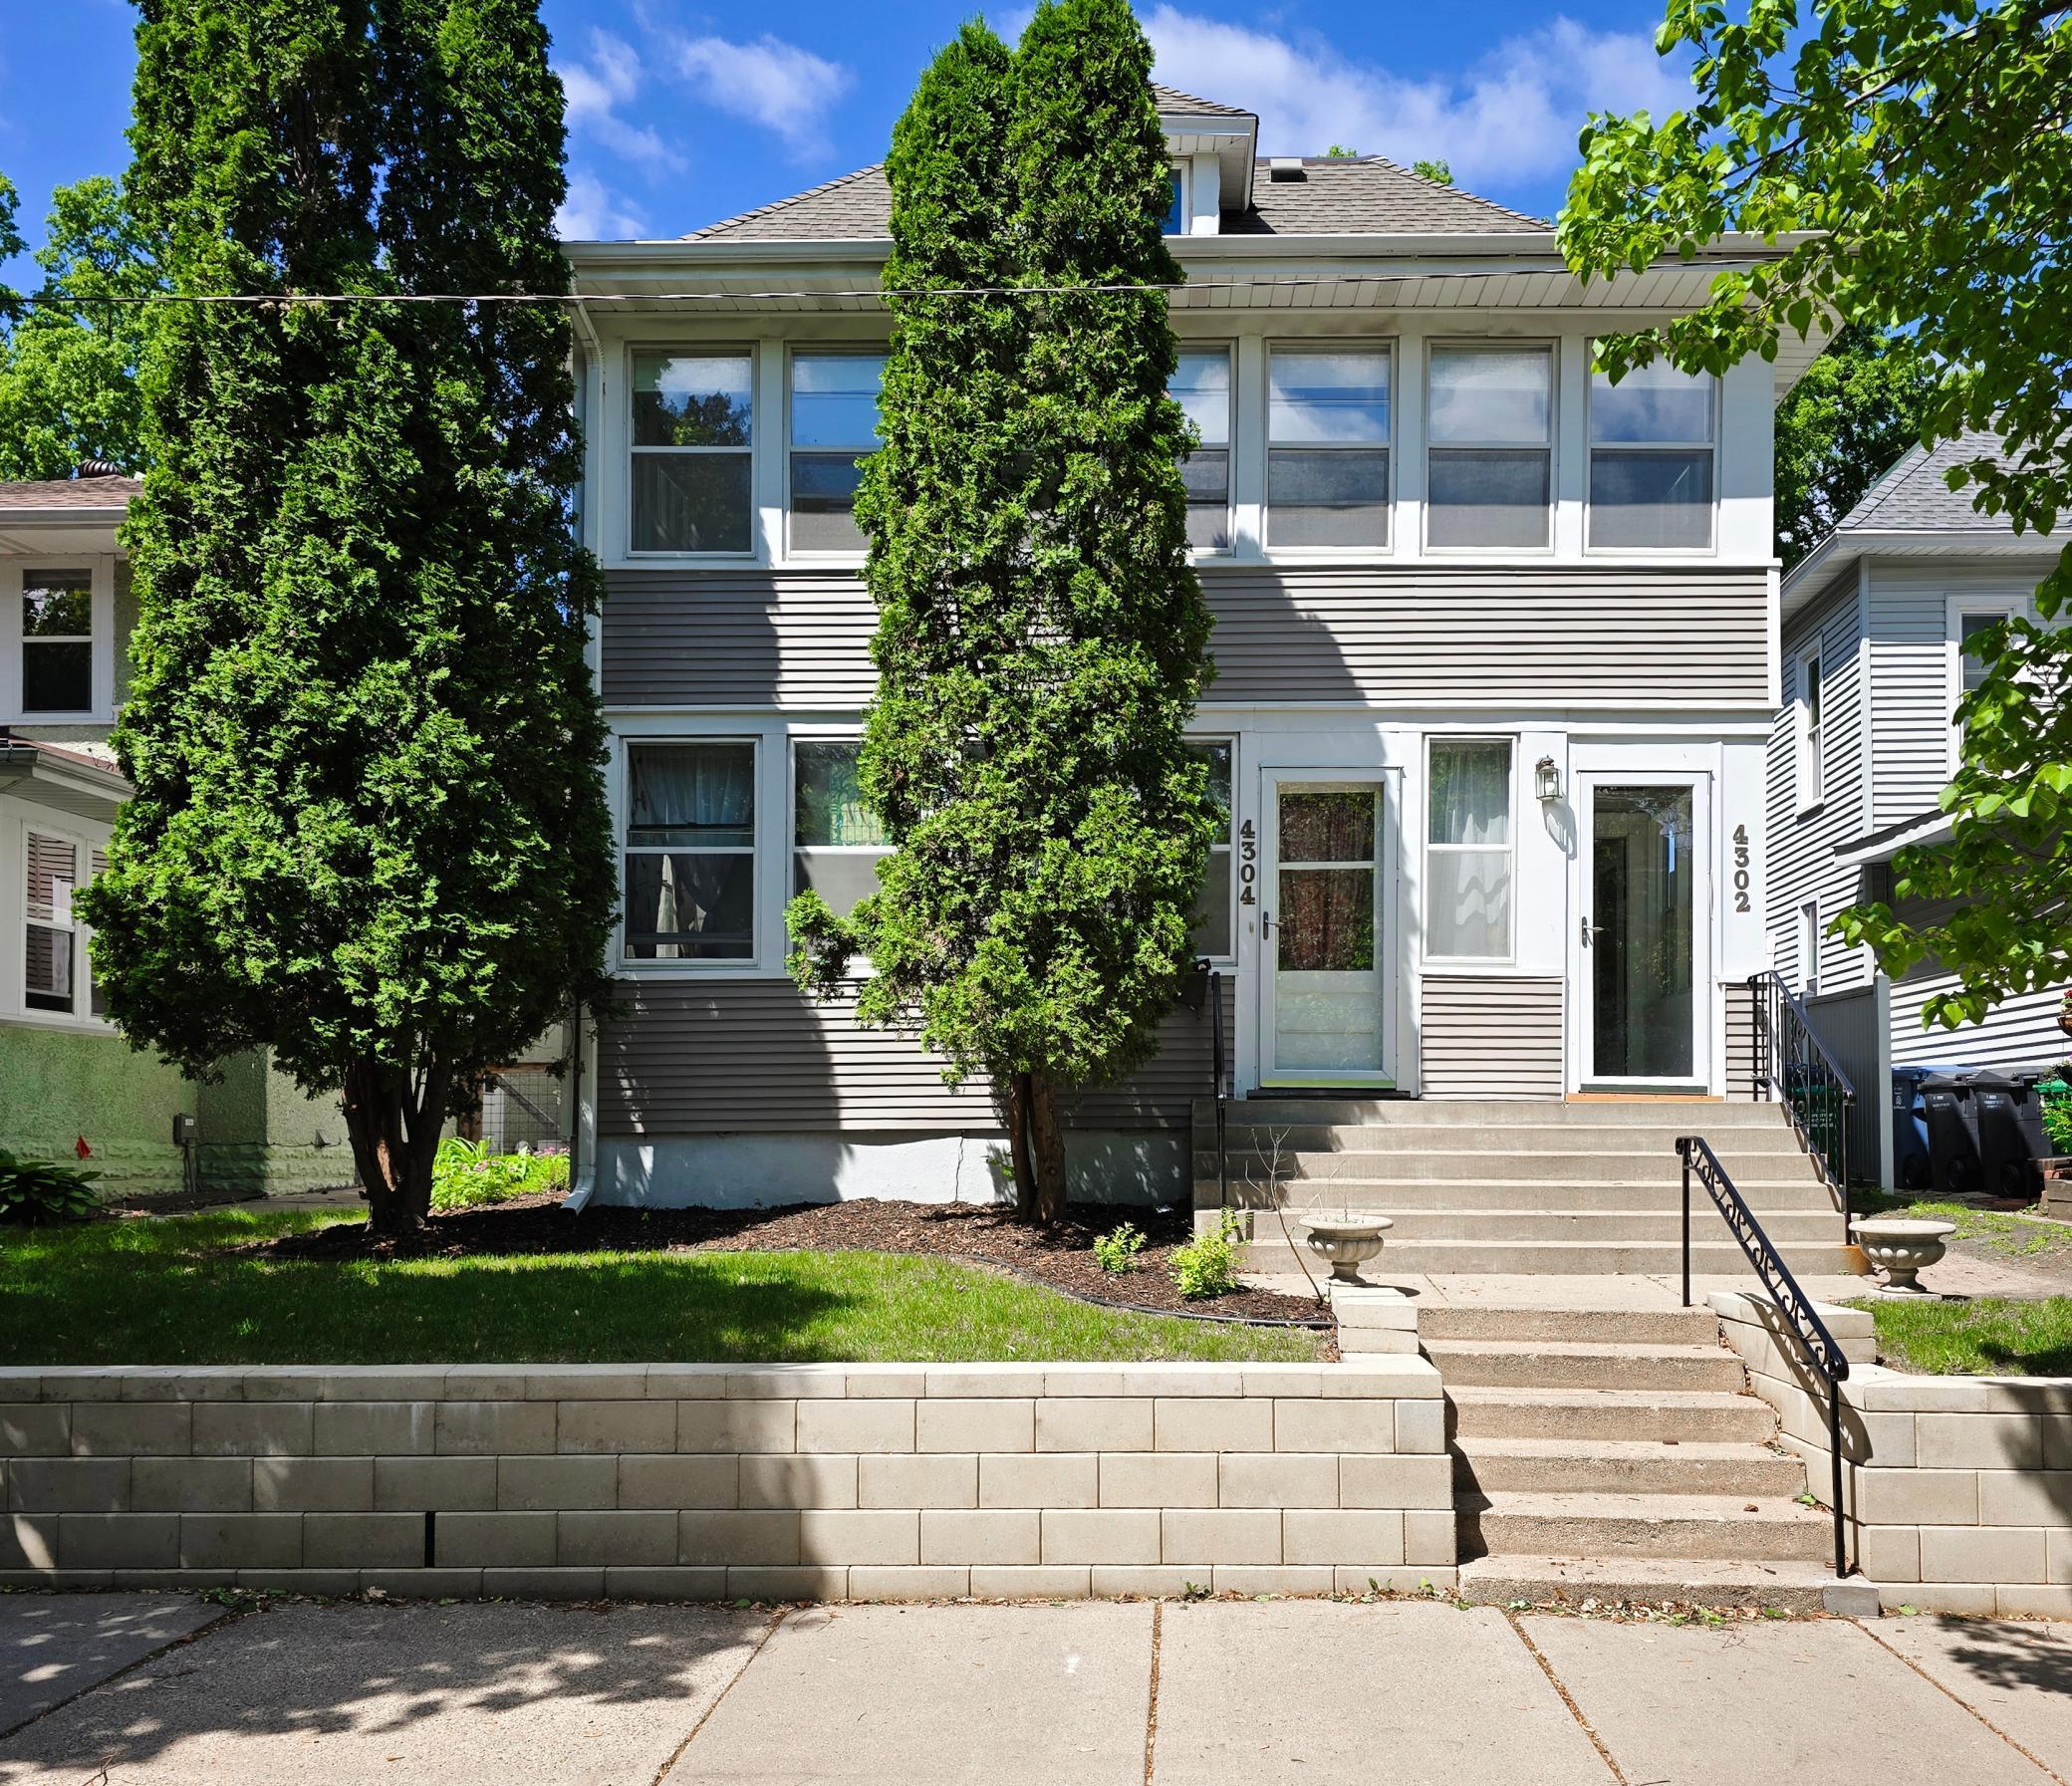
Active
$519,000
4
bds
|
2
ba
|
2,370
sqft
|
built
1900
4304 Colfax Ave S, Minneapolis, MN 55409
$-1,712
Cash flow
-17.2%
Cash-on-Cash Return
1.7%
Cap rate
0.4%
Rent to Value Ratio
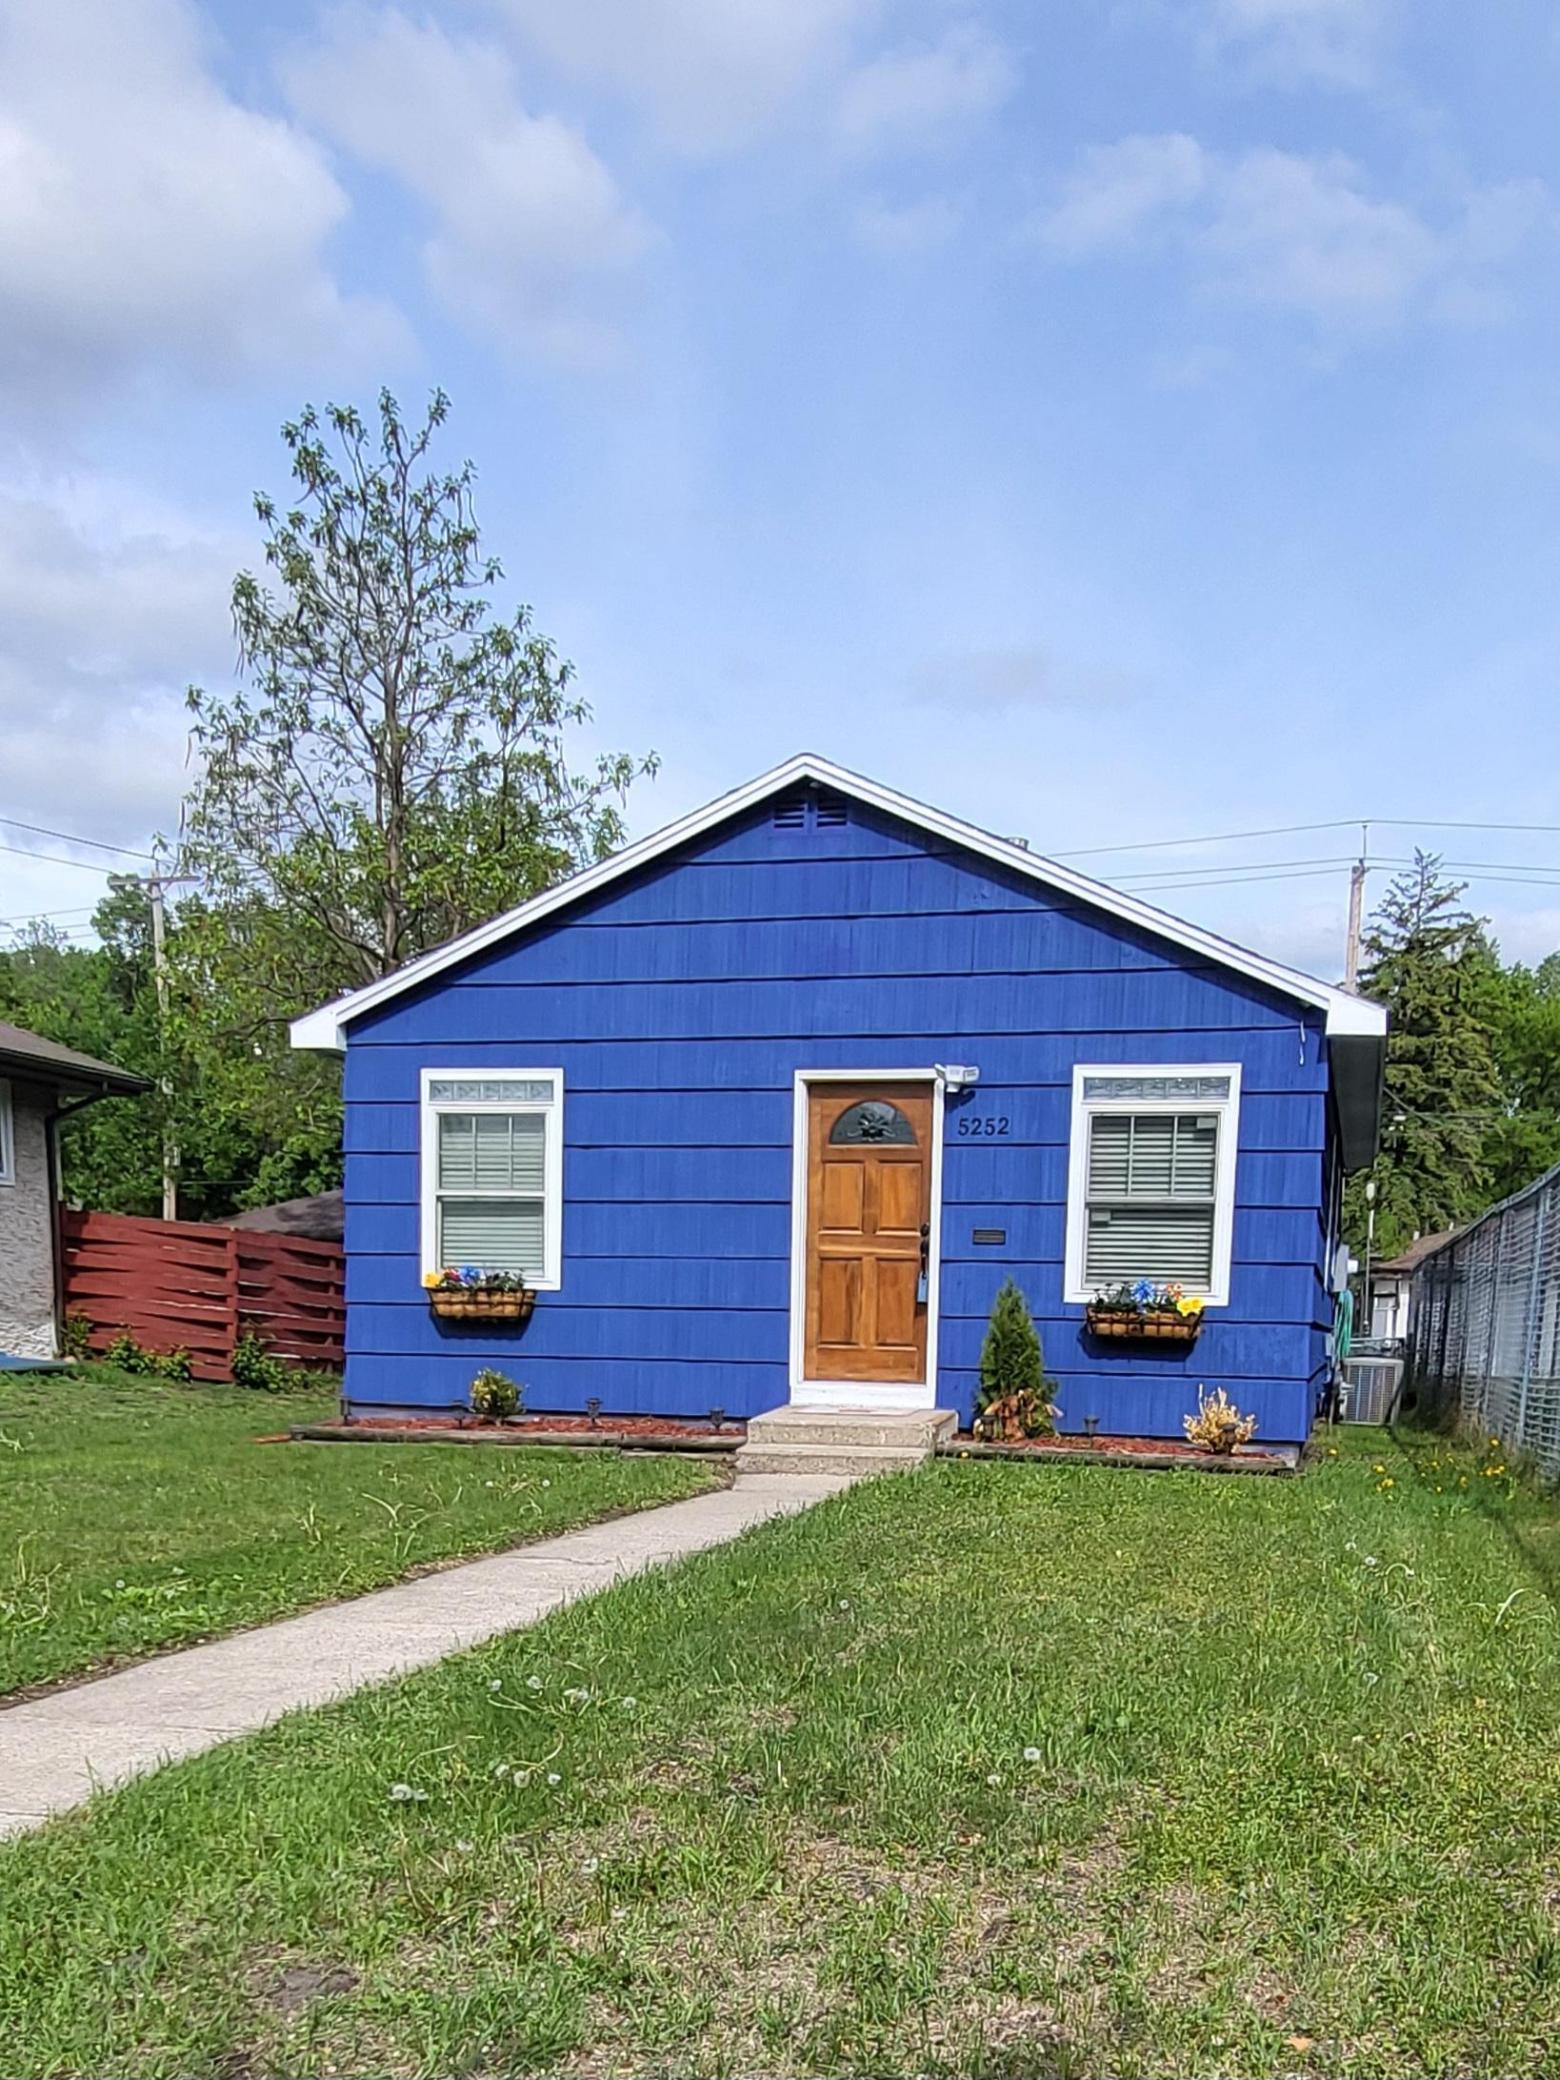
Active
$245,000
2
bds
|
1
ba
|
792
sqft
|
built
1945
5252 Queen Ave N, Minneapolis, MN 55430
$-55
Cash flow
-1.2%
Cash-on-Cash Return
5.4%
Cap rate
0.7%
Rent to Value Ratio
Active
$895,000
2
bds
|
2
ba
|
1,799
sqft
|
built
1877
8 Grove St, Minneapolis, MN 55401
$-2,440
Cash flow
-14.2%
Cash-on-Cash Return
2.4%
Cap rate
0.6%
Rent to Value Ratio
Active
$549,950
5
bds
|
4
ba
|
2,451
sqft
|
built
1963
3918 Randall Ave, Minneapolis, MN 55416
$-544
Cash flow
-5.2%
Cash-on-Cash Return
4.5%
Cap rate
0.7%
Rent to Value Ratio
Active
$389,900
5
bds
|
3
ba
|
2,446
sqft
|
built
1979
25 67th Way NE, Minneapolis, MN 55432
$-313
Cash flow
-4.2%
Cash-on-Cash Return
4.7%
Cap rate
0.7%
Rent to Value Ratio

Active
$189,900
2
bds
|
1
ba
|
748
sqft
|
built
1950
4515 Grand Ave S, Minneapolis, MN 55419
$-521
Cash flow
-14.3%
Cash-on-Cash Return
2.4%
Cap rate
0.8%
Rent to Value Ratio

Active
$349,900
2
bds
|
2
ba
|
1,060
sqft
|
built
2006
929 Portland Ave, Minneapolis, MN 55404
$-1,286
Cash flow
-19.2%
Cash-on-Cash Return
1.3%
Cap rate
0.6%
Rent to Value Ratio
Active
$135,000
2
bds
|
1
ba
|
875
sqft
|
built
1923
4655 Emerson Ave N, Minneapolis, MN 55412
$-55
Cash flow
-2.1%
Cash-on-Cash Return
5.2%
Cap rate
1.0%
Rent to Value Ratio

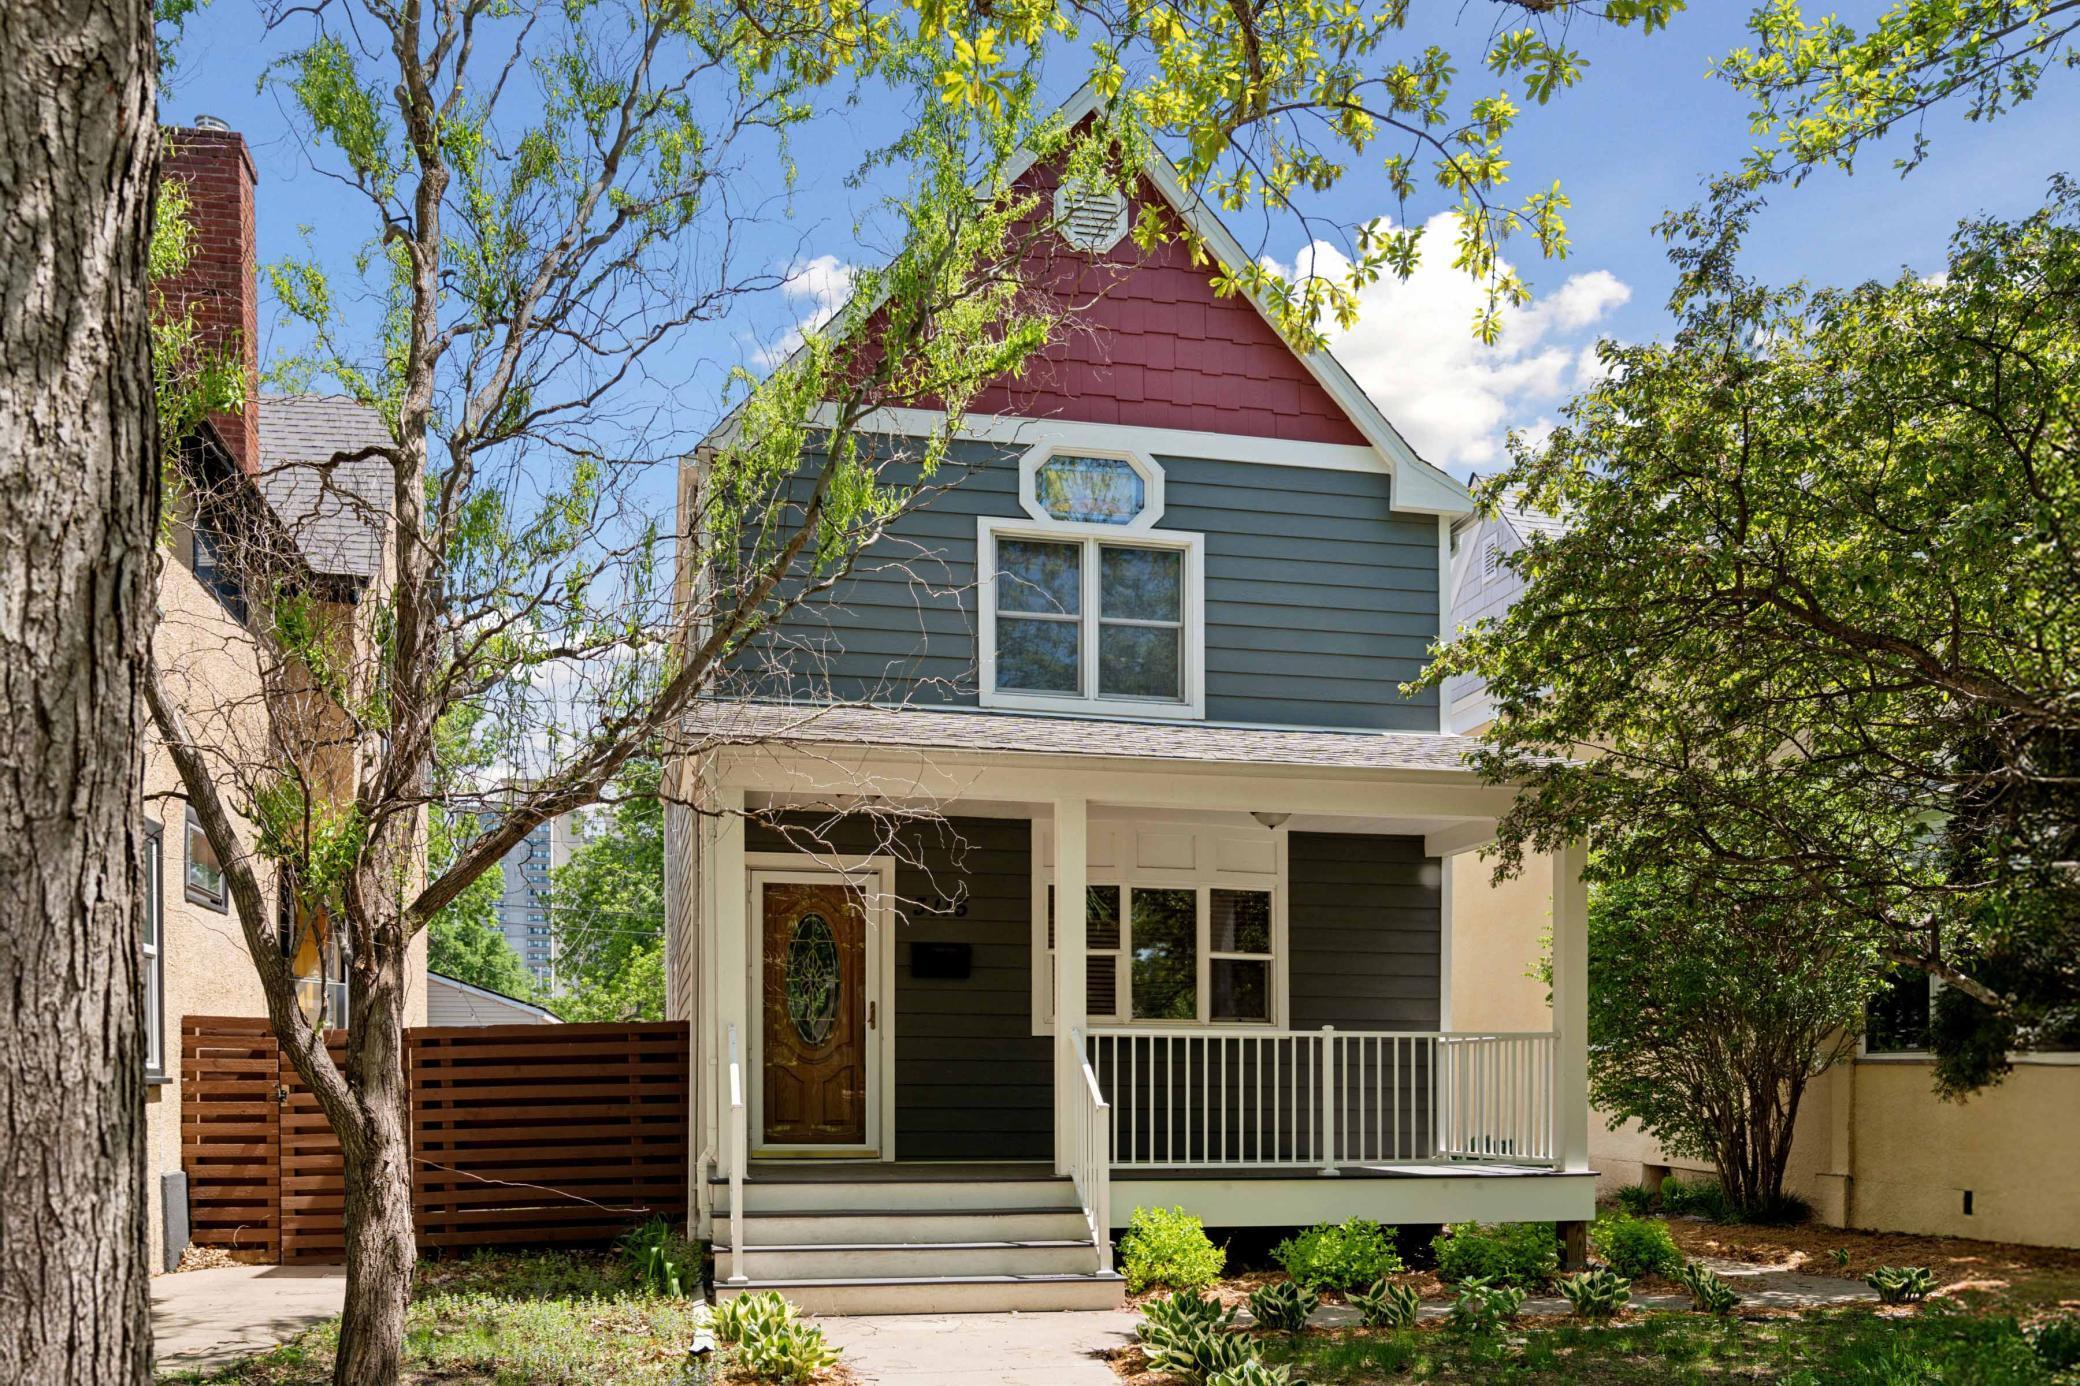
Active
$299,900
3
bds
|
1
ba
|
1,268
sqft
|
built
1914
3121 Harriet Ave, Minneapolis, MN 55408
$-296
Cash flow
-5.1%
Cash-on-Cash Return
4.5%
Cap rate
0.8%
Rent to Value Ratio
Active
$1,149,000
5
bds
|
4
ba
|
3,499
sqft
|
built
1908
2421 W 21st St, Minneapolis, MN 55405
$-2,358
Cash flow
-10.7%
Cash-on-Cash Return
3.2%
Cap rate
0.5%
Rent to Value Ratio
Active
$375,000
3
bds
|
2
ba
|
1,616
sqft
|
built
1950
5921 Xerxes Ave S, Minneapolis, MN 55410
$-224
Cash flow
-3.1%
Cash-on-Cash Return
5.0%
Cap rate
0.7%
Rent to Value Ratio
Active
$729,900
3
bds
|
4
ba
|
2,259
sqft
|
built
1947
5920 Colfax Ave S, Minneapolis, MN 55419
$-1,679
Cash flow
-12.0%
Cash-on-Cash Return
2.9%
Cap rate
0.5%
Rent to Value Ratio
Active
$449,000
6
bds
|
3
ba
|
3,063
sqft
|
built
1900
709 7th St SE, Minneapolis, MN 55414
$-391
Cash flow
-4.5%
Cash-on-Cash Return
4.6%
Cap rate
0.7%
Rent to Value Ratio
Active
$349,900
2
bds
|
2
ba
|
1,289
sqft
|
built
2001
580 N 2nd St, Minneapolis, MN 55401
$-1,474
Cash flow
-22.0%
Cash-on-Cash Return
0.6%
Cap rate
0.7%
Rent to Value Ratio
Pending
$299,000
3
bds
|
2
ba
|
1,460
sqft
|
built
1950
4922 Emerson Ave N, Minneapolis, MN 55430
$-150
Cash flow
-2.6%
Cash-on-Cash Return
5.1%
Cap rate
0.7%
Rent to Value Ratio

Active
$235,000
2
bds
|
1
ba
|
1,004
sqft
|
built
1915
2895 James Ave S, Minneapolis, MN 55408
$-337
Cash flow
-7.5%
Cash-on-Cash Return
4.0%
Cap rate
0.9%
Rent to Value Ratio
Pending
$270,000
2
bds
|
2
ba
|
1,021
sqft
|
built
2006
2600 University Ave SE, Minneapolis, MN 55414
$-641
Cash flow
-12.4%
Cash-on-Cash Return
2.8%
Cap rate
0.8%
Rent to Value Ratio

Pending
$244,900
2
bds
|
2
ba
|
945
sqft
|
built
2006
929 Portland Ave, Minneapolis, MN 55404
$-649
Cash flow
-13.8%
Cash-on-Cash Return
2.5%
Cap rate
0.9%
Rent to Value Ratio
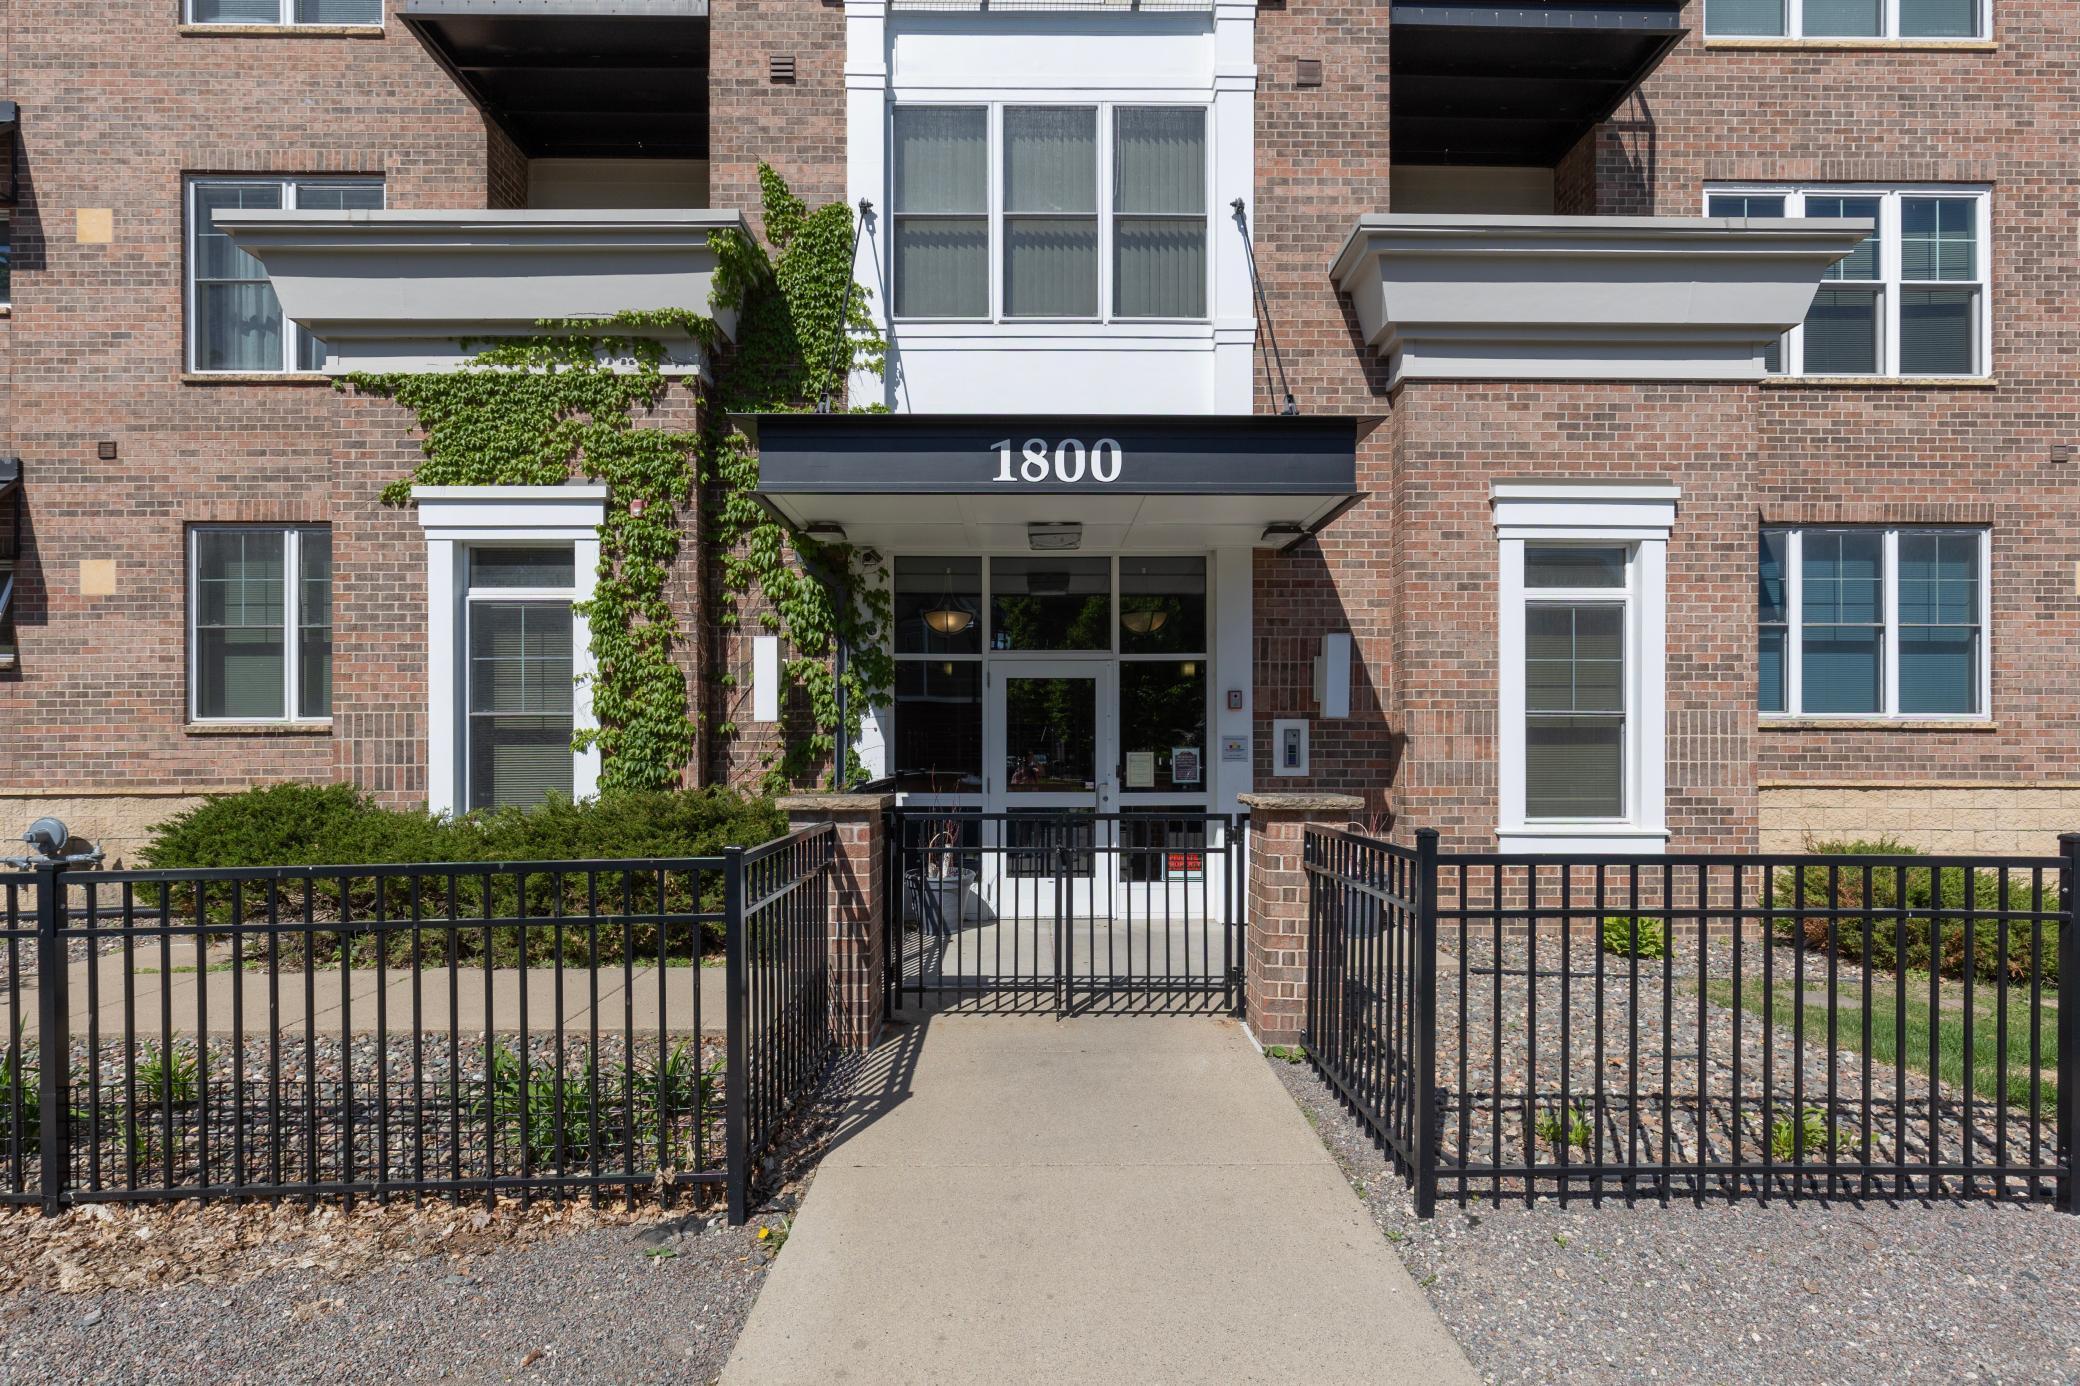
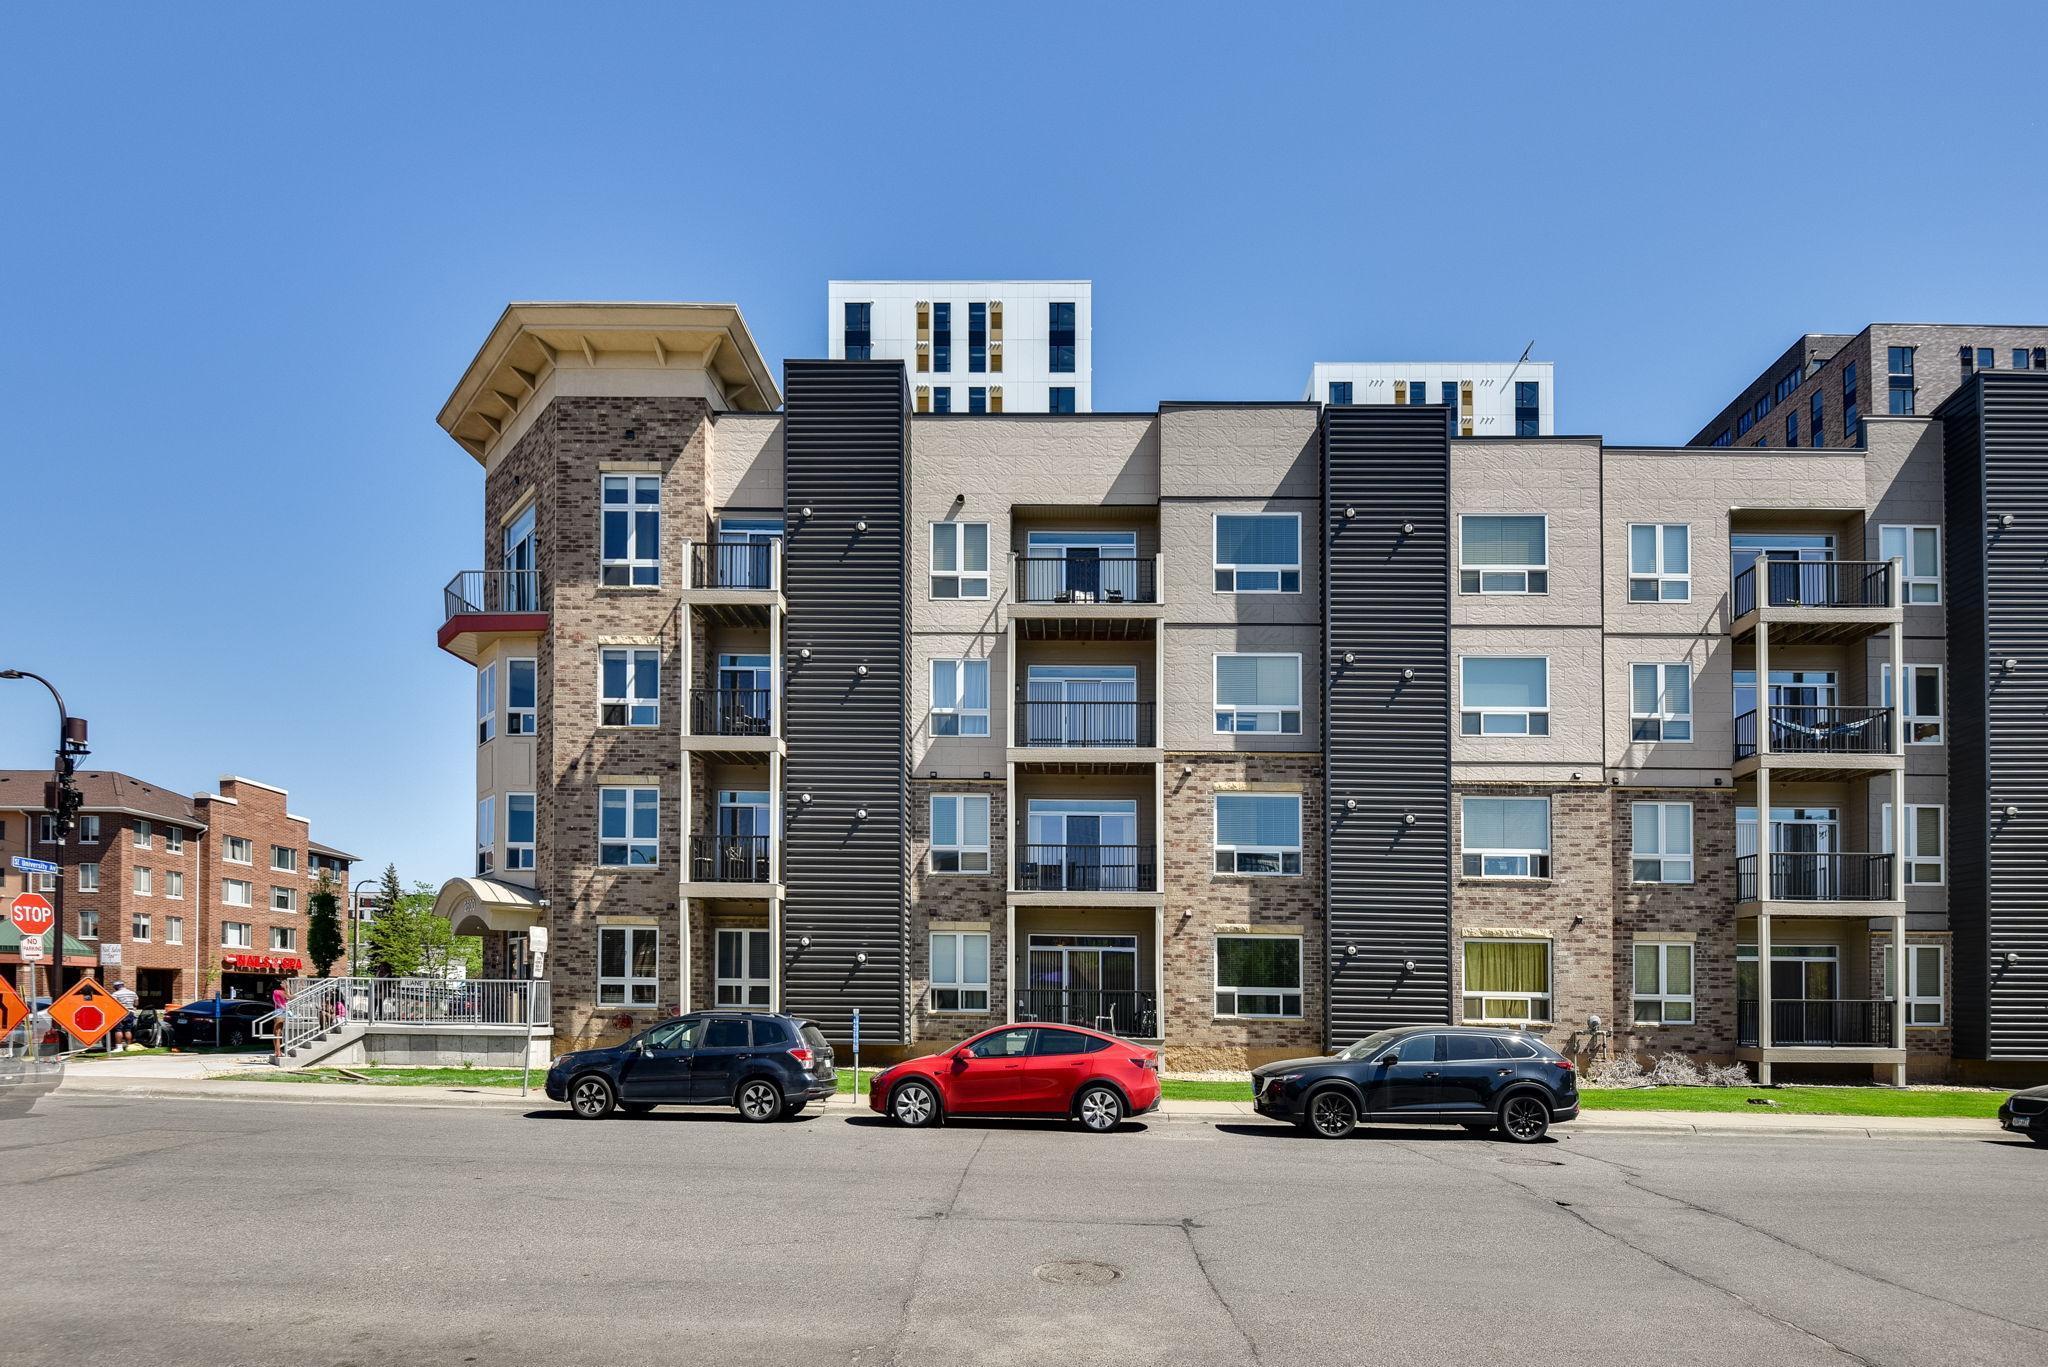
Active
$208,000
1
bds
|
1
ba
|
792
sqft
|
built
2004
1800 Clinton Ave, Minneapolis, MN 55404
$-436
Cash flow
-10.9%
Cash-on-Cash Return
3.2%
Cap rate
0.8%
Rent to Value Ratio

Active
$160,000
1
bds
|
1
ba
|
956
sqft
|
built
1982
232 W Franklin Ave, Minneapolis, MN 55404
$-435
Cash flow
-14.2%
Cash-on-Cash Return
2.4%
Cap rate
0.9%
Rent to Value Ratio
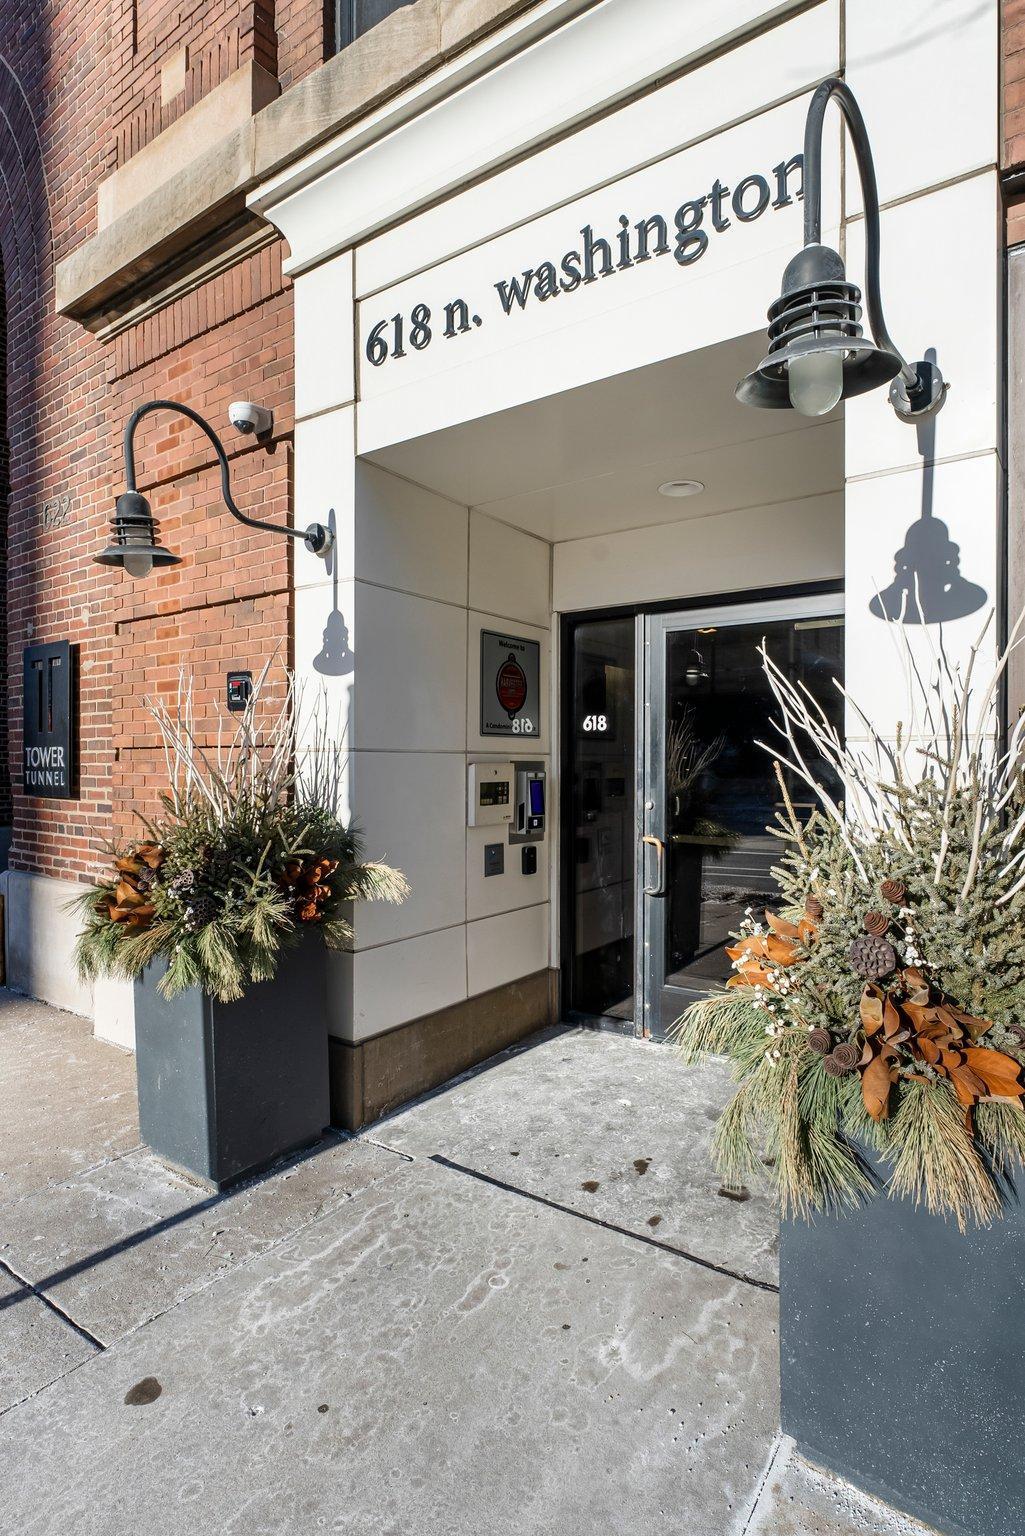
Active
$618,000
2
bds
|
2
ba
|
1,129
sqft
|
built
1916
618 Washington Ave N, Minneapolis, MN 55401
$-1,755
Cash flow
-14.8%
Cash-on-Cash Return
2.3%
Cap rate
0.6%
Rent to Value Ratio
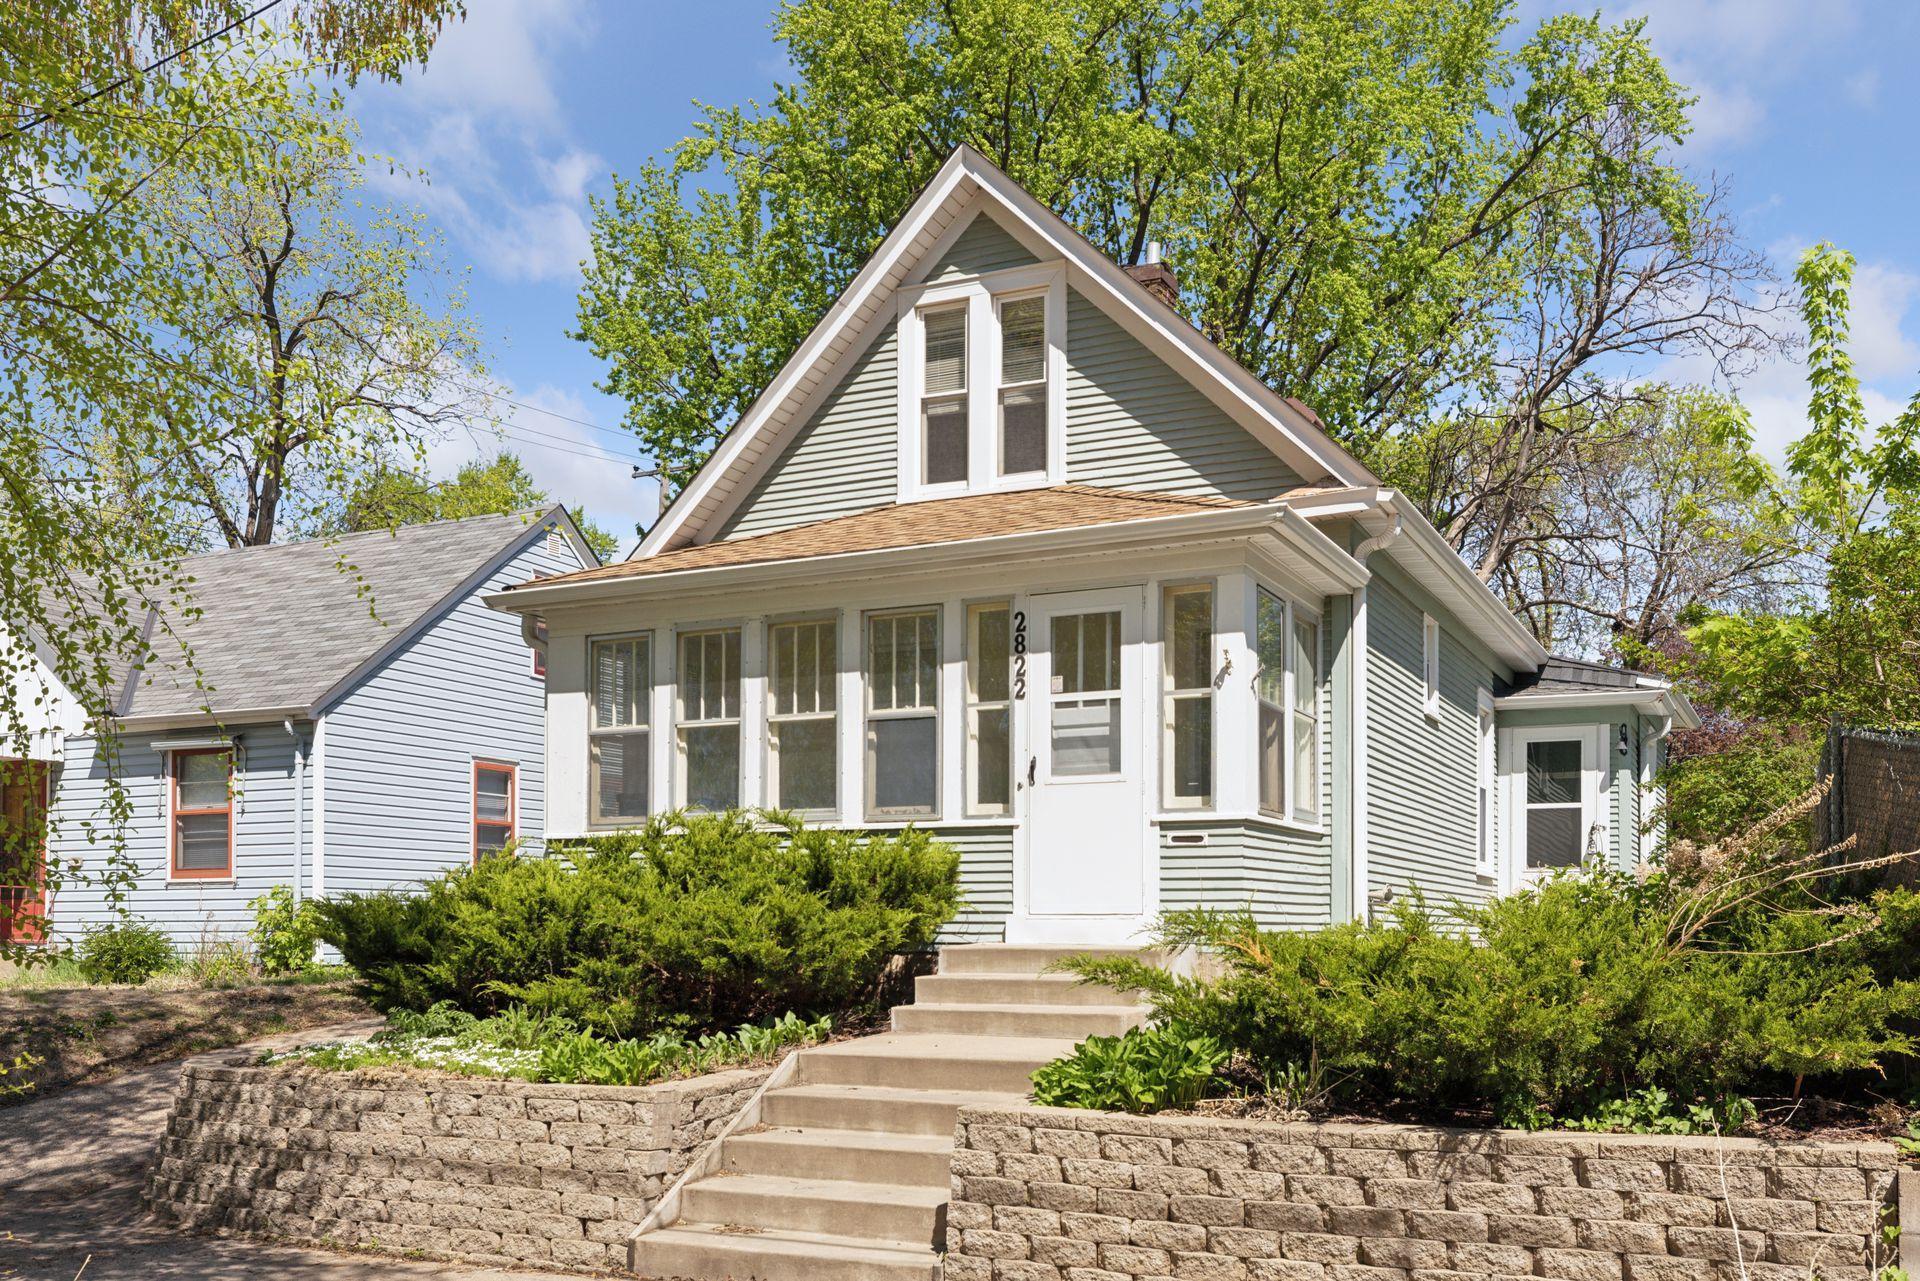
Active
$265,000
3
bds
|
1
ba
|
1,006
sqft
|
built
1903
2822 E 29th St, Minneapolis, MN 55406
$-88
Cash flow
-1.7%
Cash-on-Cash Return
5.3%
Cap rate
0.8%
Rent to Value Ratio
Active
$484,900
6
bds
|
4
ba
|
3,159
sqft
|
built
1984
10409 Goldenrod St NW, Minneapolis, MN 55448
$-288
Cash flow
-3.1%
Cash-on-Cash Return
5.0%
Cap rate
0.7%
Rent to Value Ratio
Active
$529,700
5
bds
|
2
ba
|
2,968
sqft
|
built
1907
716 4th St NE, Minneapolis, MN 55413
$-1,539
Cash flow
-15.2%
Cash-on-Cash Return
2.2%
Cap rate
0.4%
Rent to Value Ratio
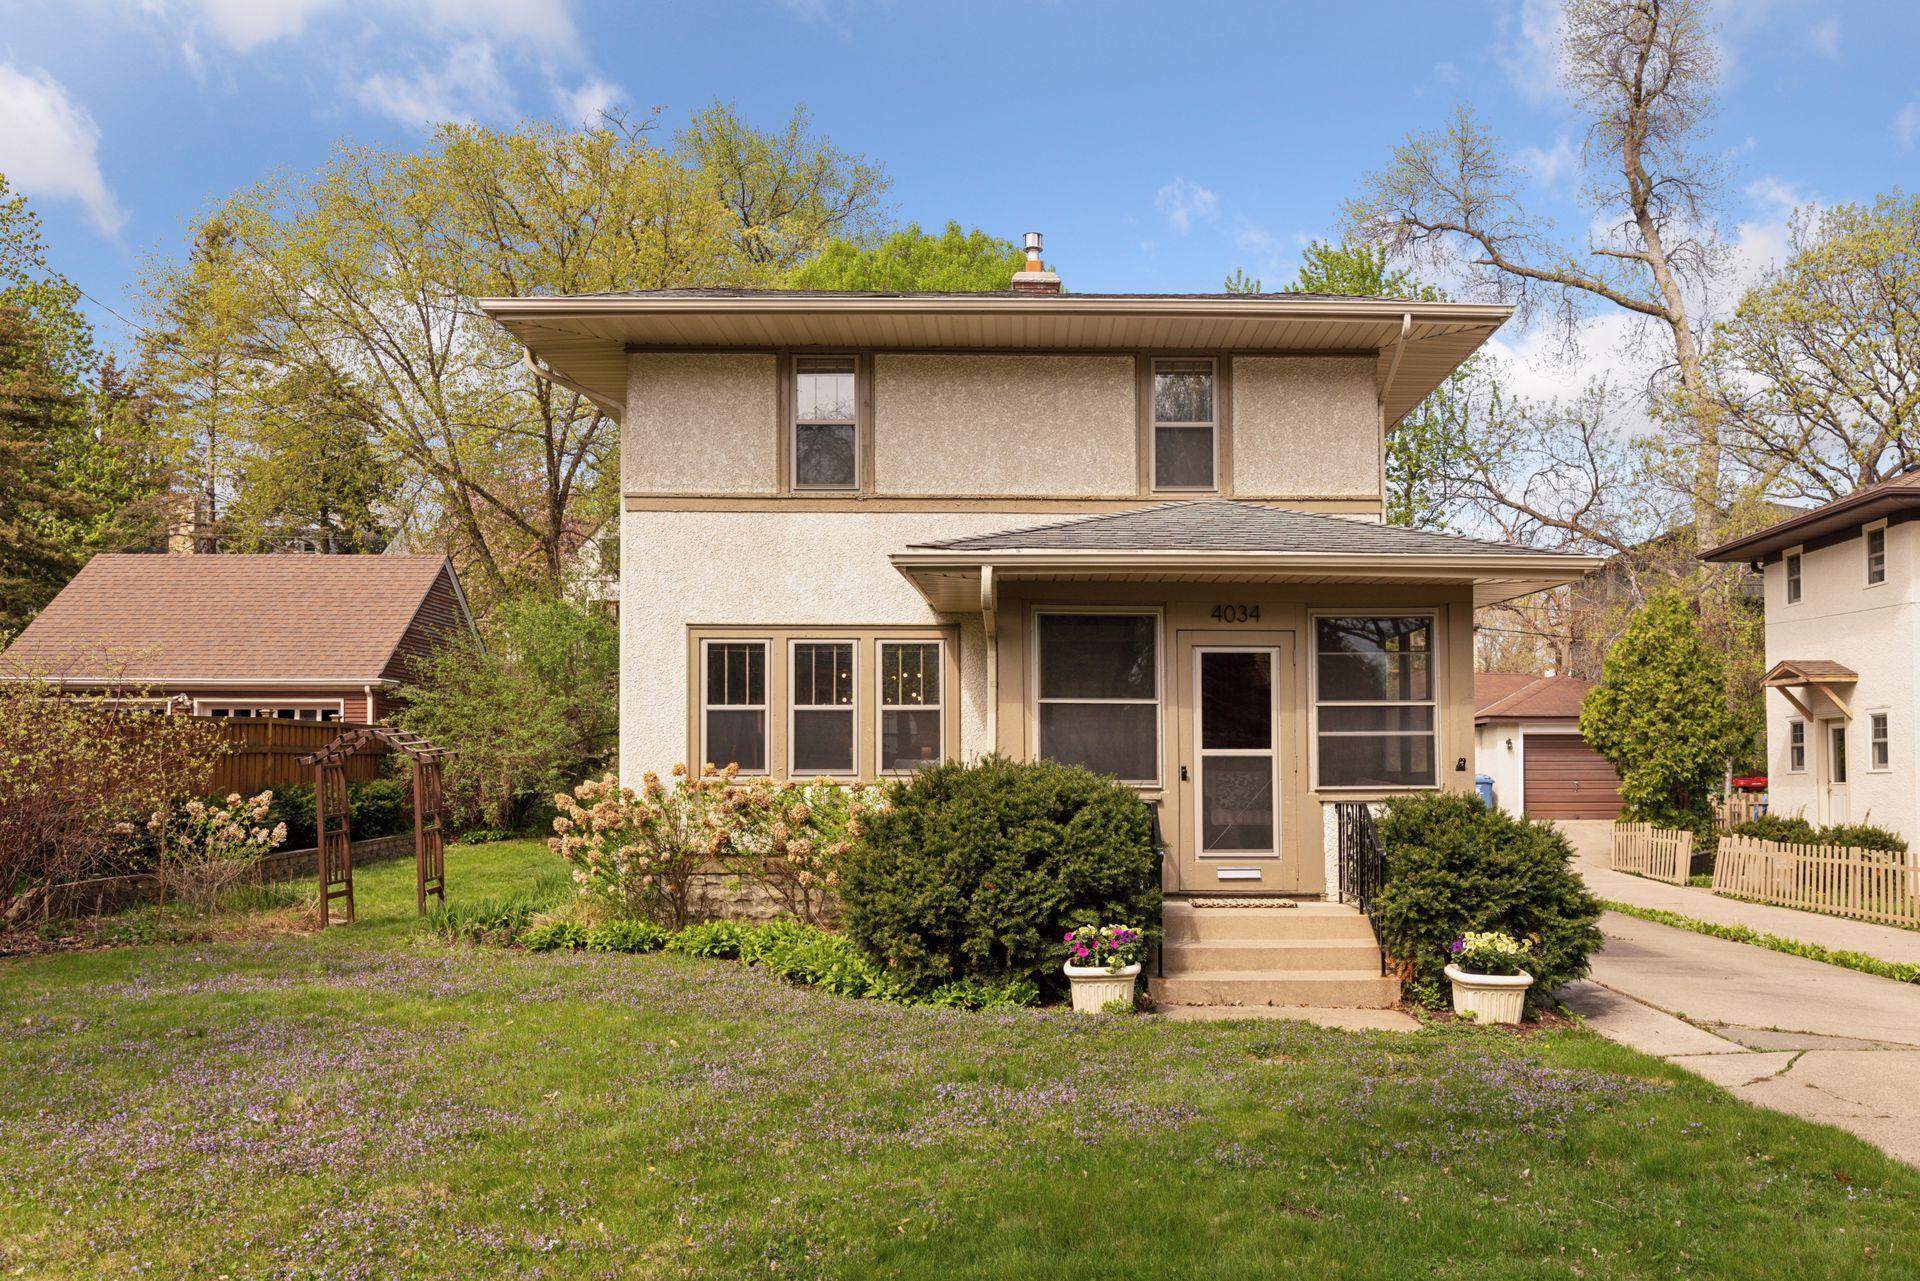
Pending
$599,000
3
bds
|
1
ba
|
1,200
sqft
|
built
1921
4034 Abbott Ave S, Minneapolis, MN 55410
$-1,203
Cash flow
-10.5%
Cash-on-Cash Return
3.3%
Cap rate
0.5%
Rent to Value Ratio
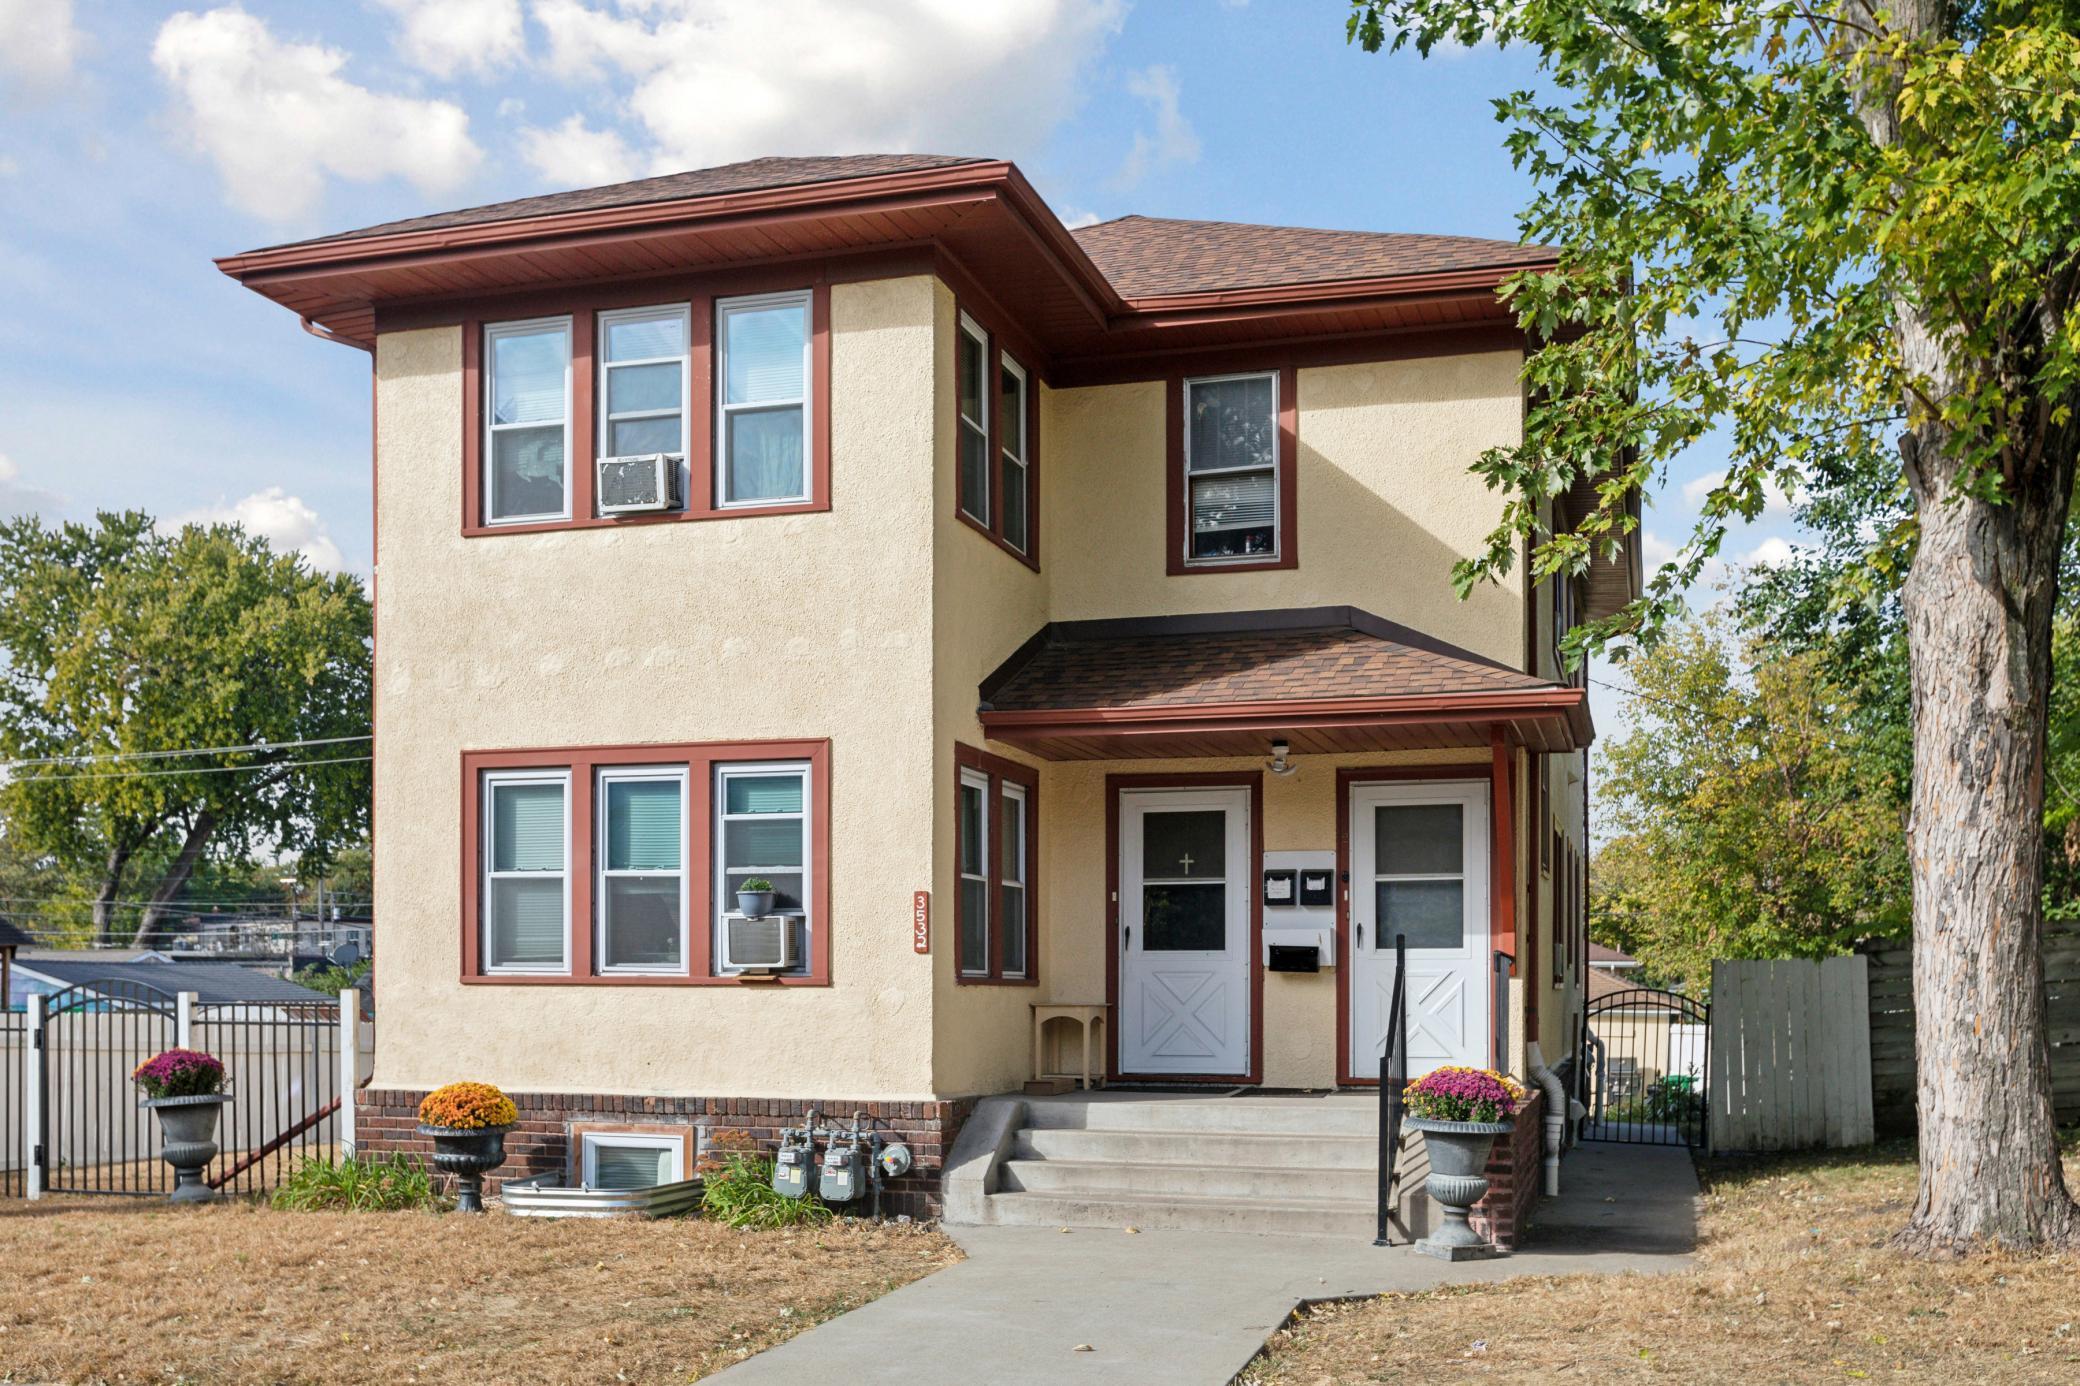
Active
$450,000
6
bds
|
3
ba
|
2,518
sqft
|
built
1924
3532 Longfellow Ave, Minneapolis, MN 55407
$-1,170
Cash flow
-13.6%
Cash-on-Cash Return
2.6%
Cap rate
0.5%
Rent to Value Ratio
Active
$470,000
4
bds
|
2
ba
|
2,343
sqft
|
built
1909
2227 Garfield Ave, Minneapolis, MN 55405
$-1,274
Cash flow
-14.1%
Cash-on-Cash Return
2.4%
Cap rate
0.5%
Rent to Value Ratio