Minneapolis, MN Investment Properties for Sale
Browse homes for sale and investment properties in Minneapolis, MN. Refine your search by price, property type, or more.
Best cash flowing properties in Minneapolis, MN

Active
$237,000
5
bds
|
2
ba
|
1,528
sqft
|
built
1922
914 Russell Ave N, Minneapolis, MN 55411
$221
Cash flow
4.9%
Cash-on-Cash Return
6.8%
Cap rate
1.0%
Rent to Value Ratio

Active
$244,000
3
bds
|
2
ba
|
1,343
sqft
|
built
1900
4715 Camden Ave N, Minneapolis, MN 55430
$175
Cash flow
3.7%
Cash-on-Cash Return
6.5%
Cap rate
0.9%
Rent to Value Ratio
1,006 out of 1,218 properties for sale in Minneapolis, MN
Limited Results Shown
Create a free account, or log in to reveal all property listings and enjoy the complete experience.
Active
$244,000
3
bds
|
2
ba
|
1,343
sqft
|
built
1900
4715 Camden Ave N, Minneapolis, MN 55430
$175
Cash flow
3.7%
Cash-on-Cash Return
6.5%
Cap rate
0.9%
Rent to Value Ratio
Active
$99,900
0
bds
|
1
ba
|
400
sqft
|
built
1970
2616 Harriet Ave, Minneapolis, MN 55408
$-20
Cash flow
-1.0%
Cash-on-Cash Return
5.4%
Cap rate
1.1%
Rent to Value Ratio

Active
$274,900
1
bds
|
1
ba
|
850
sqft
|
built
1921
1701 Madison St NE, Minneapolis, MN 55413
$-889
Cash flow
-16.9%
Cash-on-Cash Return
1.8%
Cap rate
0.7%
Rent to Value Ratio
Active
$125,000
1
bds
|
1
ba
|
650
sqft
|
built
1963
3018 Aldrich Ave S, Minneapolis, MN 55408
$-166
Cash flow
-6.9%
Cash-on-Cash Return
4.1%
Cap rate
1.1%
Rent to Value Ratio

Active
$199,900
2
bds
|
1
ba
|
730
sqft
|
built
1918
3229 Sheridan Ave N, Minneapolis, MN 55412
$-75
Cash flow
-2.0%
Cash-on-Cash Return
5.2%
Cap rate
0.8%
Rent to Value Ratio

Active
$289,900
2
bds
|
2
ba
|
1,158
sqft
|
built
1999
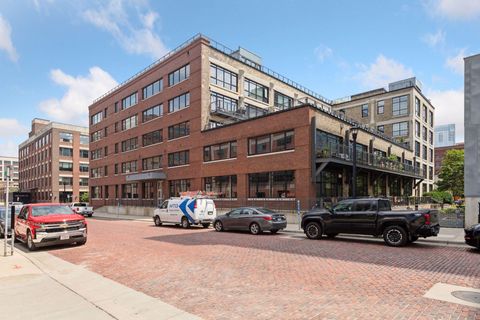
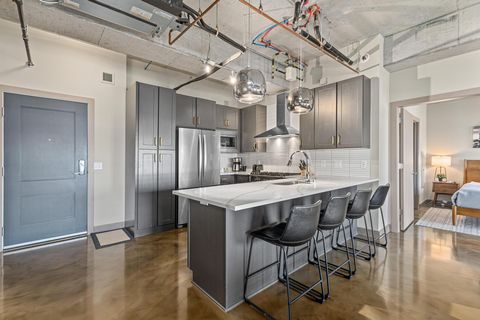
600 N 2nd St, Minneapolis, MN 55401
$-948
Cash flow
-17.1%
Cash-on-Cash Return
1.8%
Cap rate
0.8%
Rent to Value Ratio

Active
$425,000
2
bds
|
2
ba
|
1,334
sqft
|
built
2004
500 E Grant St, Minneapolis, MN 55404
$-1,411
Cash flow
-17.3%
Cash-on-Cash Return
1.7%
Cap rate
0.7%
Rent to Value Ratio

Active
$299,900
4
bds
|
1
ba
|
1,824
sqft
|
built
1955
6407 Emerson Ave N, Minneapolis, MN 55430
$-355
Cash flow
-6.2%
Cash-on-Cash Return
4.3%
Cap rate
0.7%
Rent to Value Ratio

Active
$849,900
4
bds
|
4
ba
|
4,764
sqft
|
built
1996
3670 Yuma Ln N, Minneapolis, MN 55446
$-1,719
Cash flow
-10.6%
Cash-on-Cash Return
3.3%
Cap rate
0.5%
Rent to Value Ratio

Active
$265,000
3
bds
|
2
ba
|
1,814
sqft
|
built
1911
2745 Columbus Ave, Minneapolis, MN 55407
$48
Cash flow
0.9%
Cash-on-Cash Return
5.9%
Cap rate
0.8%
Rent to Value Ratio
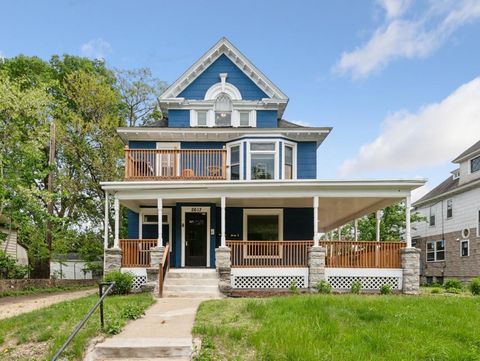
Active
$237,000
5
bds
|
2
ba
|
1,528
sqft
|
built
1922
914 Russell Ave N, Minneapolis, MN 55411
$221
Cash flow
4.9%
Cash-on-Cash Return
6.8%
Cap rate
1.0%
Rent to Value Ratio

Active
$142,000
bds
|
1
ba
|
769
sqft
|
built
2004
4824 E 53rd St, Minneapolis, MN 55417
$-306
Cash flow
-11.2%
Cash-on-Cash Return
3.1%
Cap rate
1.0%
Rent to Value Ratio

Active
$114,500
1
bds
|
1
ba
|
624
sqft
|
built
1963
3237 15th Ave S, Minneapolis, MN 55407
$-18
Cash flow
-0.8%
Cash-on-Cash Return
5.5%
Cap rate
1.2%
Rent to Value Ratio

Active
$175,000
2
bds
|
2
ba
|
1,110
sqft
|
built
1973
1920 S 1st St, Minneapolis, MN 55454
$-765
Cash flow
-22.8%
Cash-on-Cash Return
0.4%
Cap rate
1.3%
Rent to Value Ratio
Active
$649,900
6
bds
|
5
ba
|
4,300
sqft
|
built
1900
2613 Bryant Ave S, Minneapolis, MN 55408
$-2,388
Cash flow
-19.2%
Cash-on-Cash Return
1.3%
Cap rate
0.4%
Rent to Value Ratio

Active
$339,900
1
bds
|
1
ba
|
1,061
sqft
|
built
1917
901 N 3rd St, Minneapolis, MN 55401
$-1,083
Cash flow
-16.6%
Cash-on-Cash Return
1.9%
Cap rate
0.6%
Rent to Value Ratio
Active
$279,900
1
bds
|
1
ba
|
716
sqft
|
built
1900
400 N 1st St, Minneapolis, MN 55401
$-962
Cash flow
-17.9%
Cash-on-Cash Return
1.6%
Cap rate
0.6%
Rent to Value Ratio

Active
$190,000
1
bds
|
1
ba
|
650
sqft
|
built
1912
2606 Humboldt Ave S, Minneapolis, MN 55408
$-513
Cash flow
-14.1%
Cash-on-Cash Return
2.4%
Cap rate
0.7%
Rent to Value Ratio

Active
$539,900
3
bds
|
2
ba
|
1,760
sqft
|
built
1909
1909 Fremont Ave S, Minneapolis, MN 55403
$-1,575
Cash flow
-15.2%
Cash-on-Cash Return
2.2%
Cap rate
0.5%
Rent to Value Ratio

Active
$575,000
8
bds
|
5
ba
|
3,916
sqft
|
built
1900
2006 2nd Ave S, Minneapolis, MN 55404
$-3,781
Cash flow
-34.3%
Cash-on-Cash Return
-2.2%
Cap rate
0.4%
Rent to Value Ratio
Active
$949,500
2
bds
|
2
ba
|
1,820
sqft
|
built
2004
525 3rd St N, Minneapolis, MN 55401
$-2,913
Cash flow
-16.0%
Cash-on-Cash Return
2.0%
Cap rate
0.5%
Rent to Value Ratio

Active
$285,000
3
bds
|
1
ba
|
1,327
sqft
|
built
1926
4335 5th Ave S, Minneapolis, MN 55409
$169
Cash flow
3.1%
Cash-on-Cash Return
6.4%
Cap rate
0.8%
Rent to Value Ratio

Active
$369,000
3
bds
|
4
ba
|
2,194
sqft
|
built
2015
628 20th Ave S, Minneapolis, MN 55454
$-714
Cash flow
-10.1%
Cash-on-Cash Return
3.4%
Cap rate
0.8%
Rent to Value Ratio

Active
$429,900
3
bds
|
2
ba
|
1,760
sqft
|
built
1894
3115 Harriet Ave, Minneapolis, MN 55408
$-672
Cash flow
-8.2%
Cash-on-Cash Return
3.8%
Cap rate
0.7%
Rent to Value Ratio
Active
$700,000
2
bds
|
2
ba
|
978
sqft
|
built
2019
728 3rd St N, Minneapolis, MN 55401
$-2,184
Cash flow
-16.3%
Cash-on-Cash Return
1.9%
Cap rate
0.5%
Rent to Value Ratio

Active
$519,000
4
bds
|
2
ba
|
2,370
sqft
|
built
1900
4304 Colfax Ave S, Minneapolis, MN 55409
$-1,712
Cash flow
-17.2%
Cash-on-Cash Return
1.7%
Cap rate
0.4%
Rent to Value Ratio

Active
$3,495,000
4
bds
|
8
ba
|
8,323
sqft
|
built
1911
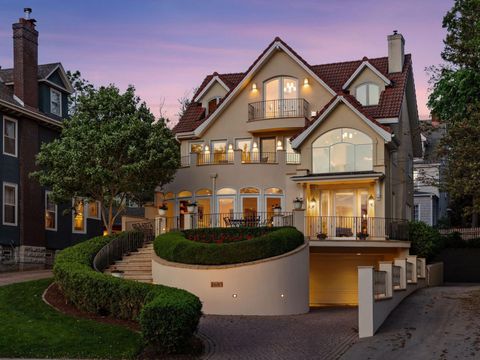
2427 E Lake Of The Isles Pkwy, Minneapolis, MN 55405
$-14,610
Cash flow
-21.8%
Cash-on-Cash Return
0.7%
Cap rate
0.3%
Rent to Value Ratio

Active
$664,900
8
bds
|
4
ba
|
4,500
sqft
|
built
1962
5116 Edgewood Ave N, Minneapolis, MN 55428
$-2,402
Cash flow
-18.8%
Cash-on-Cash Return
1.3%
Cap rate
0.3%
Rent to Value Ratio

Active
$525,000
5
bds
|
4
ba
|
3,489
sqft
|
built
1952
3522 Benjamin St NE, Minneapolis, MN 55418
$-1,526
Cash flow
-15.2%
Cash-on-Cash Return
2.2%
Cap rate
0.4%
Rent to Value Ratio
Active
$2,375,000
3
bds
|
3
ba
|
4,033
sqft
|
built
1907
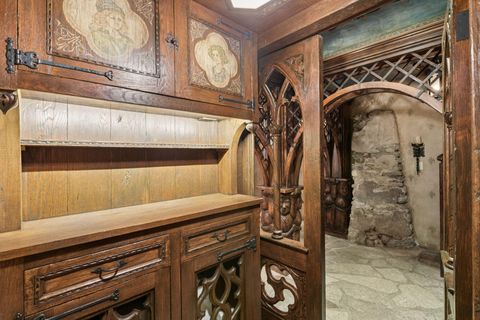
2683 E Lake Of The Isles Pkwy, Minneapolis, MN 55408
$-10,312
Cash flow
-22.7%
Cash-on-Cash Return
0.5%
Cap rate
0.2%
Rent to Value Ratio

Active
$245,000
2
bds
|
1
ba
|
792
sqft
|
built
1945
5252 Queen Ave N, Minneapolis, MN 55430
$-55
Cash flow
-1.2%
Cash-on-Cash Return
5.4%
Cap rate
0.7%
Rent to Value Ratio
Active
$895,000
2
bds
|
2
ba
|
1,799
sqft
|
built
1877
8 Grove St, Minneapolis, MN 55401
$-2,440
Cash flow
-14.2%
Cash-on-Cash Return
2.4%
Cap rate
0.6%
Rent to Value Ratio

Active
$549,950
5
bds
|
4
ba
|
2,451
sqft
|
built
1963
3918 Randall Ave, Minneapolis, MN 55416
$-544
Cash flow
-5.2%
Cash-on-Cash Return
4.5%
Cap rate
0.7%
Rent to Value Ratio

Active
$389,900
5
bds
|
3
ba
|
2,446
sqft
|
built
1979
25 67th Way NE, Minneapolis, MN 55432
$-313
Cash flow
-4.2%
Cash-on-Cash Return
4.7%
Cap rate
0.7%
Rent to Value Ratio

Active
$189,900
2
bds
|
1
ba
|
748
sqft
|
built
1950
4515 Grand Ave S, Minneapolis, MN 55419
$-521
Cash flow
-14.3%
Cash-on-Cash Return
2.4%
Cap rate
0.8%
Rent to Value Ratio

Active
$349,900
2
bds
|
2
ba
|
1,060
sqft
|
built
2006
929 Portland Ave, Minneapolis, MN 55404
$-1,286
Cash flow
-19.2%
Cash-on-Cash Return
1.3%
Cap rate
0.6%
Rent to Value Ratio

Active
$135,000
2
bds
|
1
ba
|
875
sqft
|
built
1923
4655 Emerson Ave N, Minneapolis, MN 55412
$-55
Cash flow
-2.1%
Cash-on-Cash Return
5.2%
Cap rate
1.0%
Rent to Value Ratio

Active
$299,900
3
bds
|
1
ba
|
1,268
sqft
|
built
1914
3121 Harriet Ave, Minneapolis, MN 55408
$-296
Cash flow
-5.1%
Cash-on-Cash Return
4.5%
Cap rate
0.8%
Rent to Value Ratio

Active
$349,900
2
bds
|
2
ba
|
1,289
sqft
|
built
2001
580 N 2nd St, Minneapolis, MN 55401
$-1,474
Cash flow
-22.0%
Cash-on-Cash Return
0.6%
Cap rate
0.7%
Rent to Value Ratio

Active
$729,900
3
bds
|
4
ba
|
2,259
sqft
|
built
1947
5920 Colfax Ave S, Minneapolis, MN 55419
$-1,679
Cash flow
-12.0%
Cash-on-Cash Return
2.9%
Cap rate
0.5%
Rent to Value Ratio