Minneapolis, MN Investment Properties for Sale
Browse homes for sale and investment properties in Minneapolis, MN. Refine your search by price, property type, or more.
Best cash flowing properties in Minneapolis, MN
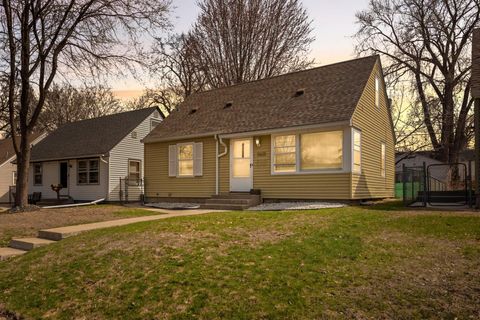
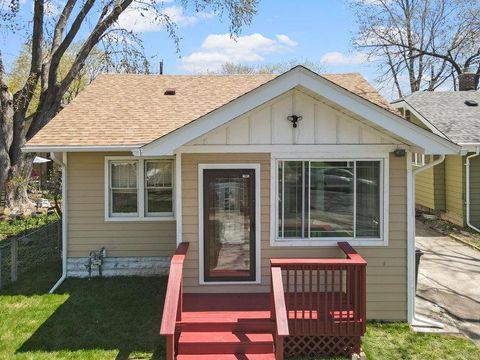
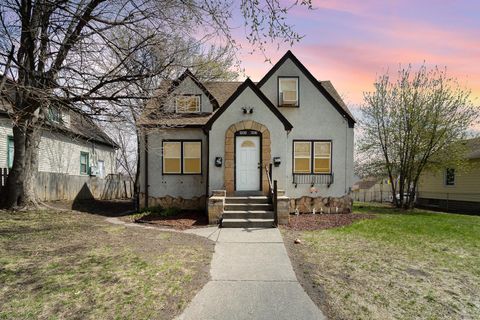
Pending
$199,900
3
bds
|
1
ba
|
909
sqft
|
built
1909
1822 26th Ave N, Minneapolis, MN 55411
$88
Cash flow
2.3%
Cash-on-Cash Return
6.2%
Cap rate
0.8%
Rent to Value Ratio
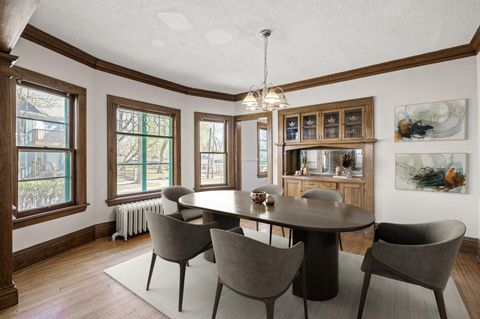
Active
$169,900
1
bds
|
1
ba
|
611
sqft
|
built
1923
3700 Russell Ave N, Minneapolis, MN 55412
$8
Cash flow
0.2%
Cash-on-Cash Return
5.7%
Cap rate
0.9%
Rent to Value Ratio
990 out of 1,198 properties for sale in Minneapolis, MN
Limited Results Shown
Create a free account, or log in to reveal all property listings and enjoy the complete experience.

Active
$330,000
2
bds
|
2
ba
|
1,461
sqft
|
built
2001
620 Wesley Commons Dr, Minneapolis, MN 55427
$-989
Cash flow
-15.6%
Cash-on-Cash Return
2.1%
Cap rate
0.7%
Rent to Value Ratio

Active
$147,000
3
bds
|
2
ba
|
1,274
sqft
|
built
1971
4207 Lakeside Ave N, Minneapolis, MN 55429
$-99
Cash flow
-3.5%
Cash-on-Cash Return
4.9%
Cap rate
1.4%
Rent to Value Ratio
Active
$699,990
4
bds
|
2
ba
|
2,305
sqft
|
built
1941
5217 France Ave S, Minneapolis, MN 55410
$-1,493
Cash flow
-11.1%
Cash-on-Cash Return
3.1%
Cap rate
0.5%
Rent to Value Ratio
Active
$399,990
5
bds
|
2
ba
|
2,071
sqft
|
built
1900
2544 Pleasant Ave, Minneapolis, MN 55404
$-339
Cash flow
-4.4%
Cash-on-Cash Return
4.7%
Cap rate
0.7%
Rent to Value Ratio
Active
$100,000
bds
|
1
ba
|
487
sqft
|
built
1982
431 S 7th St, Minneapolis, MN 55415
$-418
Cash flow
-21.8%
Cash-on-Cash Return
0.7%
Cap rate
1.4%
Rent to Value Ratio
Active
$319,000
3
bds
|
1
ba
|
970
sqft
|
built
1950
5625 27th Ave S, Minneapolis, MN 55417
$-283
Cash flow
-4.6%
Cash-on-Cash Return
4.6%
Cap rate
0.7%
Rent to Value Ratio
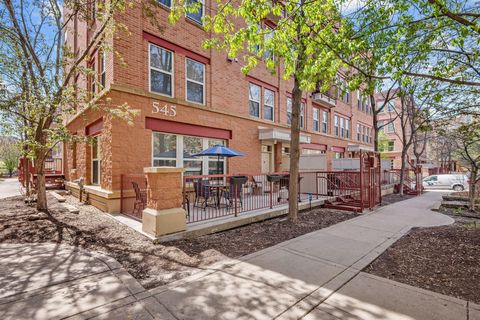
Active
$425,000
2
bds
|
3
ba
|
1,432
sqft
|
built
2002
545 N 1st St, Minneapolis, MN 55401
$-1,385
Cash flow
-17.0%
Cash-on-Cash Return
1.8%
Cap rate
0.7%
Rent to Value Ratio

Active
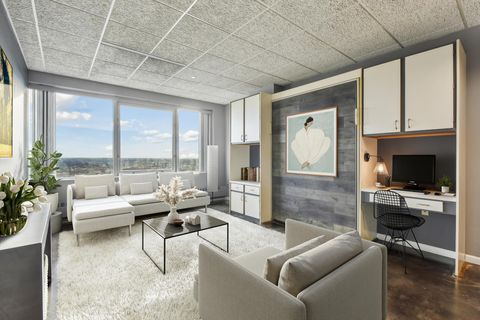
$265,000
1
bds
|
1
ba
|
853
sqft
|
built
2004
500 E Grant St, Minneapolis, MN 55404
$-1,146
Cash flow
-22.6%
Cash-on-Cash Return
0.5%
Cap rate
0.7%
Rent to Value Ratio
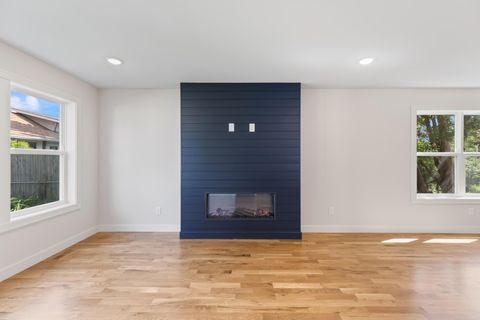
Active
$794,500
4
bds
|
4
ba
|
3,192
sqft
|
built
2025
5345 45th Ave S, Minneapolis, MN 55417
$-3,042
Cash flow
-20.0%
Cash-on-Cash Return
1.1%
Cap rate
0.2%
Rent to Value Ratio

Active
$269,000
1
bds
|
1
ba
|
832
sqft
|
built
1989
401 S 1st St, Minneapolis, MN 55401
$-682
Cash flow
-13.2%
Cash-on-Cash Return
2.6%
Cap rate
0.7%
Rent to Value Ratio
Active
$245,000
1
bds
|
1
ba
|
972
sqft
|
built
2006
3640 Wooddale Ave S, Minneapolis, MN 55416
$-628
Cash flow
-13.4%
Cash-on-Cash Return
2.6%
Cap rate
0.8%
Rent to Value Ratio
Active
$169,000
2
bds
|
2
ba
|
1,025
sqft
|
built
1973
4654 Cedar Lake Rd S, Minneapolis, MN 55416
$-303
Cash flow
-9.4%
Cash-on-Cash Return
3.5%
Cap rate
1.1%
Rent to Value Ratio

Active
$859,900
2
bds
|
2
ba
|
1,790
sqft
|
built
2017
1240 S 2nd St, Minneapolis, MN 55415
$-3,177
Cash flow
-19.3%
Cash-on-Cash Return
1.2%
Cap rate
0.5%
Rent to Value Ratio
Active
$169,900
1
bds
|
1
ba
|
611
sqft
|
built
1923
3700 Russell Ave N, Minneapolis, MN 55412
$8
Cash flow
0.2%
Cash-on-Cash Return
5.7%
Cap rate
0.9%
Rent to Value Ratio

Active
$469,900
1
bds
|
1
ba
|
1,346
sqft
|
built
1900
702 N 1st St, Minneapolis, MN 55401
$-1,927
Cash flow
-21.4%
Cash-on-Cash Return
0.8%
Cap rate
0.5%
Rent to Value Ratio
Active
$345,000
2
bds
|
2
ba
|
1,490
sqft
|
built
2006
301 Oak Grove St, Minneapolis, MN 55403
$-917
Cash flow
-13.9%
Cash-on-Cash Return
2.5%
Cap rate
0.8%
Rent to Value Ratio
Active
$274,900
2
bds
|
1
ba
|
804
sqft
|
built
1911
2943 Taylor St NE, Minneapolis, MN 55418
$-99
Cash flow
-1.9%
Cash-on-Cash Return
5.2%
Cap rate
0.8%
Rent to Value Ratio
Active
$116,900
1
bds
|
1
ba
|
484
sqft
|
built
1961
2112 Garfield Ave, Minneapolis, MN 55405
$-241
Cash flow
-10.8%
Cash-on-Cash Return
3.2%
Cap rate
0.9%
Rent to Value Ratio

Active
$249,900
1
bds
|
1
ba
|
755
sqft
|
built
1989
401 S 1st St, Minneapolis, MN 55401
$-733
Cash flow
-15.3%
Cash-on-Cash Return
2.2%
Cap rate
0.7%
Rent to Value Ratio
Active
$765,000
2
bds
|
2
ba
|
1,909
sqft
|
built
2018
1240 S 2nd St, Minneapolis, MN 55415
$-2,561
Cash flow
-17.5%
Cash-on-Cash Return
1.7%
Cap rate
0.5%
Rent to Value Ratio

Active
$125,000
1
bds
|
1
ba
|
671
sqft
|
built
1965
4023 14th Ave S, Minneapolis, MN 55407
$-217
Cash flow
-9.1%
Cash-on-Cash Return
3.6%
Cap rate
1.0%
Rent to Value Ratio

Active
$117,000
1
bds
|
1
ba
|
524
sqft
|
built
1964
2530 1st Ave S, Minneapolis, MN 55404
$-243
Cash flow
-10.8%
Cash-on-Cash Return
3.2%
Cap rate
0.9%
Rent to Value Ratio
Active
$650,000
2
bds
|
2
ba
|
1,482
sqft
|
built
2017
1240 S 2nd St, Minneapolis, MN 55415
$-1,999
Cash flow
-16.0%
Cash-on-Cash Return
2.0%
Cap rate
0.6%
Rent to Value Ratio
Active
$339,900
3
bds
|
1
ba
|
1,580
sqft
|
built
1954
6300 Quebec Ave N, Minneapolis, MN 55428
$-520
Cash flow
-8.0%
Cash-on-Cash Return
3.8%
Cap rate
0.6%
Rent to Value Ratio
Active
$339,000
4
bds
|
2
ba
|
1,686
sqft
|
built
1926
4247 Cheatham Ave, Minneapolis, MN 55406
$-639
Cash flow
-9.8%
Cash-on-Cash Return
3.4%
Cap rate
0.5%
Rent to Value Ratio
Active
$414,900
5
bds
|
2
ba
|
2,176
sqft
|
built
1952
3808 Welcome Ave N, Minneapolis, MN 55422
$-379
Cash flow
-4.8%
Cash-on-Cash Return
4.6%
Cap rate
0.7%
Rent to Value Ratio
Active
$569,900
2
bds
|
2
ba
|
1,792
sqft
|
built
1983
1235 Yale Pl, Minneapolis, MN 55403
$-2,545
Cash flow
-23.3%
Cash-on-Cash Return
0.3%
Cap rate
0.6%
Rent to Value Ratio

Active
$129,900
1
bds
|
1
ba
|
568
sqft
|
built
1968
2212 Aldrich Ave S, Minneapolis, MN 55405
$-88
Cash flow
-3.5%
Cash-on-Cash Return
4.9%
Cap rate
1.1%
Rent to Value Ratio
Active
$485,000
4
bds
|
2
ba
|
1,970
sqft
|
built
1900
2738 Emerson Ave S, Minneapolis, MN 55408
$-708
Cash flow
-7.6%
Cash-on-Cash Return
3.9%
Cap rate
0.5%
Rent to Value Ratio
Active
$295,400
6
bds
|
3
ba
|
2,943
sqft
|
built
1931
3230 James Ave N, Minneapolis, MN 55412
$-255
Cash flow
-4.5%
Cash-on-Cash Return
4.6%
Cap rate
0.8%
Rent to Value Ratio
Active
$275,000
4
bds
|
2
ba
|
2,380
sqft
|
built
1914
2138 N 6th St, Minneapolis, MN 55411
$-451
Cash flow
-8.6%
Cash-on-Cash Return
3.7%
Cap rate
0.7%
Rent to Value Ratio
Active
$465,000
4
bds
|
2
ba
|
2,875
sqft
|
built
1903
3033 3rd Ave S, Minneapolis, MN 55408
$-1,366
Cash flow
-15.3%
Cash-on-Cash Return
2.2%
Cap rate
0.4%
Rent to Value Ratio
Active
$169,900
1
bds
|
1
ba
|
710
sqft
|
built
1968
410 Groveland Ave, Minneapolis, MN 55403
$-635
Cash flow
-19.5%
Cash-on-Cash Return
1.2%
Cap rate
0.9%
Rent to Value Ratio

Active
$425,000
2
bds
|
2
ba
|
1,087
sqft
|
built
2005
720 N 4th St, Minneapolis, MN 55401
$-1,231
Cash flow
-15.1%
Cash-on-Cash Return
2.2%
Cap rate
0.7%
Rent to Value Ratio
Pending
$1,250,000
4
bds
|
4
ba
|
3,645
sqft
|
built
2016
2728 Chowen Ave S, Minneapolis, MN 55416
$-4,084
Cash flow
-17.0%
Cash-on-Cash Return
1.8%
Cap rate
0.4%
Rent to Value Ratio

Active
$349,900
1
bds
|
1
ba
|
1,046
sqft
|
built
1989
401 S 1st St, Minneapolis, MN 55401
$-1,209
Cash flow
-18.0%
Cash-on-Cash Return
1.5%
Cap rate
0.6%
Rent to Value Ratio
Active
$364,900
2
bds
|
2
ba
|
1,358
sqft
|
built
1989
401 S 1st St, Minneapolis, MN 55401
$-1,484
Cash flow
-21.2%
Cash-on-Cash Return
0.8%
Cap rate
0.6%
Rent to Value Ratio
Active
$342,900
3
bds
|
2
ba
|
2,034
sqft
|
built
1926
4049 17th Ave S, Minneapolis, MN 55407
$-378
Cash flow
-5.8%
Cash-on-Cash Return
4.4%
Cap rate
0.7%
Rent to Value Ratio
Active
$290,000
2
bds
|
2
ba
|
1,533
sqft
|
built
1923
1270 46th Ave NE, Minneapolis, MN 55421
$-30
Cash flow
-0.5%
Cash-on-Cash Return
5.6%
Cap rate
0.8%
Rent to Value Ratio
Pending
$199,900
3
bds
|
1
ba
|
909
sqft
|
built
1909
1822 26th Ave N, Minneapolis, MN 55411
$88
Cash flow
2.3%
Cash-on-Cash Return
6.2%
Cap rate
0.8%
Rent to Value Ratio