Minneapolis, MN Investment Properties for Sale
Browse homes for sale and investment properties in Minneapolis, MN. Refine your search by price, property type, or more.
Best cash flowing properties in Minneapolis, MN
Active
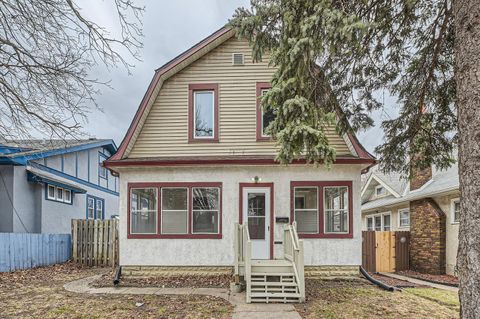
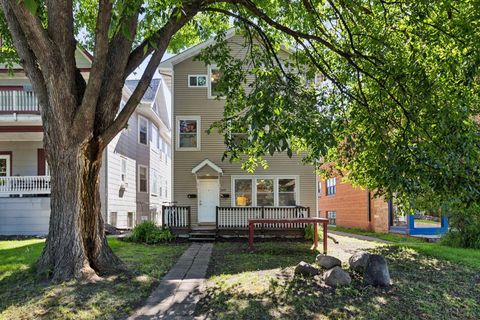
$229,900
3
bds
|
1
ba
|
1,152
sqft
|
built
1916
3715 Lyndale Ave N, Minneapolis, MN 55412
$293
Cash flow
6.6%
Cash-on-Cash Return
7.2%
Cap rate
1.0%
Rent to Value Ratio
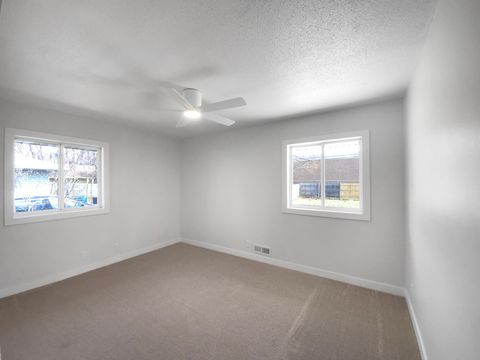
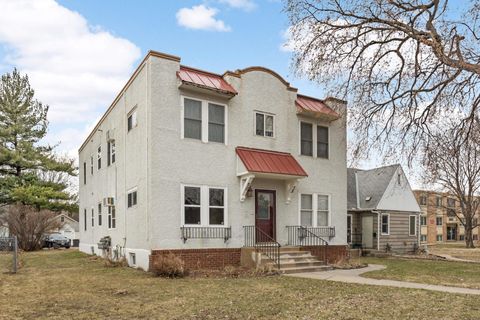
Pending
$250,000
4
bds
|
1
ba
|
1,396
sqft
|
built
1915
1920 Sheridan Ave N, Minneapolis, MN 55411
$285
Cash flow
5.9%
Cash-on-Cash Return
7.0%
Cap rate
1.0%
Rent to Value Ratio
990 out of 1,198 properties for sale in Minneapolis, MN
Limited Results Shown
Create a free account, or log in to reveal all property listings and enjoy the complete experience.
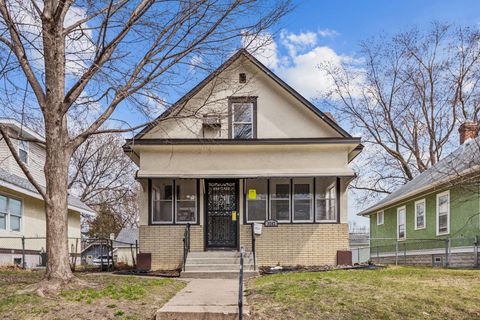
Active
$365,000
3
bds
|
2
ba
|
1,619
sqft
|
built
1960
11601 Wren St NW, Minneapolis, MN 55433
$-206
Cash flow
-2.9%
Cash-on-Cash Return
5.0%
Cap rate
0.7%
Rent to Value Ratio
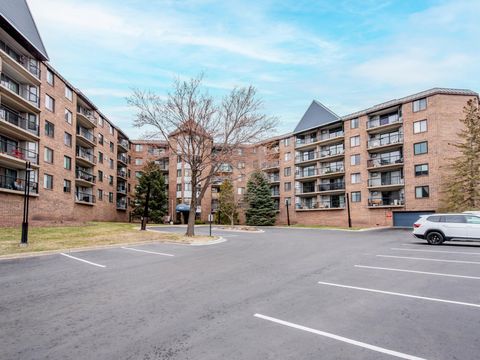
Active
$219,900
3
bds
|
2
ba
|
1,252
sqft
|
built
1912
3242 Logan Ave N, Minneapolis, MN 55412
$276
Cash flow
6.5%
Cash-on-Cash Return
7.2%
Cap rate
1.0%
Rent to Value Ratio
Active
$121,900
1
bds
|
1
ba
|
718
sqft
|
built
1985
2601 Kenzie Ter, Minneapolis, MN 55418
$-266
Cash flow
-11.4%
Cash-on-Cash Return
3.1%
Cap rate
1.1%
Rent to Value Ratio

Active
$154,000
1
bds
|
1
ba
|
687
sqft
|
built
1965
15 S 1st St, Minneapolis, MN 55401
$-386
Cash flow
-13.1%
Cash-on-Cash Return
2.7%
Cap rate
1.0%
Rent to Value Ratio
Active
$299,000
1
bds
|
2
ba
|
1,000
sqft
|
built
2007
929 Portland Ave, Minneapolis, MN 55404
$-923
Cash flow
-16.1%
Cash-on-Cash Return
2.0%
Cap rate
0.8%
Rent to Value Ratio
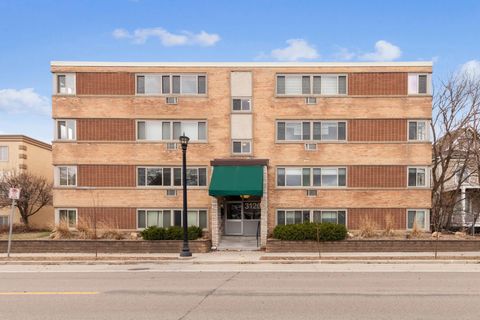
Active
$123,000
1
bds
|
1
ba
|
640
sqft
|
built
1958
3120 Hennepin Ave, Minneapolis, MN 55408
$-509
Cash flow
-21.6%
Cash-on-Cash Return
0.7%
Cap rate
1.0%
Rent to Value Ratio
Active
$332,500
5
bds
|
3
ba
|
2,671
sqft
|
built
1905
2939 Girard Ave N, Minneapolis, MN 55411
$-577
Cash flow
-9.1%
Cash-on-Cash Return
3.6%
Cap rate
0.6%
Rent to Value Ratio
Active
$219,900
2
bds
|
2
ba
|
1,139
sqft
|
built
2006
2900 11th Ave S, Minneapolis, MN 55407
$-547
Cash flow
-13.0%
Cash-on-Cash Return
2.7%
Cap rate
0.9%
Rent to Value Ratio

Active
$459,900
2
bds
|
4
ba
|
1,441
sqft
|
built
1981
2726 Humboldt Ave S, Minneapolis, MN 55408
$-1,020
Cash flow
-11.6%
Cash-on-Cash Return
3.0%
Cap rate
0.6%
Rent to Value Ratio

Active
$158,500
2
bds
|
1
ba
|
837
sqft
|
built
1883
2500 Aldrich Ave S, Minneapolis, MN 55405
$-119
Cash flow
-3.9%
Cash-on-Cash Return
4.8%
Cap rate
1.0%
Rent to Value Ratio
Active
$190,000
2
bds
|
1
ba
|
993
sqft
|
built
1900
1802 4th Ave S, Minneapolis, MN 55404
$-343
Cash flow
-9.4%
Cash-on-Cash Return
3.5%
Cap rate
0.9%
Rent to Value Ratio

Active
$195,000
2
bds
|
1
ba
|
852
sqft
|
built
2007
2929 21st Ave S, Minneapolis, MN 55407
$-320
Cash flow
-8.6%
Cash-on-Cash Return
3.7%
Cap rate
0.9%
Rent to Value Ratio

Active
$540,000
5
bds
|
3
ba
|
2,833
sqft
|
built
1957
6045 Penn Ave S, Minneapolis, MN 55419
$-1,548
Cash flow
-15.0%
Cash-on-Cash Return
2.2%
Cap rate
0.4%
Rent to Value Ratio
Pending
$250,000
4
bds
|
1
ba
|
1,396
sqft
|
built
1915
1920 Sheridan Ave N, Minneapolis, MN 55411
$285
Cash flow
5.9%
Cash-on-Cash Return
7.0%
Cap rate
1.0%
Rent to Value Ratio
Active
$799,900
2
bds
|
3
ba
|
1,970
sqft
|
built
2004
150 2nd St NE, Minneapolis, MN 55413
$-3,758
Cash flow
-24.5%
Cash-on-Cash Return
0.0%
Cap rate
0.5%
Rent to Value Ratio
Active
$97,900
bds
|
1
ba
|
433
sqft
|
built
1925
1820 1st Ave S, Minneapolis, MN 55403
$-210
Cash flow
-11.2%
Cash-on-Cash Return
3.1%
Cap rate
1.2%
Rent to Value Ratio
Active
$135,000
2
bds
|
1
ba
|
734
sqft
|
built
1913
1707 Stevens Ave, Minneapolis, MN 55403
$-263
Cash flow
-10.2%
Cash-on-Cash Return
3.3%
Cap rate
1.0%
Rent to Value Ratio
Pending
$295,000
3
bds
|
1
ba
|
1,309
sqft
|
built
1923
3717 27th Ave S, Minneapolis, MN 55406
$-78
Cash flow
-1.4%
Cash-on-Cash Return
5.4%
Cap rate
0.8%
Rent to Value Ratio
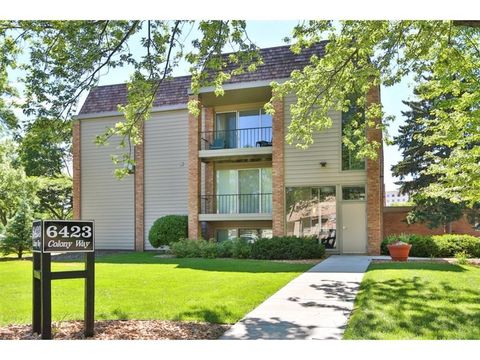
Active
$149,900
1
bds
|
1
ba
|
720
sqft
|
built
1964
6423 Colony Way, Minneapolis, MN 55435
$-167
Cash flow
-5.8%
Cash-on-Cash Return
4.3%
Cap rate
1.1%
Rent to Value Ratio
Active
$274,900
1
bds
|
1
ba
|
1,041
sqft
|
built
1926
521 S 7th St, Minneapolis, MN 55415
$-737
Cash flow
-14.0%
Cash-on-Cash Return
2.5%
Cap rate
0.8%
Rent to Value Ratio

Active
$1,799,900
1
bds
|
2
ba
|
1,710
sqft
|
built
2022
255 Hennepin Ave, Minneapolis, MN 55401
$-10,156
Cash flow
-29.4%
Cash-on-Cash Return
-1.1%
Cap rate
0.3%
Rent to Value Ratio
Active
$359,900
1
bds
|
2
ba
|
1,547
sqft
|
built
1928
730 Stinson Blvd, Minneapolis, MN 55413
$-792
Cash flow
-11.5%
Cash-on-Cash Return
3.0%
Cap rate
0.9%
Rent to Value Ratio
Active
$325,000
1
bds
|
1
ba
|
930
sqft
|
built
1920
700 Washington Ave N, Minneapolis, MN 55401
$-662
Cash flow
-10.6%
Cash-on-Cash Return
3.2%
Cap rate
0.8%
Rent to Value Ratio
Active
$359,000
3
bds
|
2
ba
|
1,258
sqft
|
built
1909
850 22nd Ave SE, Minneapolis, MN 55414
$-942
Cash flow
-13.7%
Cash-on-Cash Return
2.5%
Cap rate
0.5%
Rent to Value Ratio
Active
$259,900
4
bds
|
1
ba
|
1,854
sqft
|
built
1913
2910 Newton Ave N, Minneapolis, MN 55411
$-39
Cash flow
-0.8%
Cash-on-Cash Return
5.5%
Cap rate
0.8%
Rent to Value Ratio

Active
$1,575,000
3
bds
|
4
ba
|
3,146
sqft
|
built
2005
101 Main St NE, Minneapolis, MN 55413
$-7,973
Cash flow
-26.4%
Cash-on-Cash Return
-0.4%
Cap rate
0.3%
Rent to Value Ratio
Active
$229,900
1
bds
|
1
ba
|
780
sqft
|
built
2006
929 Portland Ave, Minneapolis, MN 55404
$-337
Cash flow
-7.6%
Cash-on-Cash Return
3.9%
Cap rate
1.0%
Rent to Value Ratio
Active
$249,900
2
bds
|
2
ba
|
927
sqft
|
built
2006
929 Portland Ave, Minneapolis, MN 55404
$-769
Cash flow
-16.1%
Cash-on-Cash Return
2.0%
Cap rate
0.8%
Rent to Value Ratio

Active
$1,995,000
2
bds
|
3
ba
|
2,181
sqft
|
built
2022
1111 W River Pkwy, Minneapolis, MN 55415
$-9,940
Cash flow
-26.0%
Cash-on-Cash Return
-0.3%
Cap rate
0.2%
Rent to Value Ratio

Active
$249,900
1
bds
|
1
ba
|
843
sqft
|
built
1926
521 S 7th St, Minneapolis, MN 55415
$-592
Cash flow
-12.4%
Cash-on-Cash Return
2.8%
Cap rate
0.7%
Rent to Value Ratio
Active
$229,900
3
bds
|
1
ba
|
1,152
sqft
|
built
1916
3715 Lyndale Ave N, Minneapolis, MN 55412
$293
Cash flow
6.6%
Cash-on-Cash Return
7.2%
Cap rate
1.0%
Rent to Value Ratio
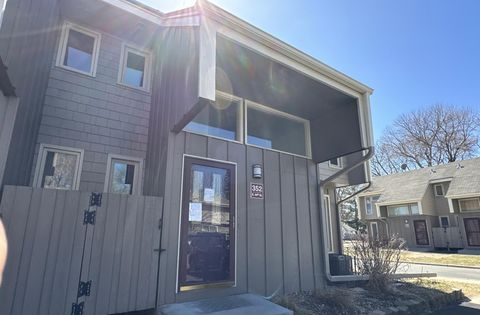
Active
$209,900
3
bds
|
2
ba
|
1,393
sqft
|
built
1972
352 E 44th St, Minneapolis, MN 55409
$-111
Cash flow
-2.8%
Cash-on-Cash Return
5.0%
Cap rate
1.1%
Rent to Value Ratio
Active
$450,000
1
bds
|
1
ba
|
1,493
sqft
|
built
2007
3104 W Lake St, Minneapolis, MN 55416
$-1,307
Cash flow
-15.2%
Cash-on-Cash Return
2.2%
Cap rate
0.8%
Rent to Value Ratio

Active
$285,000
2
bds
|
2
ba
|
1,027
sqft
|
built
1926
521 S 7th St, Minneapolis, MN 55415
$-780
Cash flow
-14.3%
Cash-on-Cash Return
2.4%
Cap rate
0.7%
Rent to Value Ratio
Active
$119,900
1
bds
|
1
ba
|
637
sqft
|
built
1971
2446 Aldrich Ave S, Minneapolis, MN 55405
$-241
Cash flow
-10.5%
Cash-on-Cash Return
3.3%
Cap rate
0.9%
Rent to Value Ratio
Active
$875,000
10
bds
|
4
ba
|
2,679
sqft
|
built
1900
629 Oak St SE, Minneapolis, MN 55414
$-3,103
Cash flow
-18.5%
Cash-on-Cash Return
1.4%
Cap rate
0.3%
Rent to Value Ratio
Active
$297,900
2
bds
|
2
ba
|
1,355
sqft
|
built
1995
15635 24th Ave N, Minneapolis, MN 55447
$-448
Cash flow
-7.8%
Cash-on-Cash Return
3.9%
Cap rate
0.8%
Rent to Value Ratio
Active
$109,900
2
bds
|
1
ba
|
1,025
sqft
|
built
1980
2930 Blaisdell Ave, Minneapolis, MN 55408
$52
Cash flow
2.5%
Cash-on-Cash Return
6.2%
Cap rate
1.6%
Rent to Value Ratio
Active
$659,000
8
bds
|
4
ba
|
2,912
sqft
|
built
1929
4348 Minnehaha Ave, Minneapolis, MN 55406
$-2,494
Cash flow
-19.7%
Cash-on-Cash Return
1.1%
Cap rate
0.3%
Rent to Value Ratio
Active
$115,000
1
bds
|
1
ba
|
640
sqft
|
built
1973
1920 S 1st St, Minneapolis, MN 55454
$-340
Cash flow
-15.4%
Cash-on-Cash Return
2.1%
Cap rate
1.3%
Rent to Value Ratio