Minneapolis, MN Investment Properties for Sale
Browse homes for sale and investment properties in Minneapolis, MN. Refine your search by price, property type, or more.
Best cash flowing properties in Minneapolis, MN
Active
$200,000
3
bds
|
1
ba
|
1,392
sqft
|
built
1912
3842 Fremont Ave N, Minneapolis, MN 55412
$328
Cash flow
8.6%
Cash-on-Cash Return
7.6%
Cap rate
1.0%
Rent to Value Ratio
Active
$349,000
4
bds
|
2
ba
|
1,838
sqft
|
built
1900
3148 3rd Ave S, Minneapolis, MN 55408
$73
Cash flow
1.1%
Cash-on-Cash Return
5.9%
Cap rate
0.7%
Rent to Value Ratio
1,012 out of 1,224 properties for sale in Minneapolis, MN
Limited Results Shown
Create a free account, or log in to reveal all property listings and enjoy the complete experience.
Active
$590,000
4
bds
|
2
ba
|
3,687
sqft
|
built
1929
2925 Sunset Blvd, Minneapolis, MN 55416
$-1,710
Cash flow
-15.1%
Cash-on-Cash Return
2.2%
Cap rate
0.4%
Rent to Value Ratio
Active
$530,000
3
bds
|
3
ba
|
2,296
sqft
|
built
2011
12309 N Lake Blvd, Minneapolis, MN 55449
$-637
Cash flow
-6.3%
Cash-on-Cash Return
4.2%
Cap rate
0.7%
Rent to Value Ratio
Active
$87,000
1
bds
|
1
ba
|
686
sqft
|
built
1959
2500 Blaisdell Ave, Minneapolis, MN 55404
$-477
Cash flow
-28.6%
Cash-on-Cash Return
-0.9%
Cap rate
1.4%
Rent to Value Ratio
Active
$1,295,000
3
bds
|
3
ba
|
2,567
sqft
|
built
1952
5124 Drew Ave S, Minneapolis, MN 55410
$-3,032
Cash flow
-12.2%
Cash-on-Cash Return
2.9%
Cap rate
0.5%
Rent to Value Ratio
Active
$799,000
2
bds
|
3
ba
|
2,275
sqft
|
built
2007
3106 W Lake St, Minneapolis, MN 55416
$-2,950
Cash flow
-19.3%
Cash-on-Cash Return
1.2%
Cap rate
0.6%
Rent to Value Ratio
Active
$215,000
1
bds
|
1
ba
|
722
sqft
|
built
2006
2600 University Ave SE, Minneapolis, MN 55414
$-434
Cash flow
-10.5%
Cash-on-Cash Return
3.3%
Cap rate
0.8%
Rent to Value Ratio
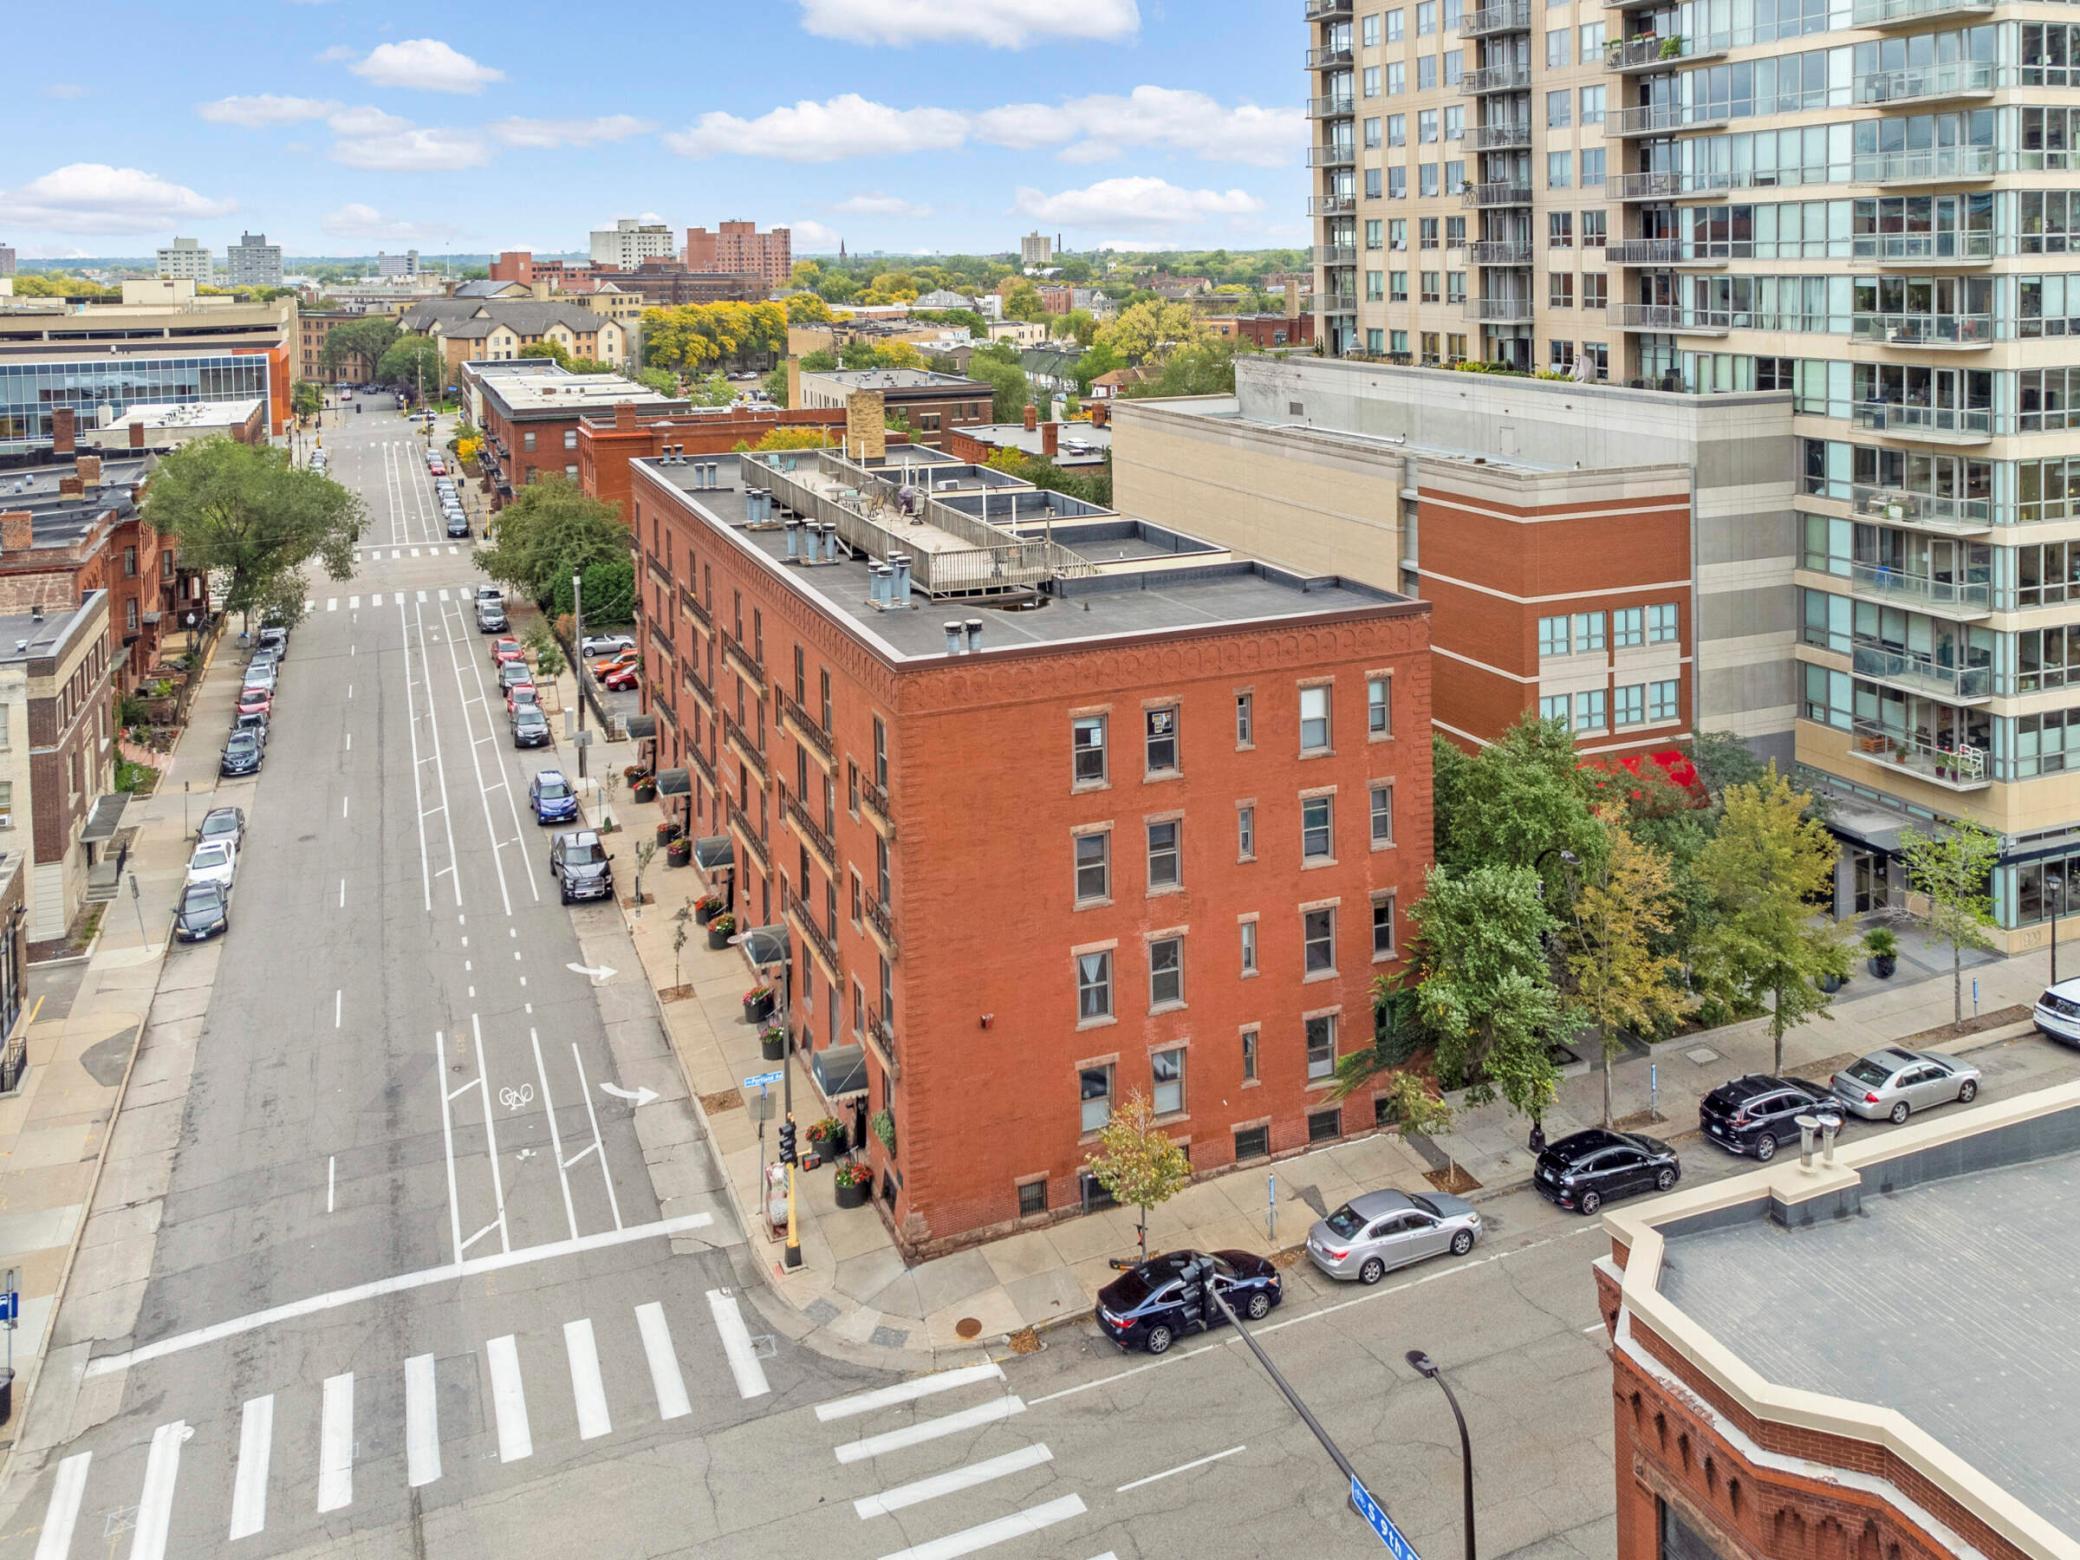
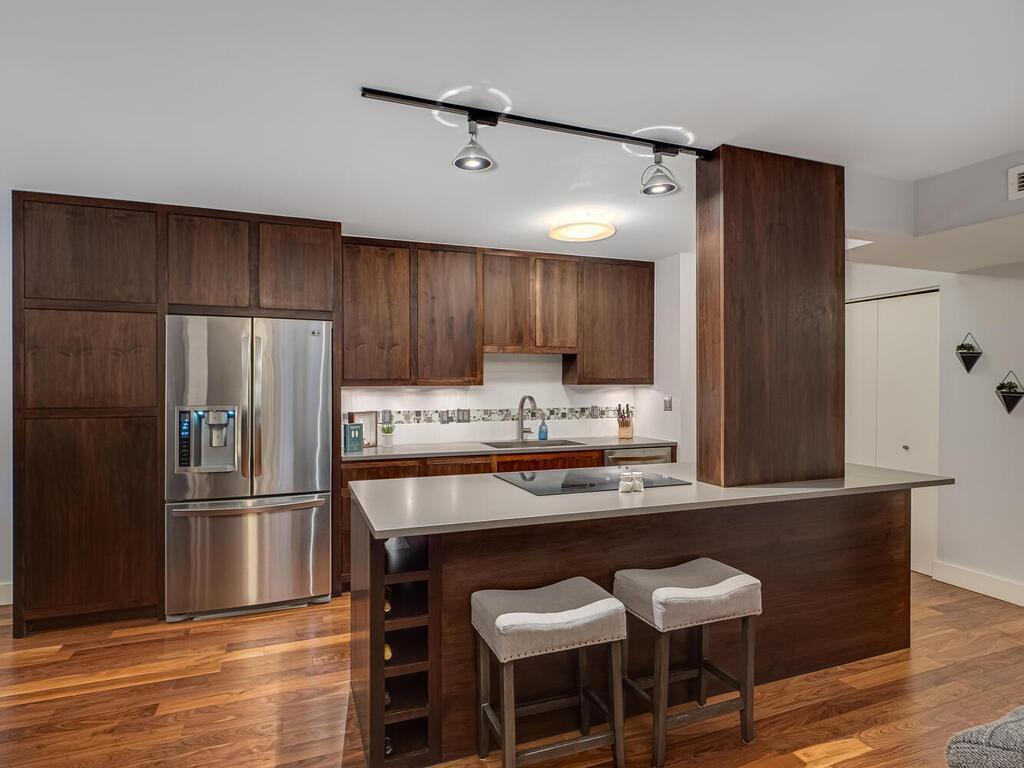
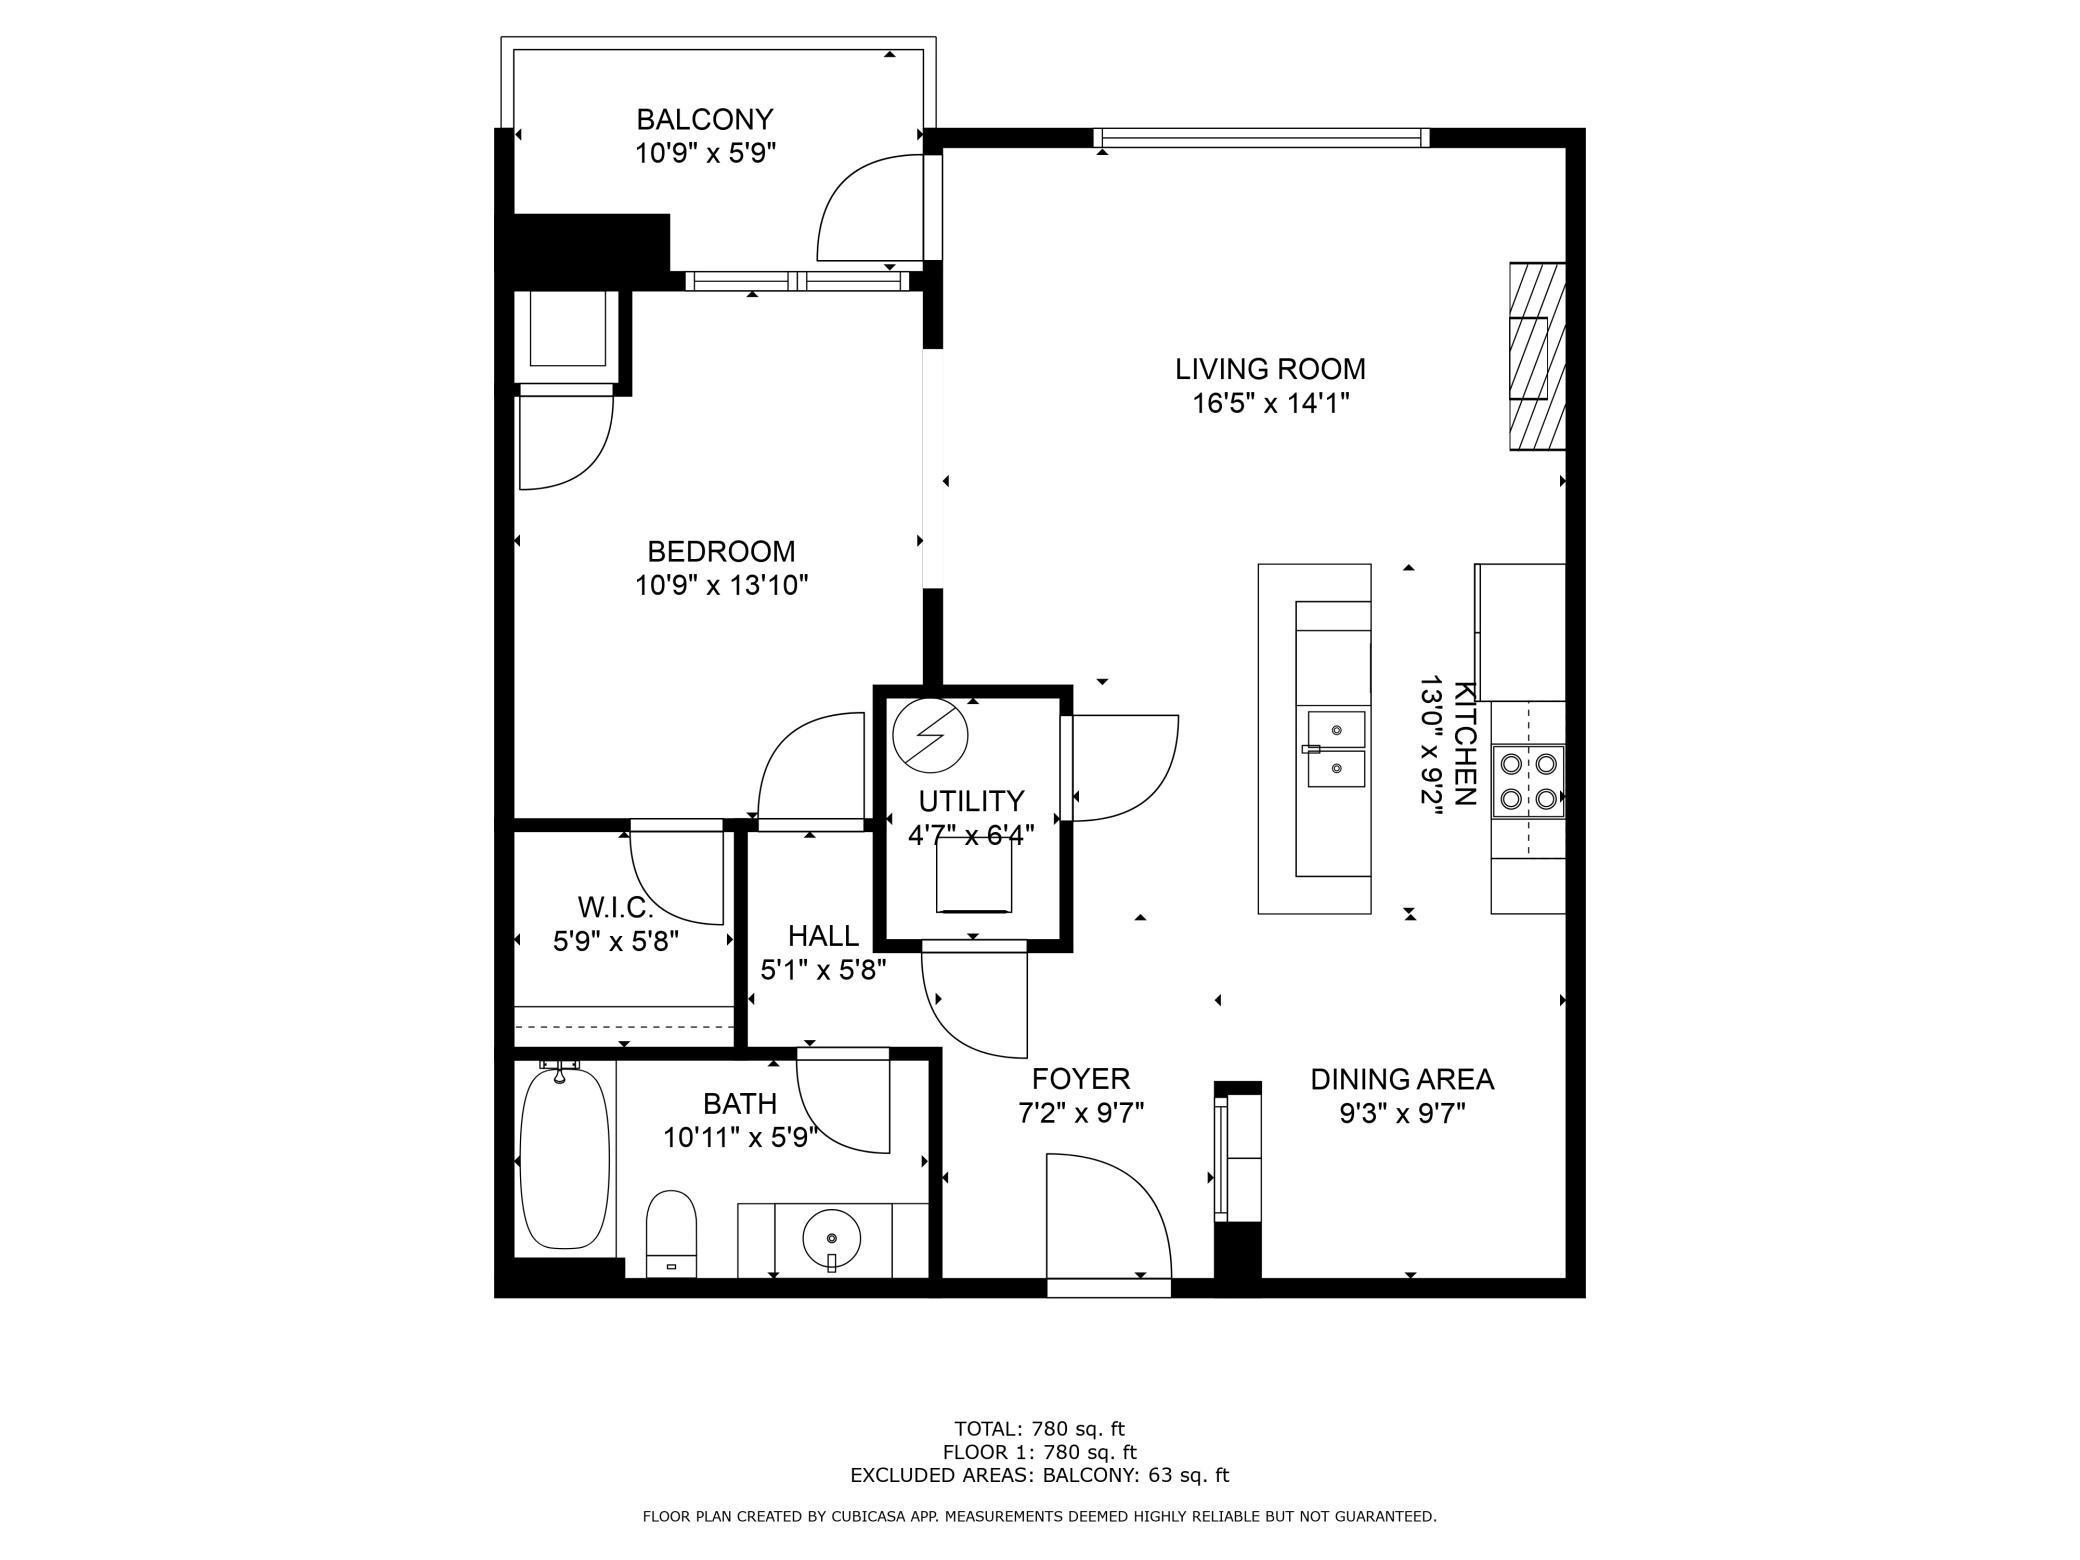
Active
$209,900
1
bds
|
1
ba
|
780
sqft
|
built
2006
929 Portland Ave, Minneapolis, MN 55404
$-518
Cash flow
-12.9%
Cash-on-Cash Return
2.7%
Cap rate
0.9%
Rent to Value Ratio
Active
$155,000
3
bds
|
1
ba
|
1,200
sqft
|
built
1914
3600 17th Ave S, Minneapolis, MN 55407
$-22
Cash flow
-0.7%
Cash-on-Cash Return
5.5%
Cap rate
1.2%
Rent to Value Ratio
Active
$200,000
3
bds
|
1
ba
|
1,392
sqft
|
built
1912
3842 Fremont Ave N, Minneapolis, MN 55412
$328
Cash flow
8.6%
Cash-on-Cash Return
7.6%
Cap rate
1.0%
Rent to Value Ratio

Active
$579,900
3
bds
|
2
ba
|
2,650
sqft
|
built
1906
1801 Fremont Ave S, Minneapolis, MN 55403
$-1,744
Cash flow
-15.7%
Cash-on-Cash Return
2.1%
Cap rate
0.6%
Rent to Value Ratio
Active
$180,000
2
bds
|
1
ba
|
675
sqft
|
built
1950
5049 Vincent Ave N, Minneapolis, MN 55430
$69
Cash flow
2.0%
Cash-on-Cash Return
6.1%
Cap rate
0.9%
Rent to Value Ratio
Active
$539,900
8
bds
|
4
ba
|
4,588
sqft
|
built
1916
1114 Irving Ave N, Minneapolis, MN 55411
$-1,800
Cash flow
-17.4%
Cash-on-Cash Return
1.7%
Cap rate
0.3%
Rent to Value Ratio
Active
$215,000
1
bds
|
1
ba
|
916
sqft
|
built
1983
20 2nd St NE, Minneapolis, MN 55413
$-822
Cash flow
-19.9%
Cash-on-Cash Return
1.1%
Cap rate
0.9%
Rent to Value Ratio
Active
$94,900
2
bds
|
1
ba
|
694
sqft
|
built
1961
1800 Lasalle Ave, Minneapolis, MN 55403
$-99
Cash flow
-5.4%
Cash-on-Cash Return
4.4%
Cap rate
1.5%
Rent to Value Ratio
Active
$395,000
2
bds
|
2
ba
|
1,460
sqft
|
built
1977
2950 Dean Pkwy, Minneapolis, MN 55416
$-1,807
Cash flow
-23.9%
Cash-on-Cash Return
0.2%
Cap rate
0.7%
Rent to Value Ratio
Active
$204,900
1
bds
|
1
ba
|
813
sqft
|
built
1983
20 2nd St NE, Minneapolis, MN 55413
$-865
Cash flow
-22.0%
Cash-on-Cash Return
0.6%
Cap rate
0.9%
Rent to Value Ratio
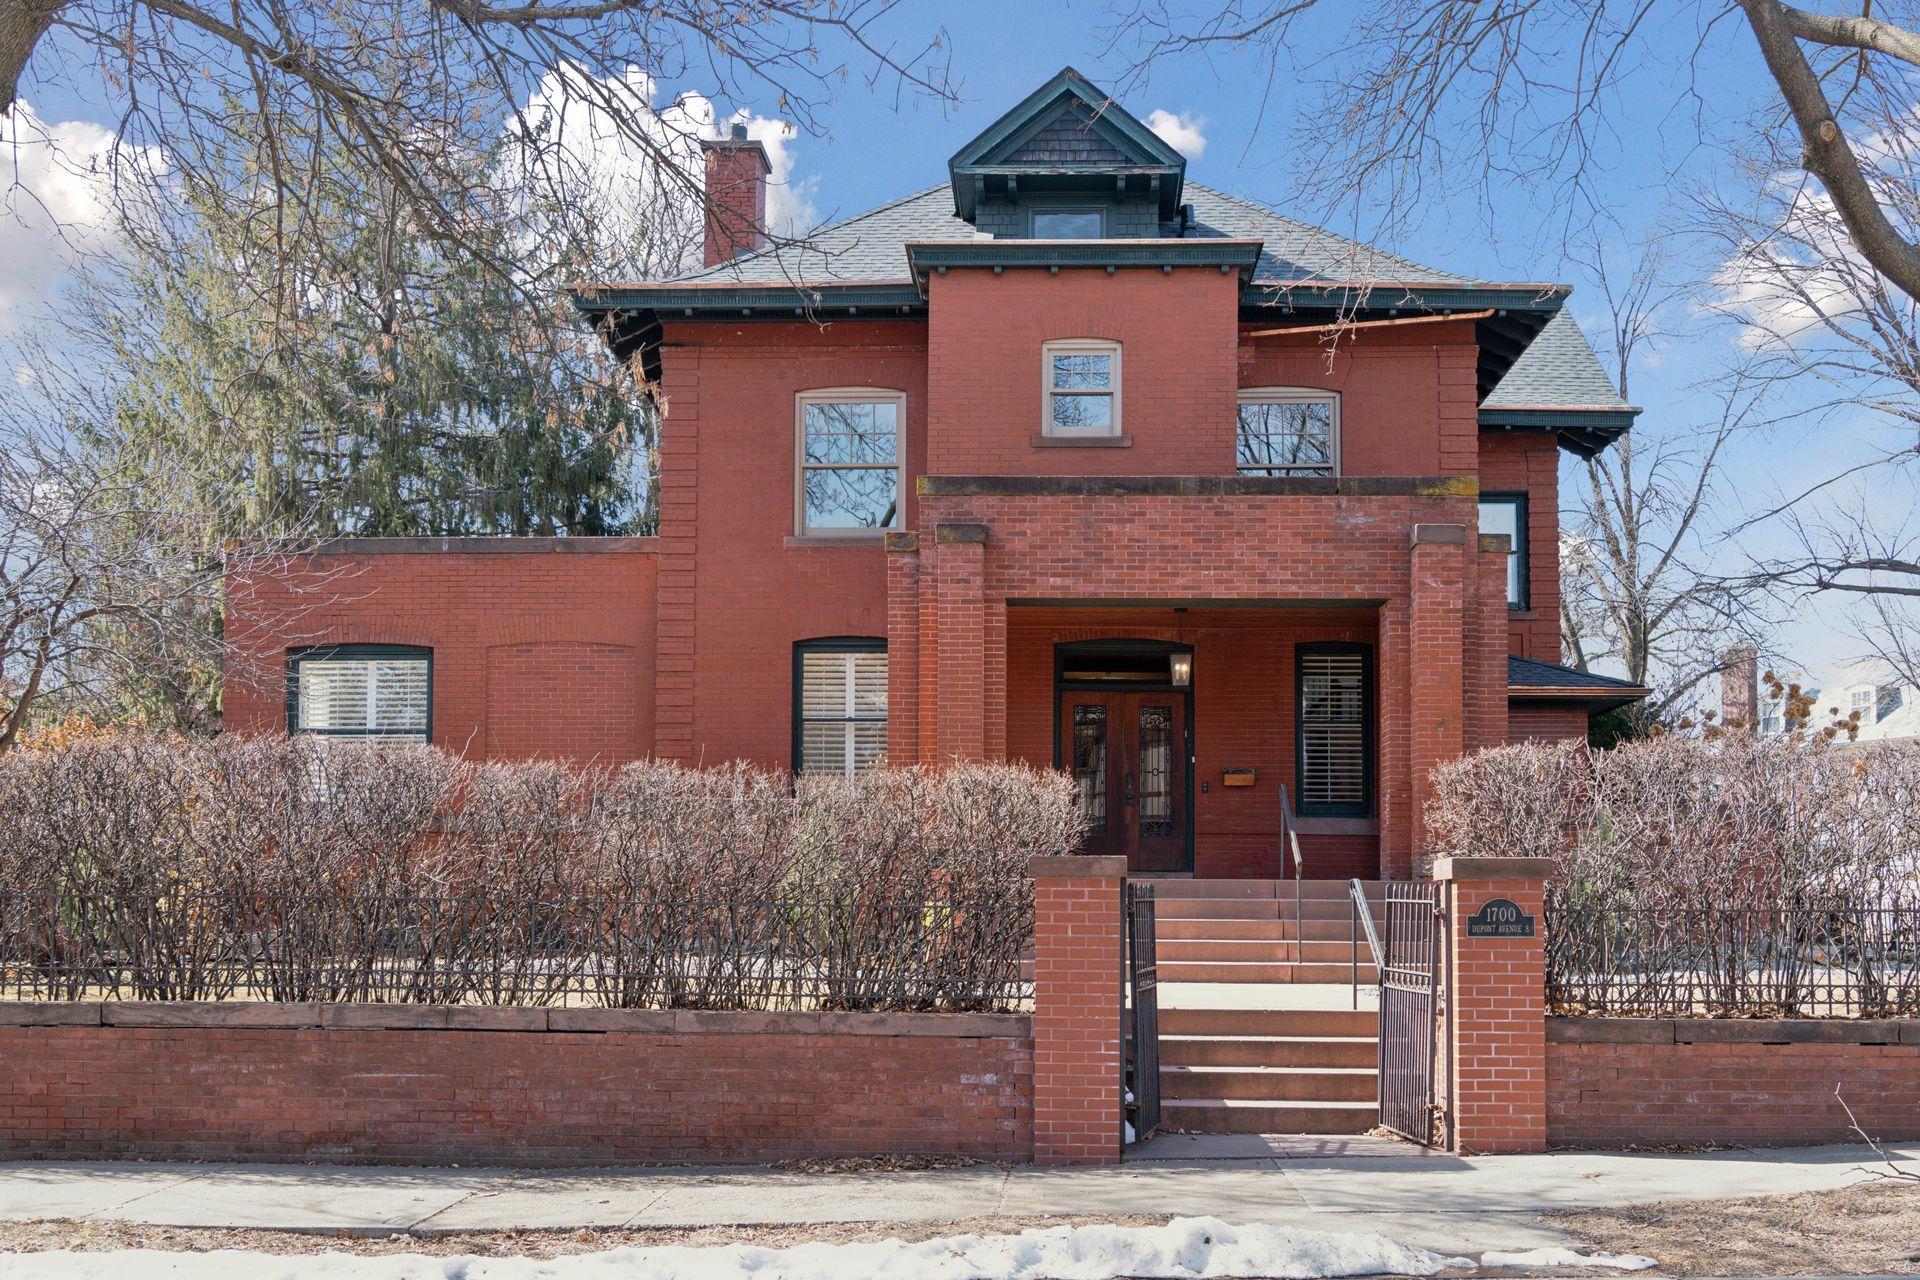
Active
$1,595,000
5
bds
|
5
ba
|
5,483
sqft
|
built
1900
1700 Dupont Ave S, Minneapolis, MN 55403
$-5,673
Cash flow
-18.6%
Cash-on-Cash Return
1.4%
Cap rate
0.4%
Rent to Value Ratio
Active
$155,000
1
bds
|
1
ba
|
675
sqft
|
built
1895
601 S 9th St, Minneapolis, MN 55404
$-140
Cash flow
-4.7%
Cash-on-Cash Return
4.6%
Cap rate
1.0%
Rent to Value Ratio
Active
$225,000
1
bds
|
1
ba
|
860
sqft
|
built
1977
1200 Nicollet Mall, Minneapolis, MN 55403
$-675
Cash flow
-15.7%
Cash-on-Cash Return
2.1%
Cap rate
0.9%
Rent to Value Ratio
Active
$240,000
1
bds
|
1
ba
|
972
sqft
|
built
2006
3640 Wooddale Ave S, Minneapolis, MN 55416
$-604
Cash flow
-13.1%
Cash-on-Cash Return
2.7%
Cap rate
0.8%
Rent to Value Ratio
Active
$289,000
2
bds
|
1
ba
|
2,000
sqft
|
built
1926
521 S 7th St, Minneapolis, MN 55415
$-999
Cash flow
-18.0%
Cash-on-Cash Return
1.5%
Cap rate
1.0%
Rent to Value Ratio
Active
$129,000
1
bds
|
1
ba
|
739
sqft
|
built
1968
400 Groveland Ave, Minneapolis, MN 55403
$-256
Cash flow
-10.4%
Cash-on-Cash Return
3.3%
Cap rate
1.4%
Rent to Value Ratio
Active
$295,000
1
bds
|
1
ba
|
820
sqft
|
built
1920
700 Washington Ave N, Minneapolis, MN 55401
$-870
Cash flow
-15.4%
Cash-on-Cash Return
2.1%
Cap rate
0.7%
Rent to Value Ratio
Active
$1,200,000
5
bds
|
5
ba
|
3,925
sqft
|
built
1931
2833 Sunset Blvd, Minneapolis, MN 55416
$-2,836
Cash flow
-12.3%
Cash-on-Cash Return
2.8%
Cap rate
0.5%
Rent to Value Ratio
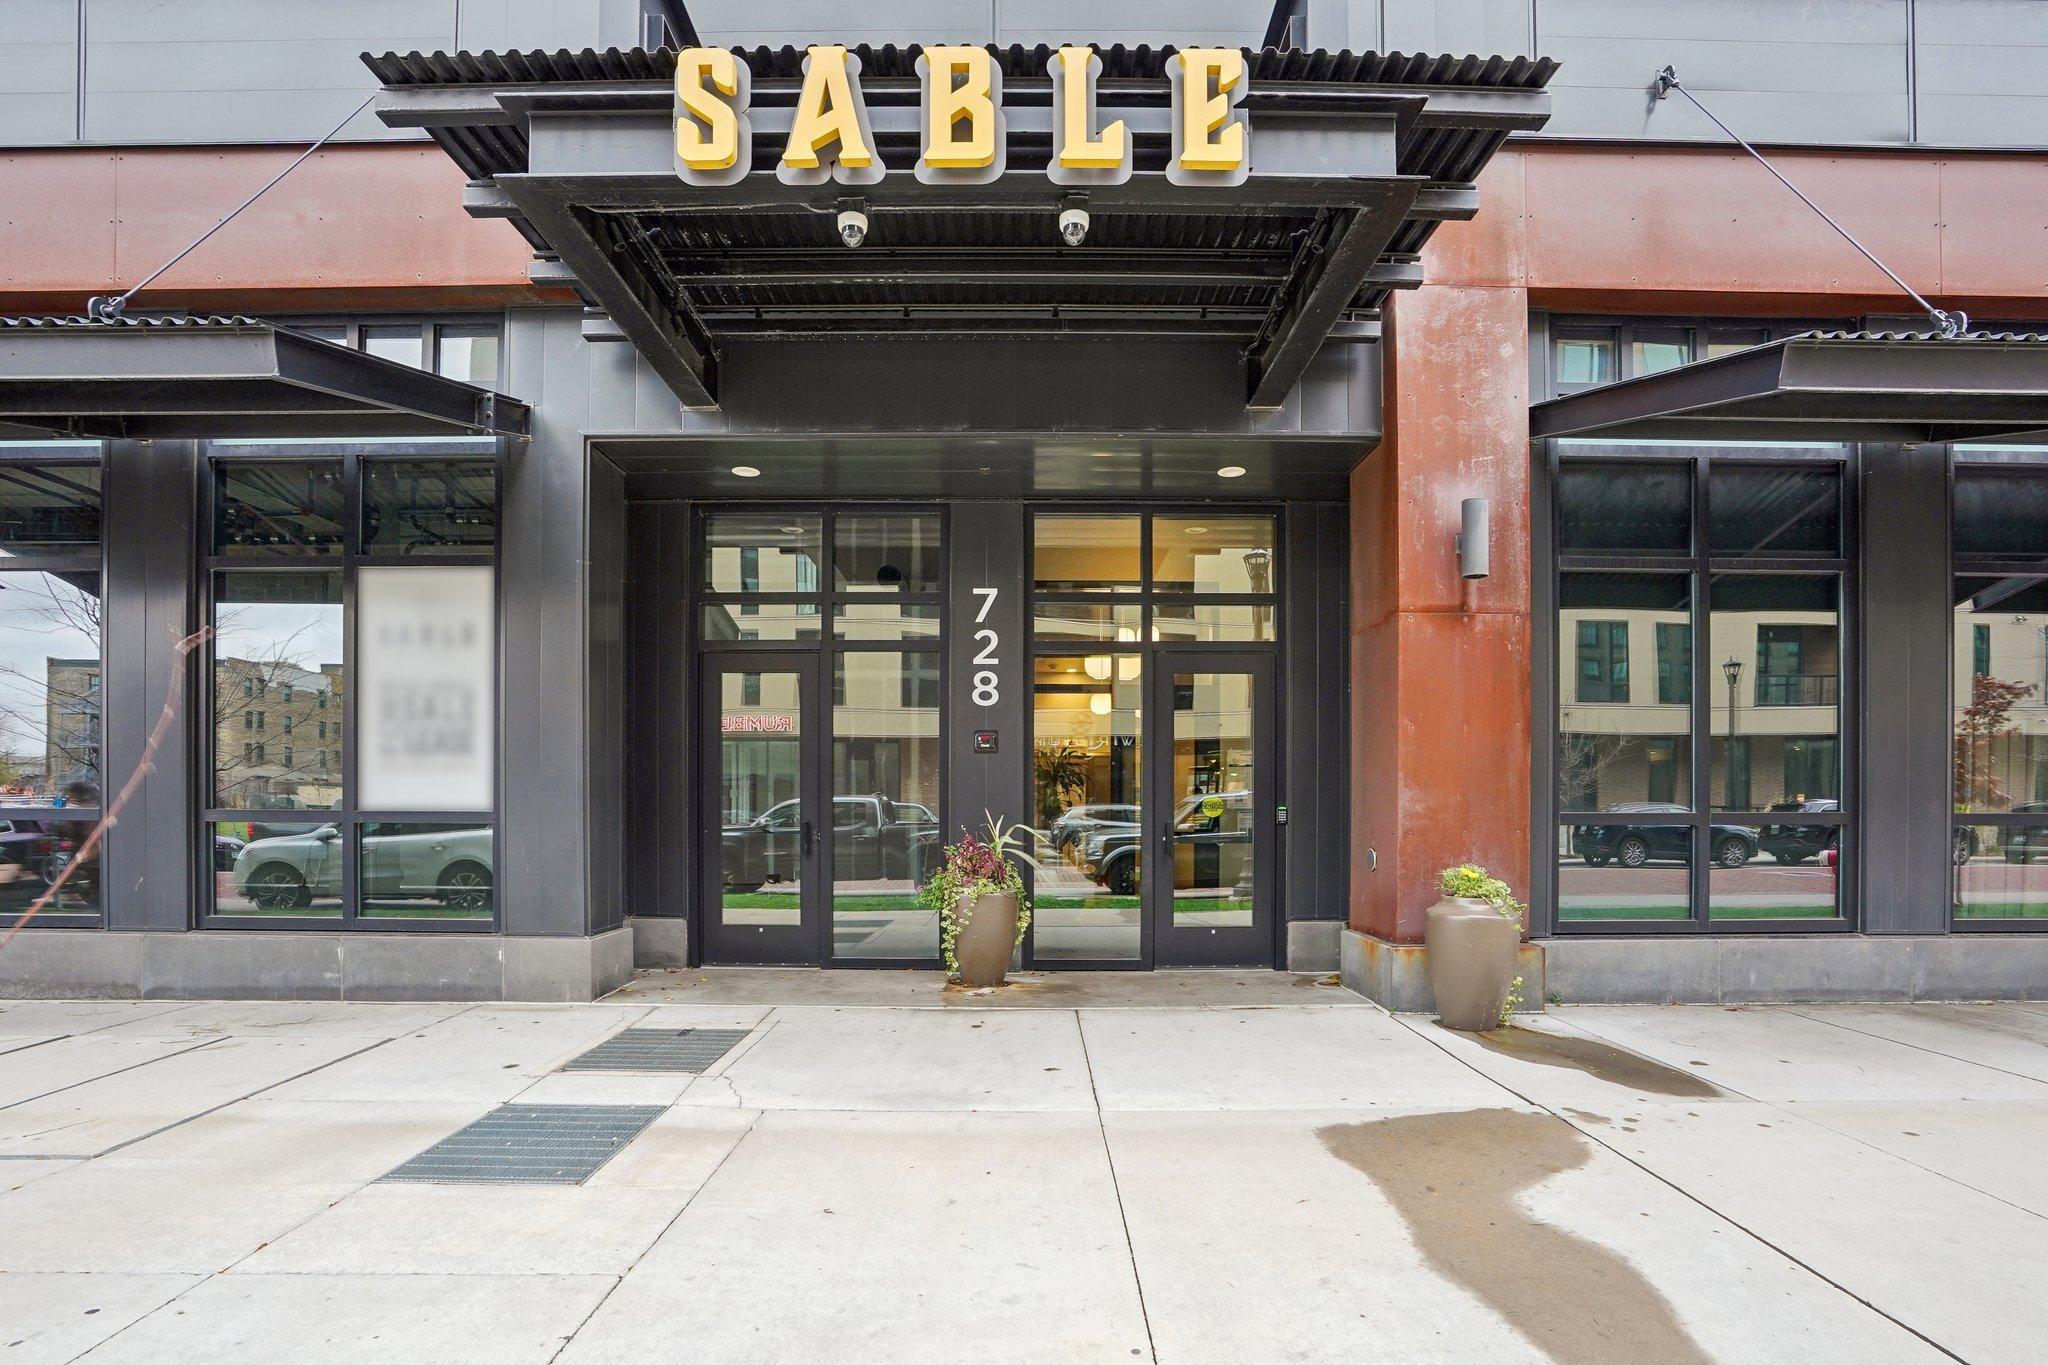
Active
$299,900
1
bds
|
1
ba
|
539
sqft
|
built
2019
728 3rd St N, Minneapolis, MN 55401
$-991
Cash flow
-17.2%
Cash-on-Cash Return
1.7%
Cap rate
0.6%
Rent to Value Ratio
Active
$605,000
6
bds
|
3
ba
|
3,260
sqft
|
built
1900
2541 3rd Ave S, Minneapolis, MN 55404
$-1,345
Cash flow
-11.6%
Cash-on-Cash Return
3.0%
Cap rate
0.4%
Rent to Value Ratio
Active
$780,000
4
bds
|
3
ba
|
3,121
sqft
|
built
1936
4937 Drew Ave S, Minneapolis, MN 55410
$-1,412
Cash flow
-9.4%
Cash-on-Cash Return
3.5%
Cap rate
0.6%
Rent to Value Ratio
Active
$198,000
3
bds
|
2
ba
|
1,466
sqft
|
built
1978
1225 Lasalle Ave, Minneapolis, MN 55403
$-957
Cash flow
-25.2%
Cash-on-Cash Return
-0.1%
Cap rate
1.3%
Rent to Value Ratio
Active
$479,900
4
bds
|
4
ba
|
2,688
sqft
|
built
1986
2107 5th Ave N, Minneapolis, MN 55405
$-1,132
Cash flow
-12.3%
Cash-on-Cash Return
2.8%
Cap rate
0.5%
Rent to Value Ratio
Active
$125,000
1
bds
|
1
ba
|
620
sqft
|
built
1966
3236 Garfield Ave, Minneapolis, MN 55408
$-229
Cash flow
-9.6%
Cash-on-Cash Return
3.5%
Cap rate
1.0%
Rent to Value Ratio
Active
$154,900
1
bds
|
1
ba
|
781
sqft
|
built
1900
330 E 18th St, Minneapolis, MN 55404
$-265
Cash flow
-8.9%
Cash-on-Cash Return
3.6%
Cap rate
1.0%
Rent to Value Ratio
Active
$434,900
2
bds
|
2
ba
|
1,566
sqft
|
built
2005
500 E Grant St, Minneapolis, MN 55404
$-1,647
Cash flow
-19.8%
Cash-on-Cash Return
1.1%
Cap rate
0.6%
Rent to Value Ratio
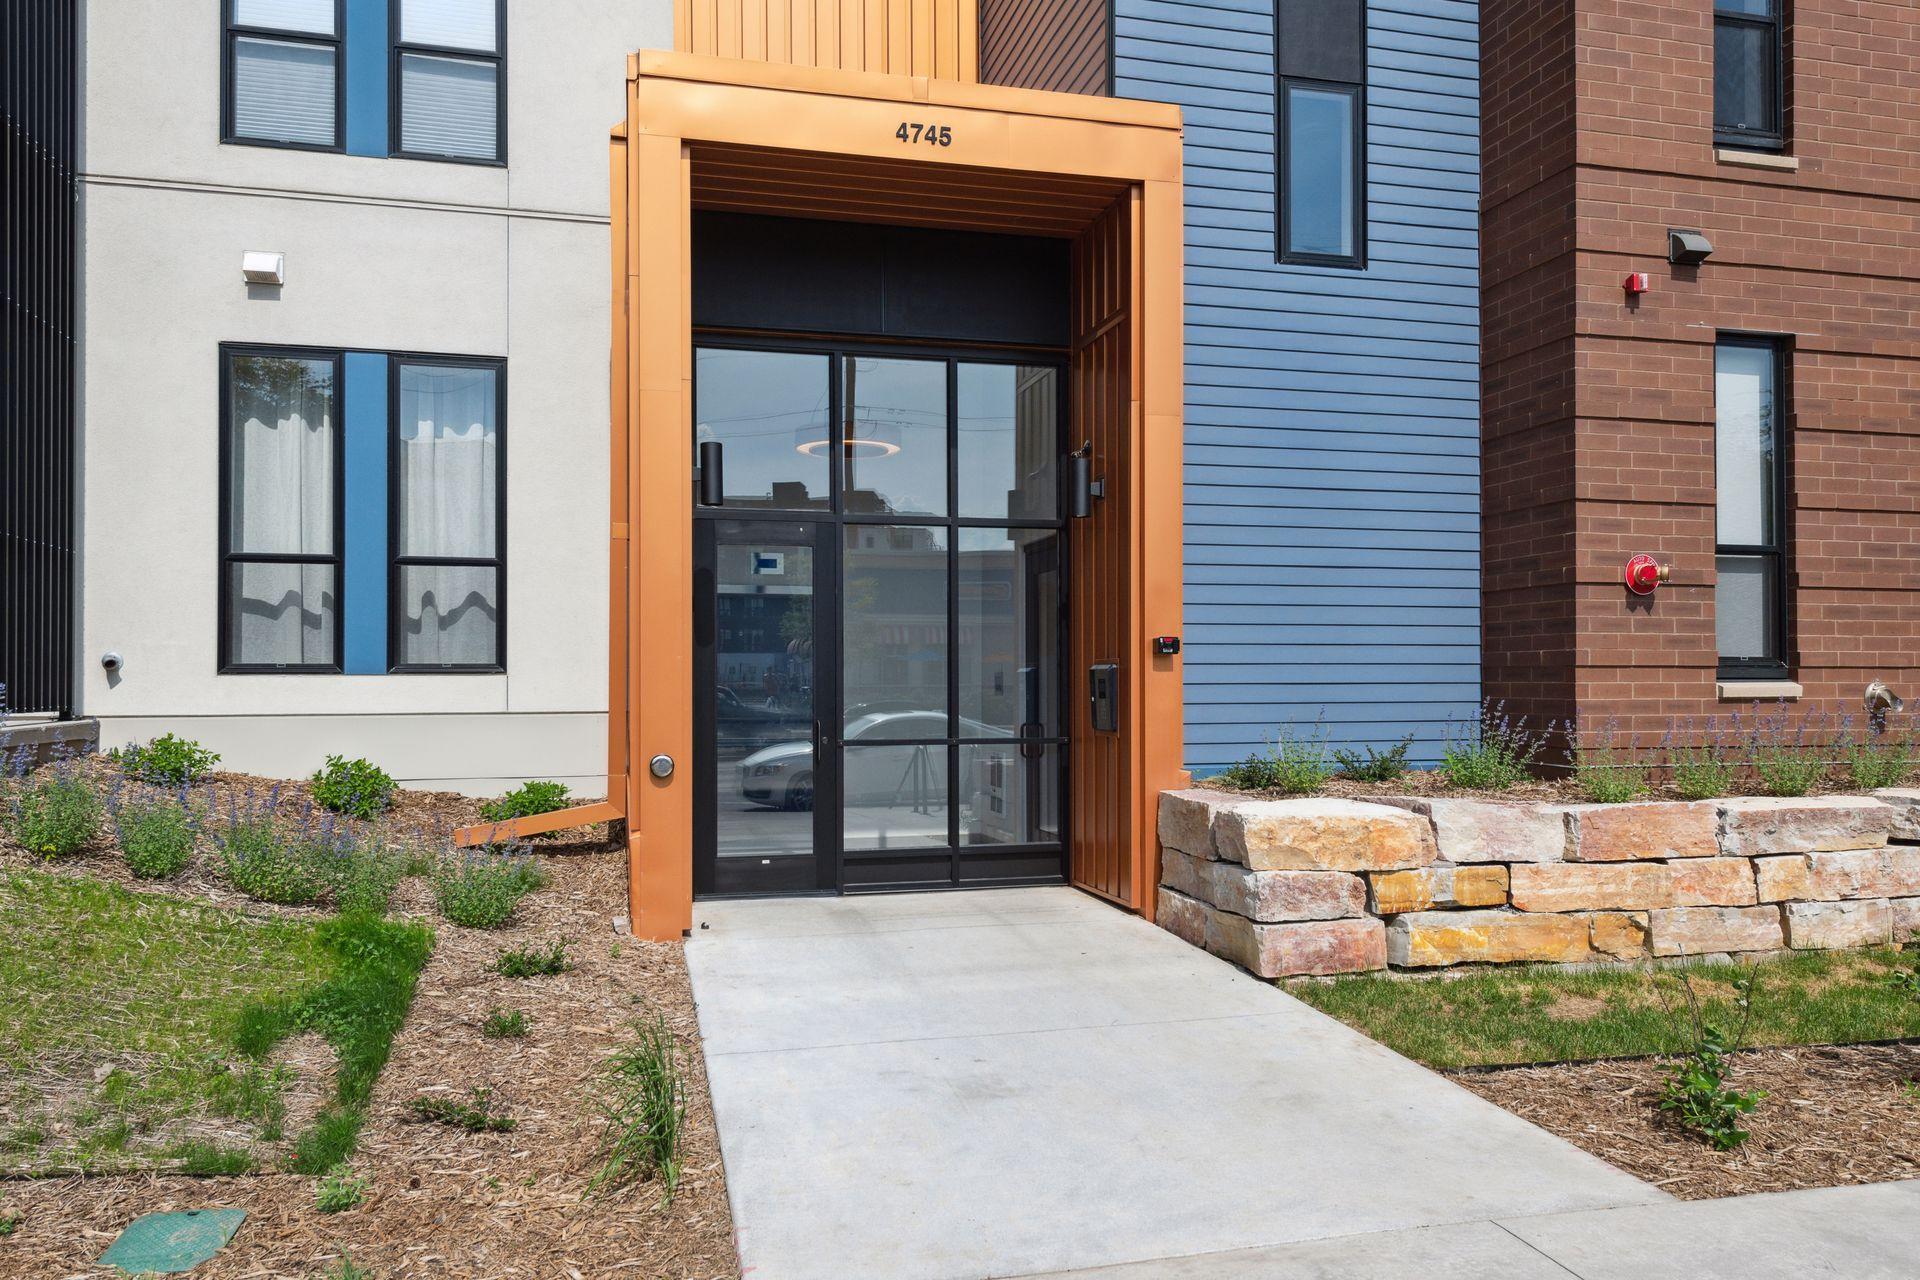
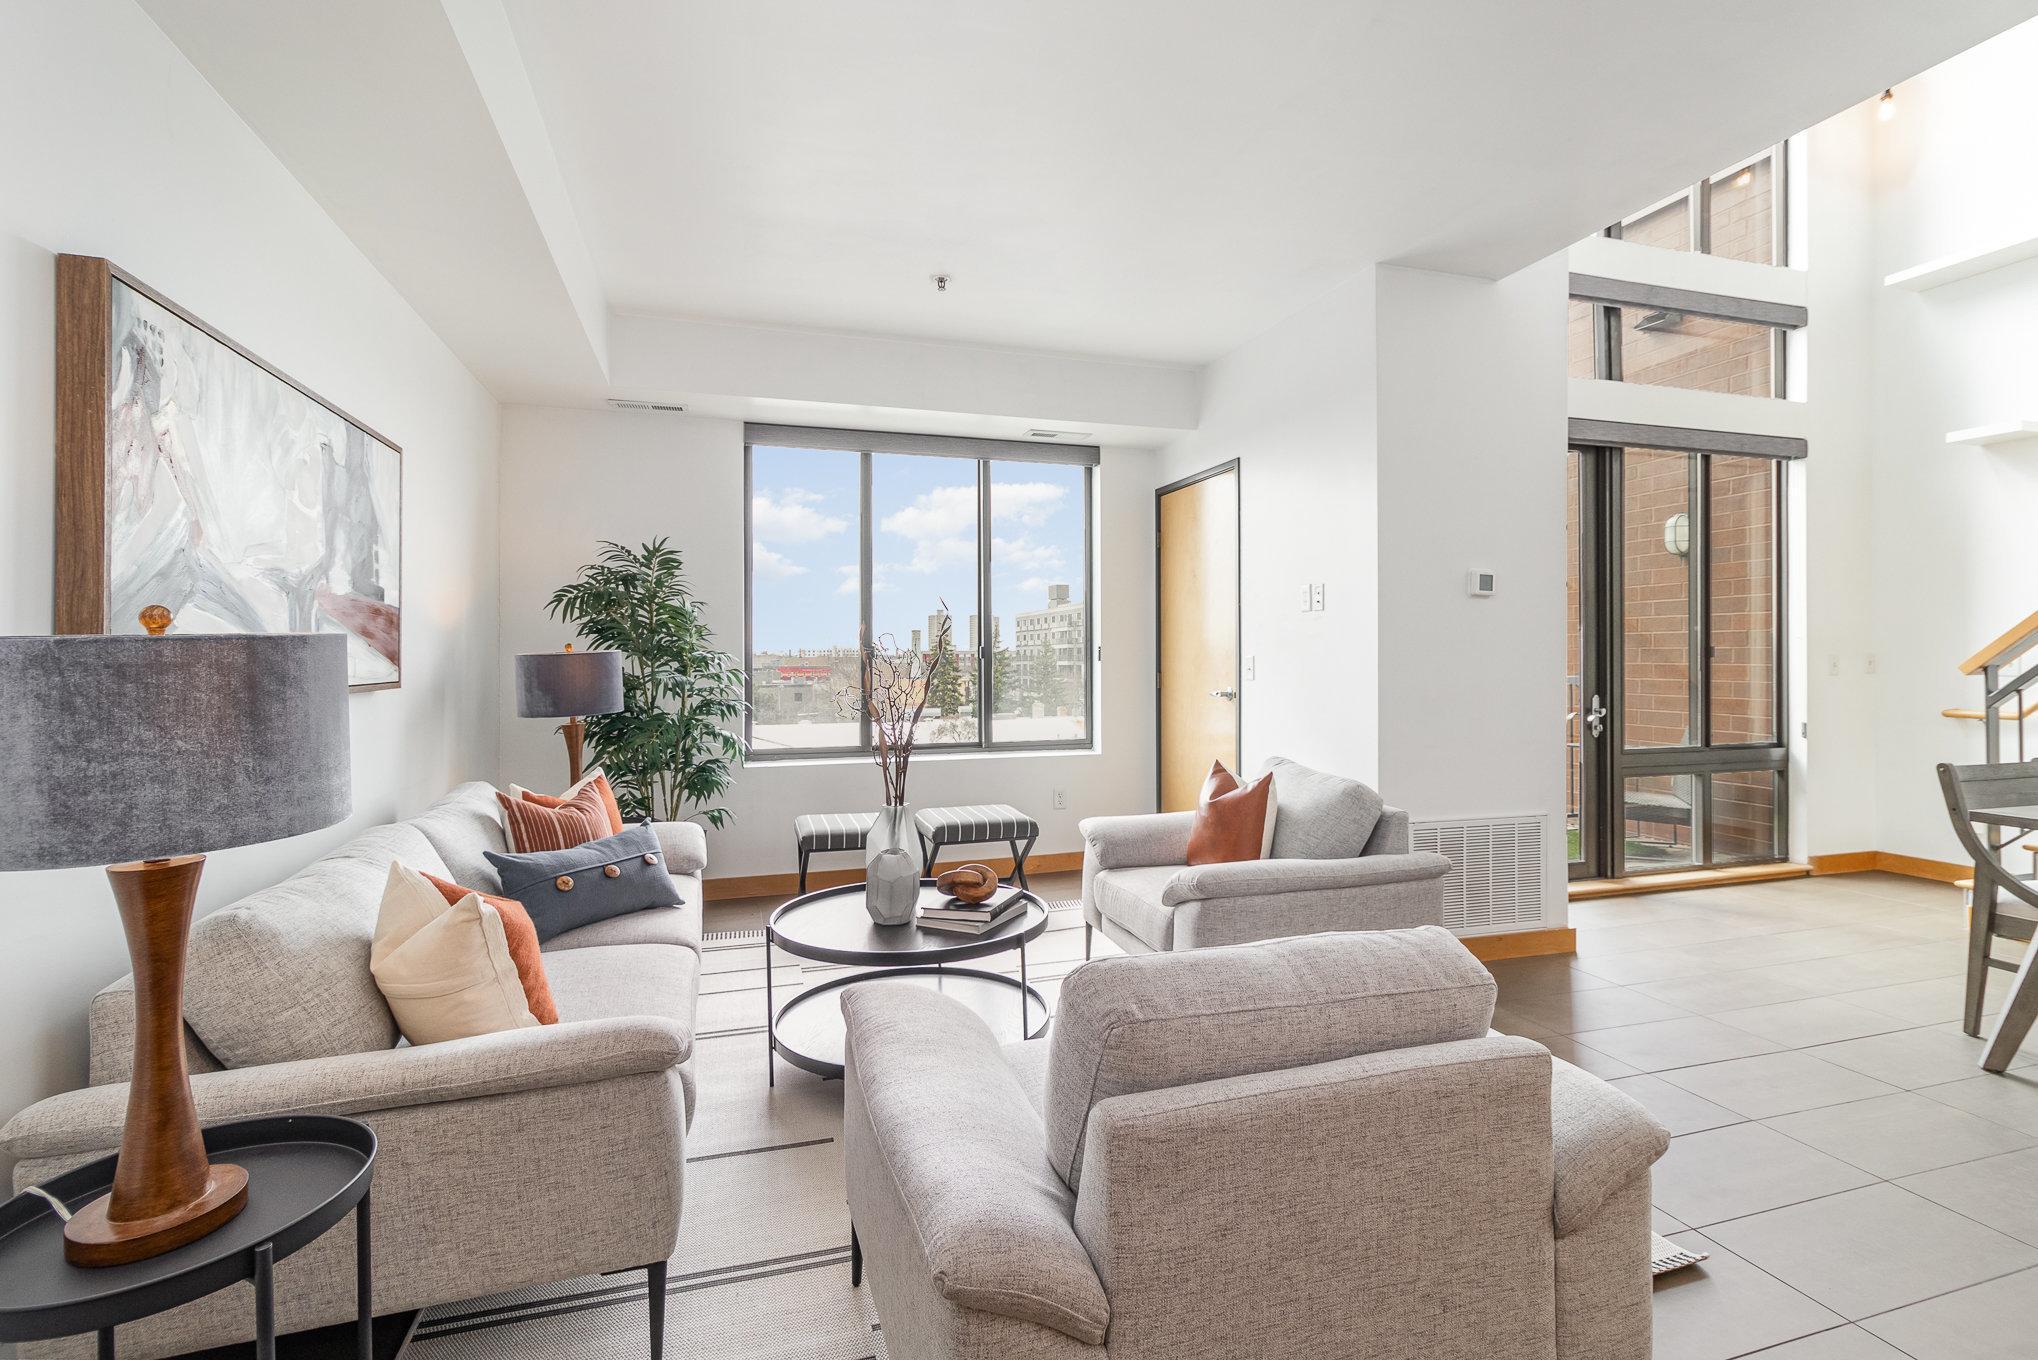
Active
$659,900
2
bds
|
3
ba
|
1,380
sqft
|
built
2022
4745 Minnehaha Ave, Minneapolis, MN 55406
$-1,496
Cash flow
-11.8%
Cash-on-Cash Return
3.0%
Cap rate
0.7%
Rent to Value Ratio
Active
$340,000
2
bds
|
3
ba
|
1,265
sqft
|
built
2005
10 E 26th St, Minneapolis, MN 55404
$-979
Cash flow
-15.0%
Cash-on-Cash Return
2.2%
Cap rate
0.8%
Rent to Value Ratio
Active
$375,000
4
bds
|
2
ba
|
2,032
sqft
|
built
1900
2628 14th Ave S, Minneapolis, MN 55407
$-257
Cash flow
-3.6%
Cash-on-Cash Return
4.9%
Cap rate
0.6%
Rent to Value Ratio
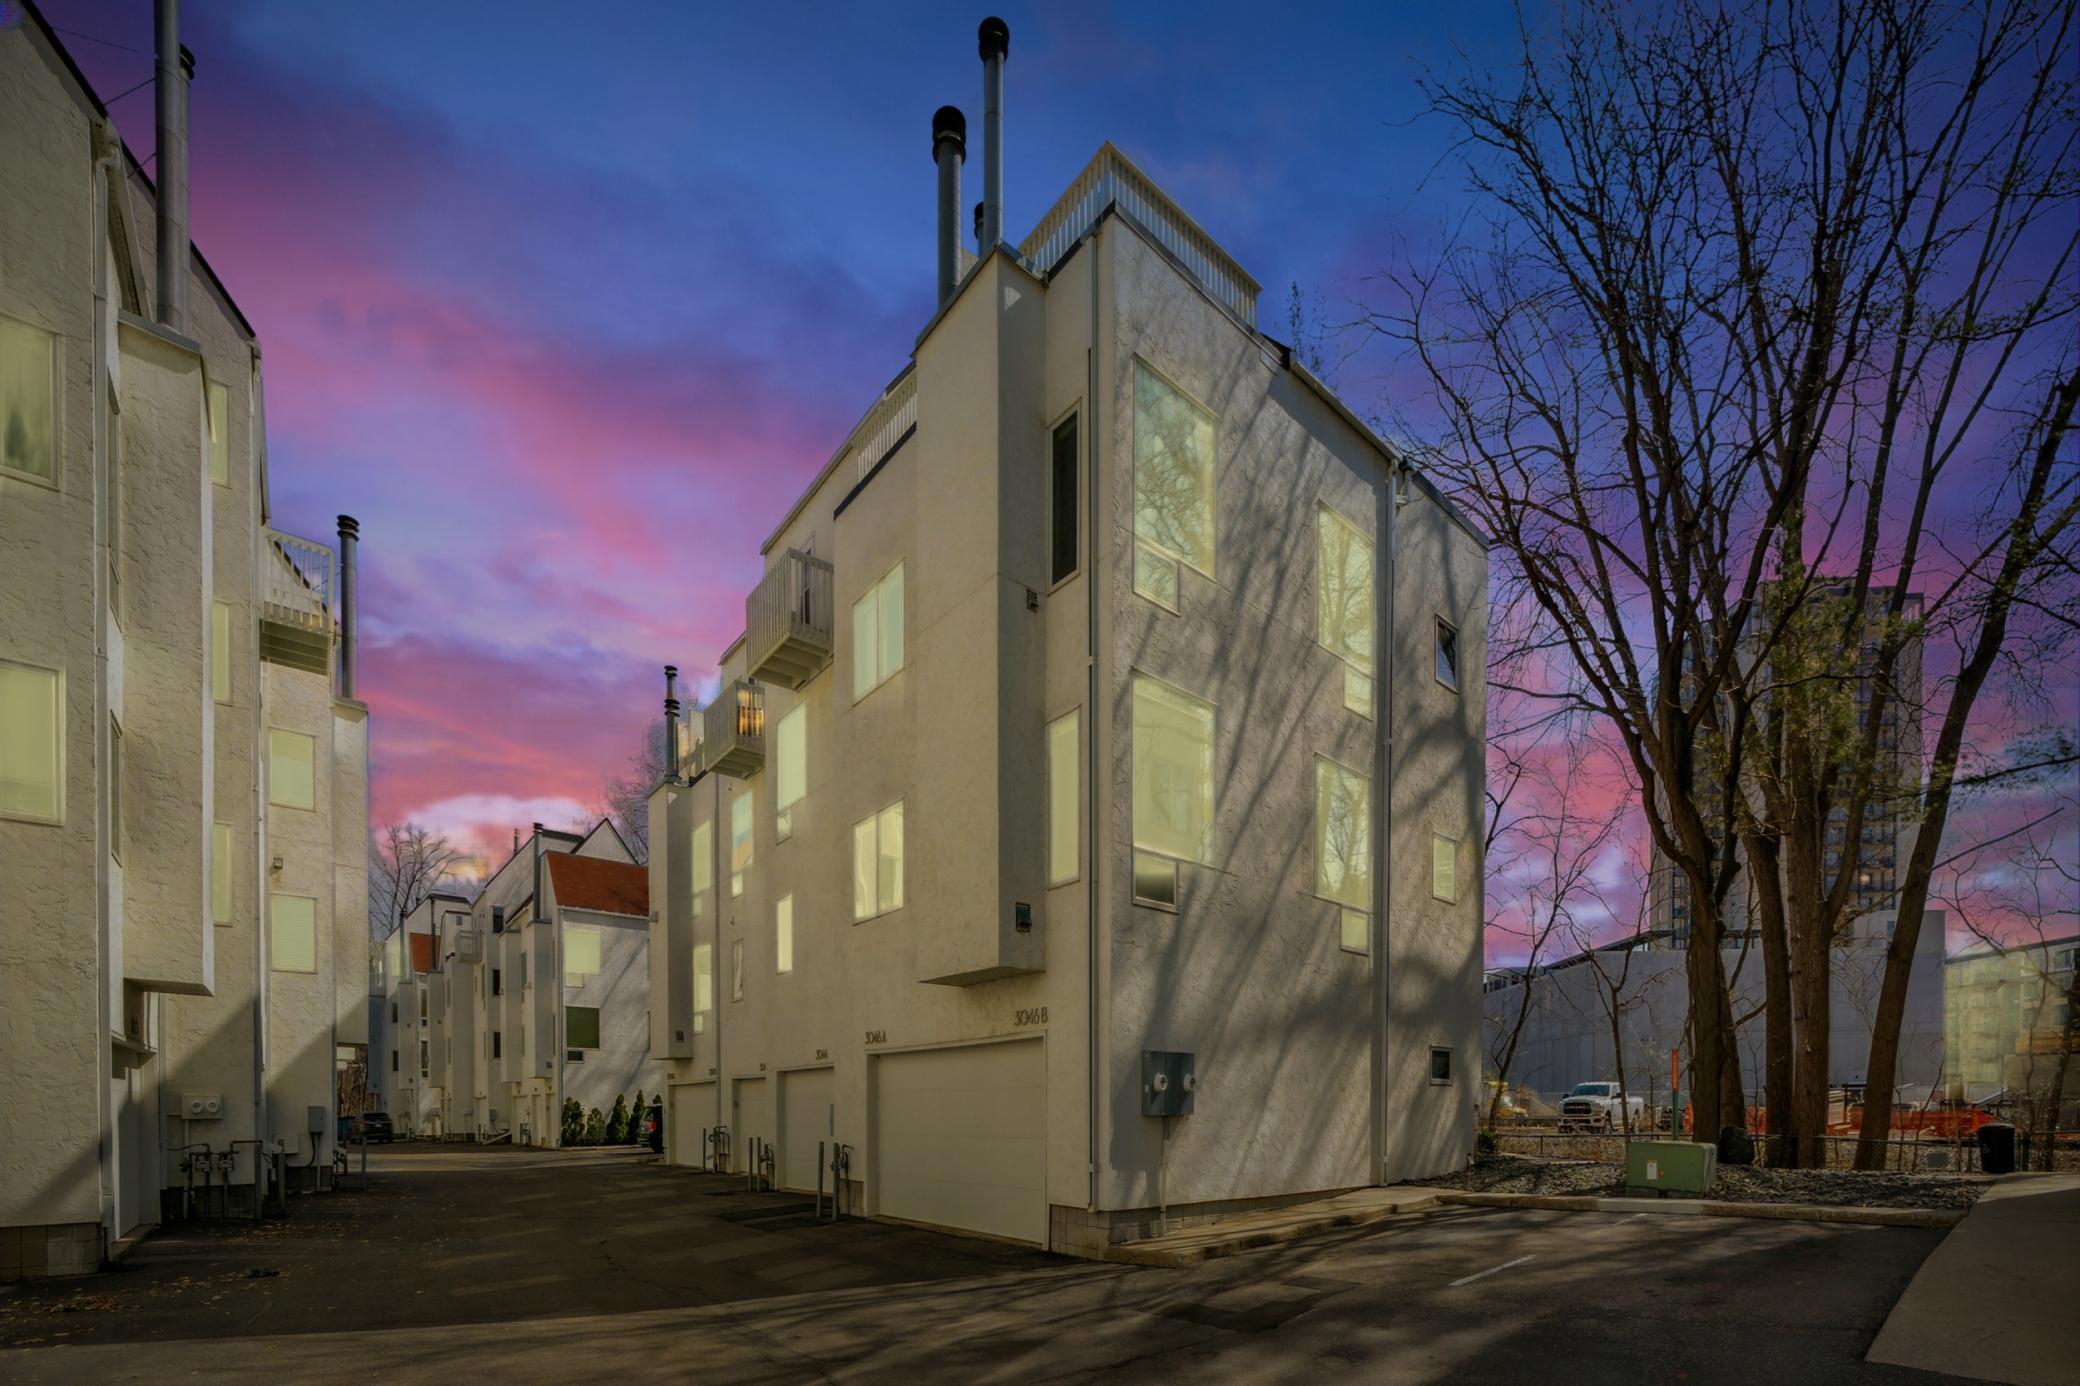
Active
$198,500
1
bds
|
1
ba
|
763
sqft
|
built
1984
3046 Lake Shore Dr, Minneapolis, MN 55416
$-380
Cash flow
-10.0%
Cash-on-Cash Return
3.4%
Cap rate
0.9%
Rent to Value Ratio
Active
$484,000
3
bds
|
2
ba
|
1,489
sqft
|
built
1900
4017 Aldrich Ave S, Minneapolis, MN 55409
$-1,285
Cash flow
-13.9%
Cash-on-Cash Return
2.5%
Cap rate
0.5%
Rent to Value Ratio
Active
$309,000
2
bds
|
2
ba
|
1,610
sqft
|
built
1981
1235 Yale Pl, Minneapolis, MN 55403
$-1,868
Cash flow
-31.5%
Cash-on-Cash Return
-1.6%
Cap rate
0.8%
Rent to Value Ratio
Active
$349,000
4
bds
|
2
ba
|
1,838
sqft
|
built
1900
3148 3rd Ave S, Minneapolis, MN 55408
$73
Cash flow
1.1%
Cash-on-Cash Return
5.9%
Cap rate
0.7%
Rent to Value Ratio
Active
$149,900
2
bds
|
2
ba
|
1,110
sqft
|
built
1973
1920 S 1st St, Minneapolis, MN 55454
$-824
Cash flow
-28.7%
Cash-on-Cash Return
-0.9%
Cap rate
1.5%
Rent to Value Ratio