Minneapolis, MN Investment Properties for Sale
Browse homes for sale and investment properties in Minneapolis, MN. Refine your search by price, property type, or more.
Best cash flowing properties in Minneapolis, MN
Active
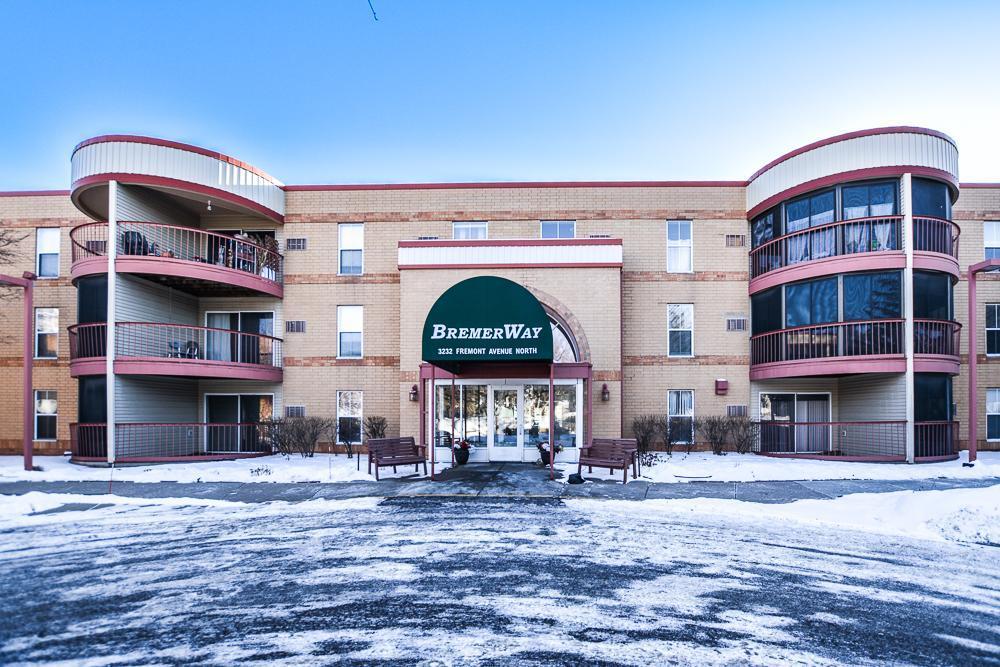
$83,000
2
bds
|
1
ba
|
1,066
sqft
|
built
1985
3232 Fremont Ave N, Minneapolis, MN 55412
$175
Cash flow
11.0%
Cash-on-Cash Return
8.2%
Cap rate
1.9%
Rent to Value Ratio
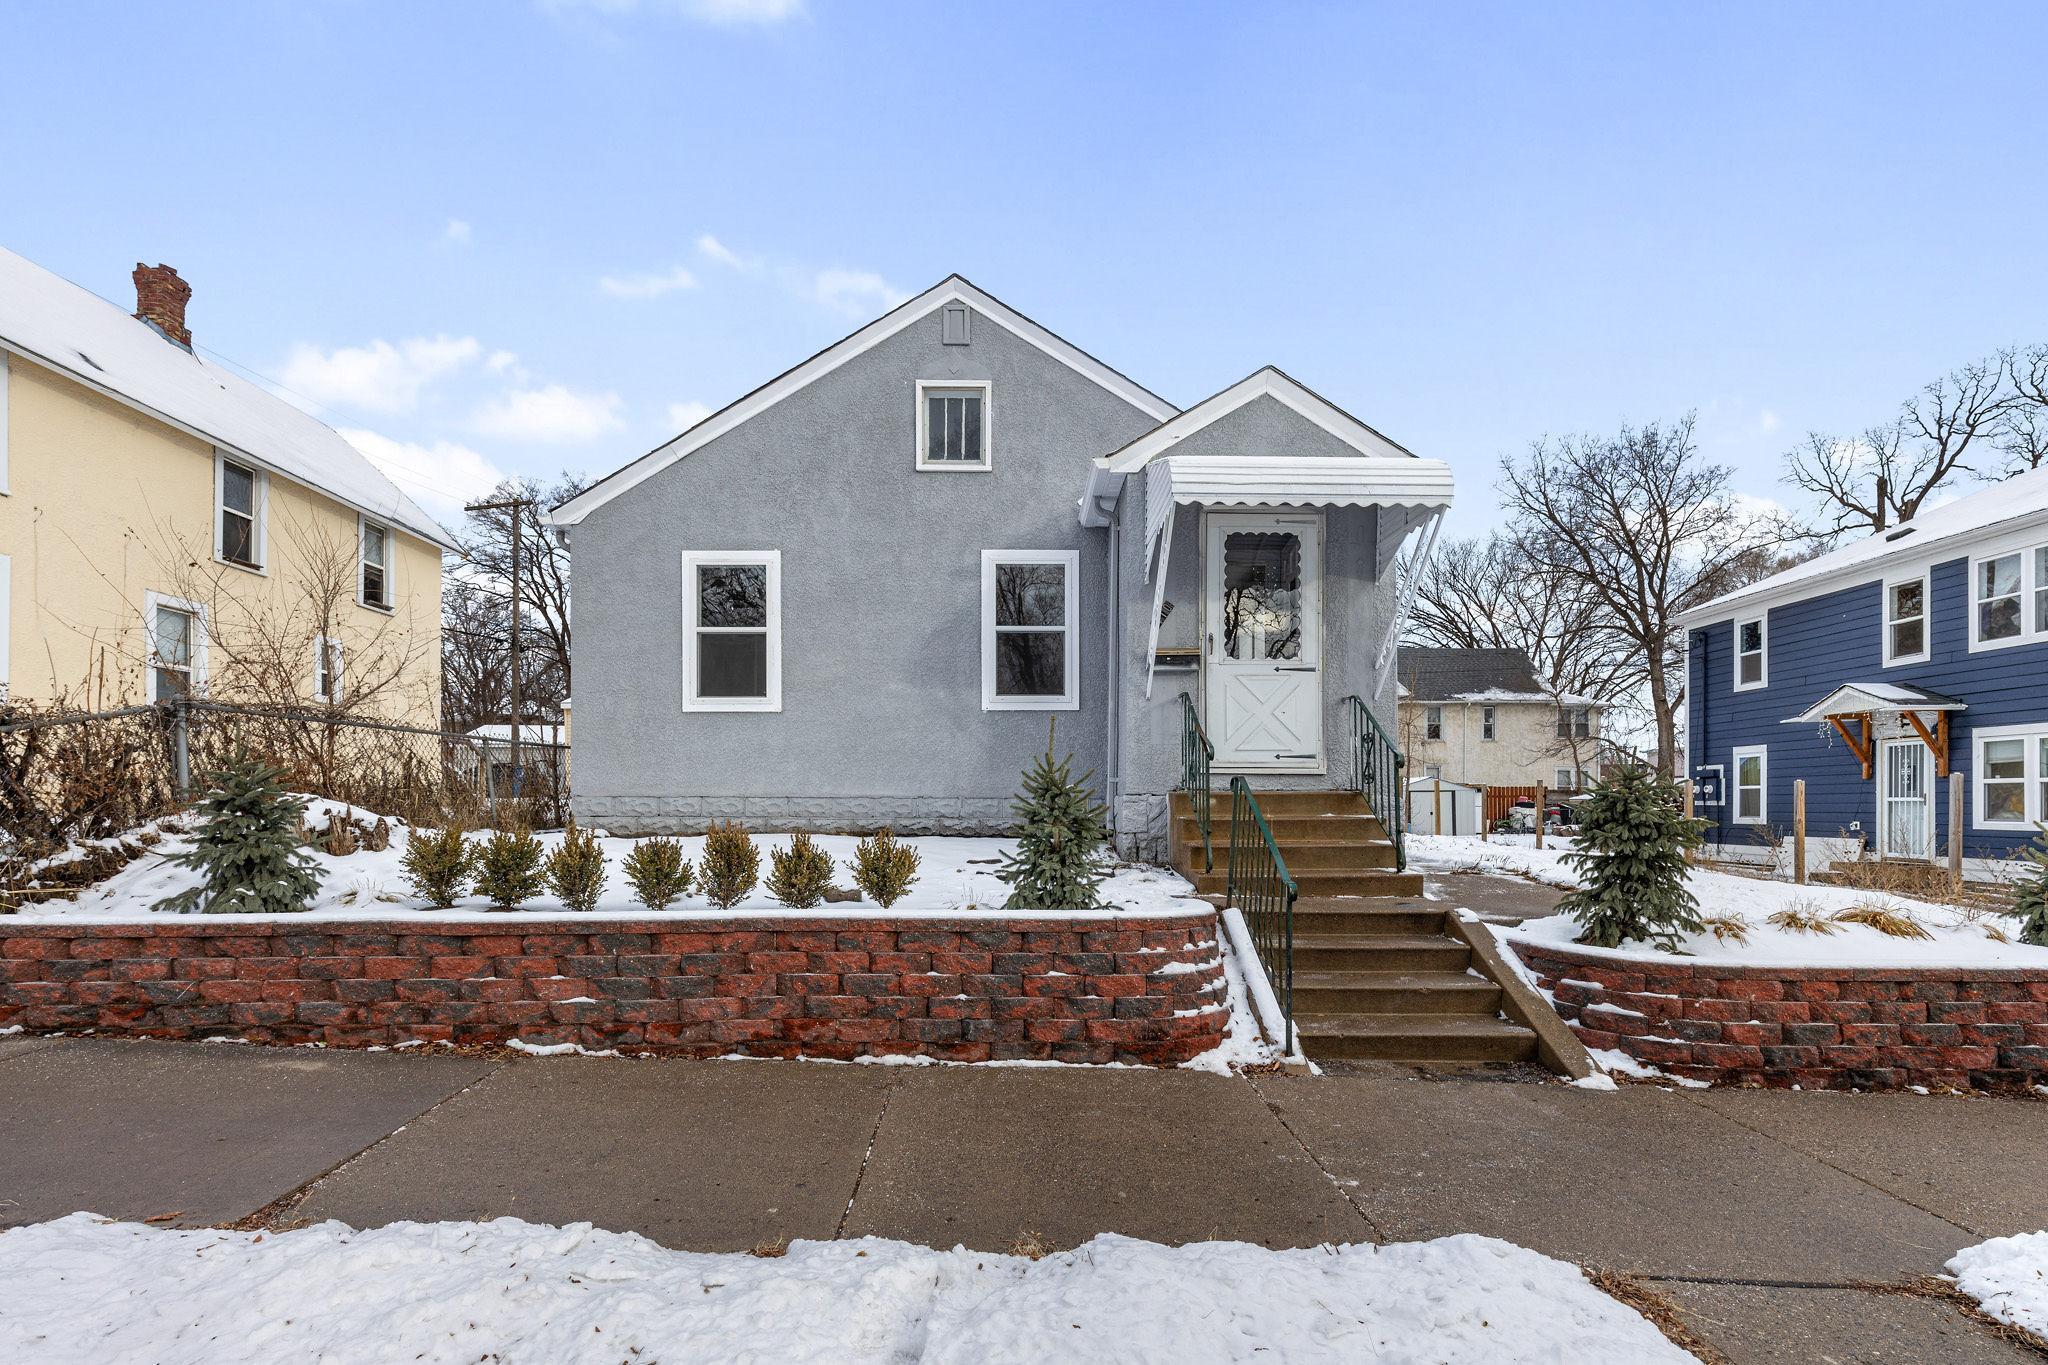
Active
$180,000
2
bds
|
2
ba
|
1,110
sqft
|
built
1930
410 23rd Ave N, Minneapolis, MN 55411
$68
Cash flow
2.0%
Cash-on-Cash Return
6.1%
Cap rate
1.1%
Rent to Value Ratio
1,012 out of 1,224 properties for sale in Minneapolis, MN
Limited Results Shown
Create a free account, or log in to reveal all property listings and enjoy the complete experience.

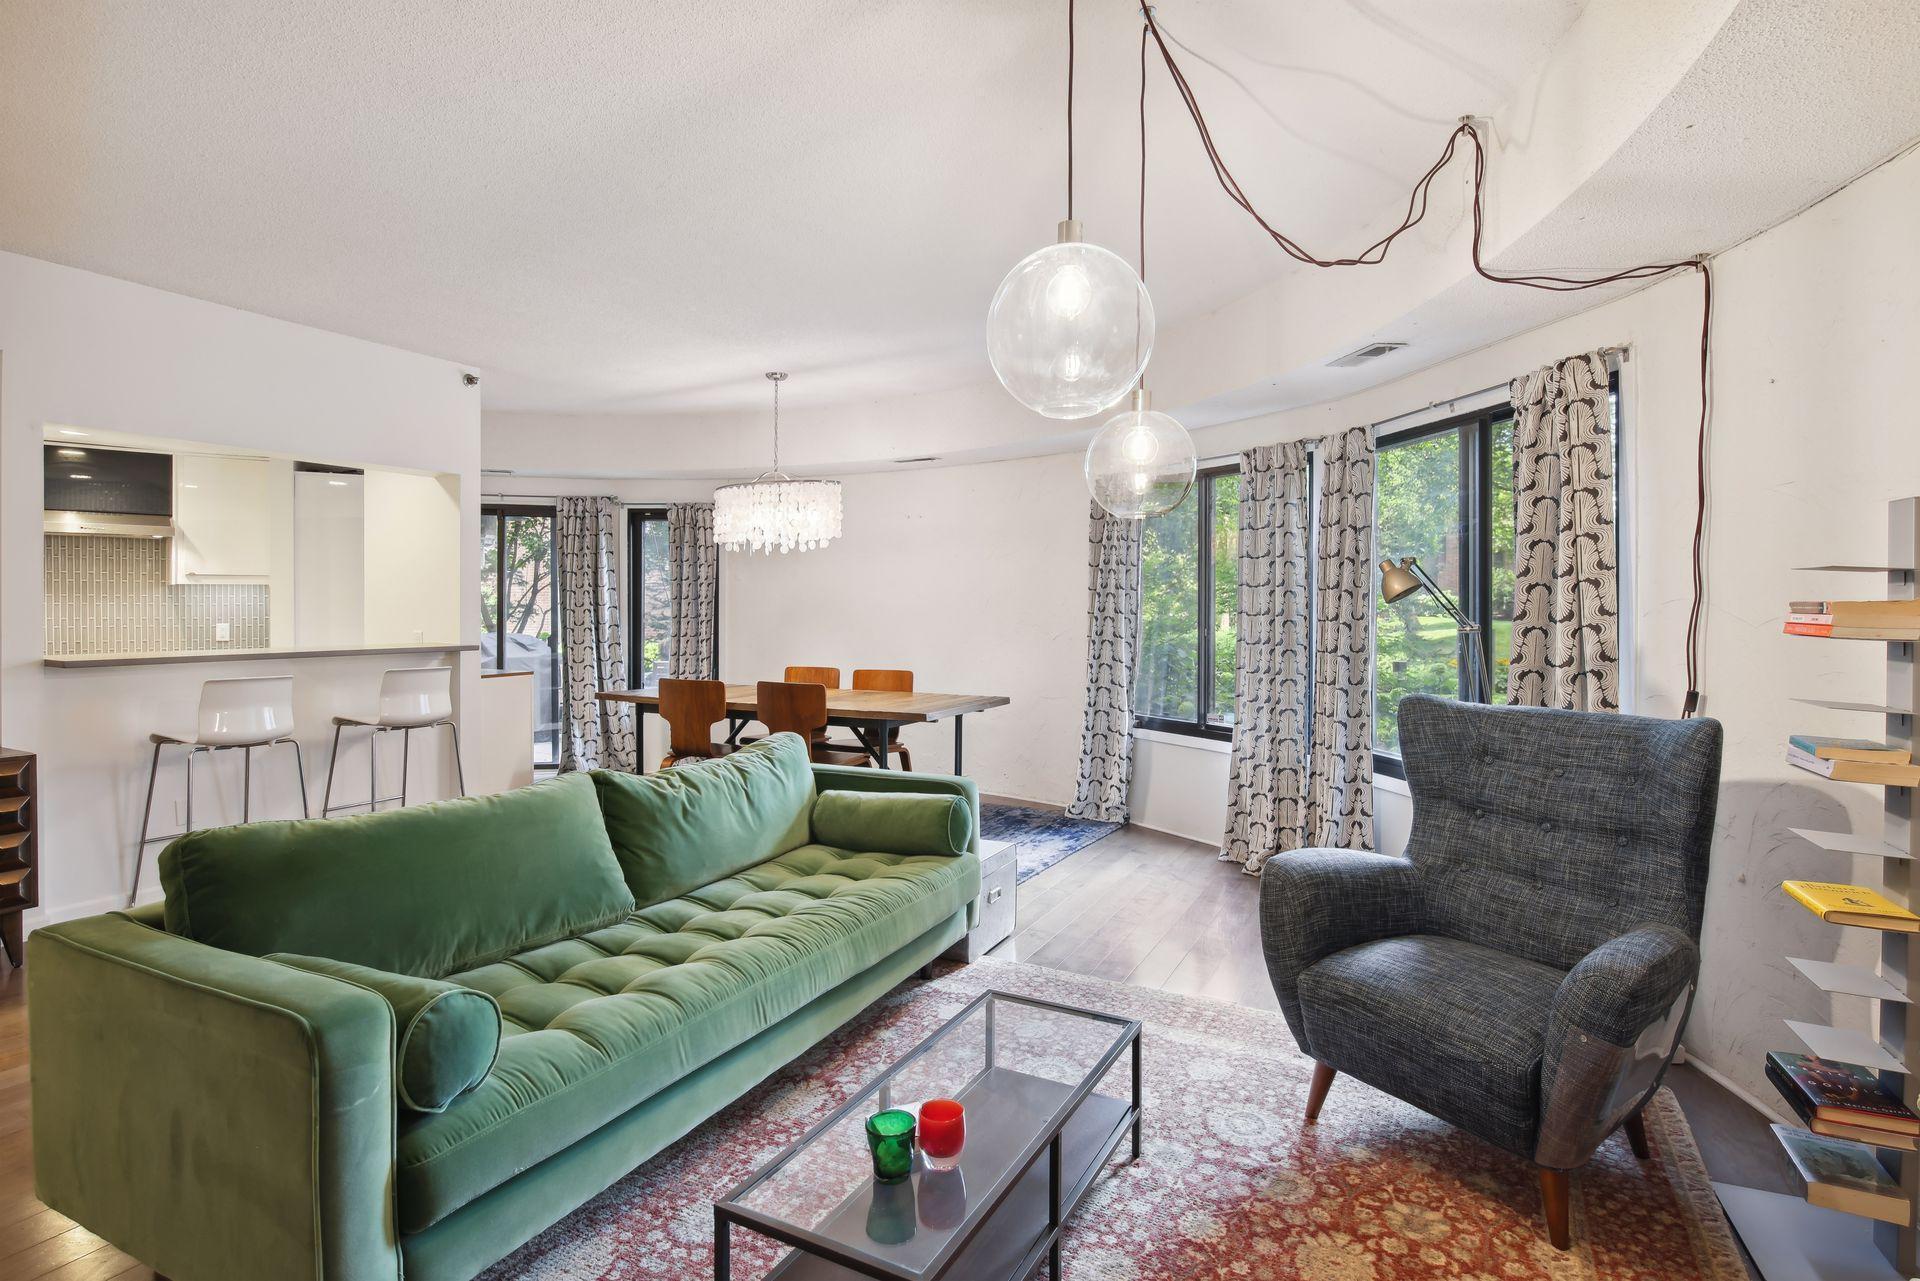
Active
$285,000
2
bds
|
2
ba
|
1,042
sqft
|
built
2005
619 8th St SE, Minneapolis, MN 55414
$-980
Cash flow
-17.9%
Cash-on-Cash Return
1.6%
Cap rate
0.6%
Rent to Value Ratio
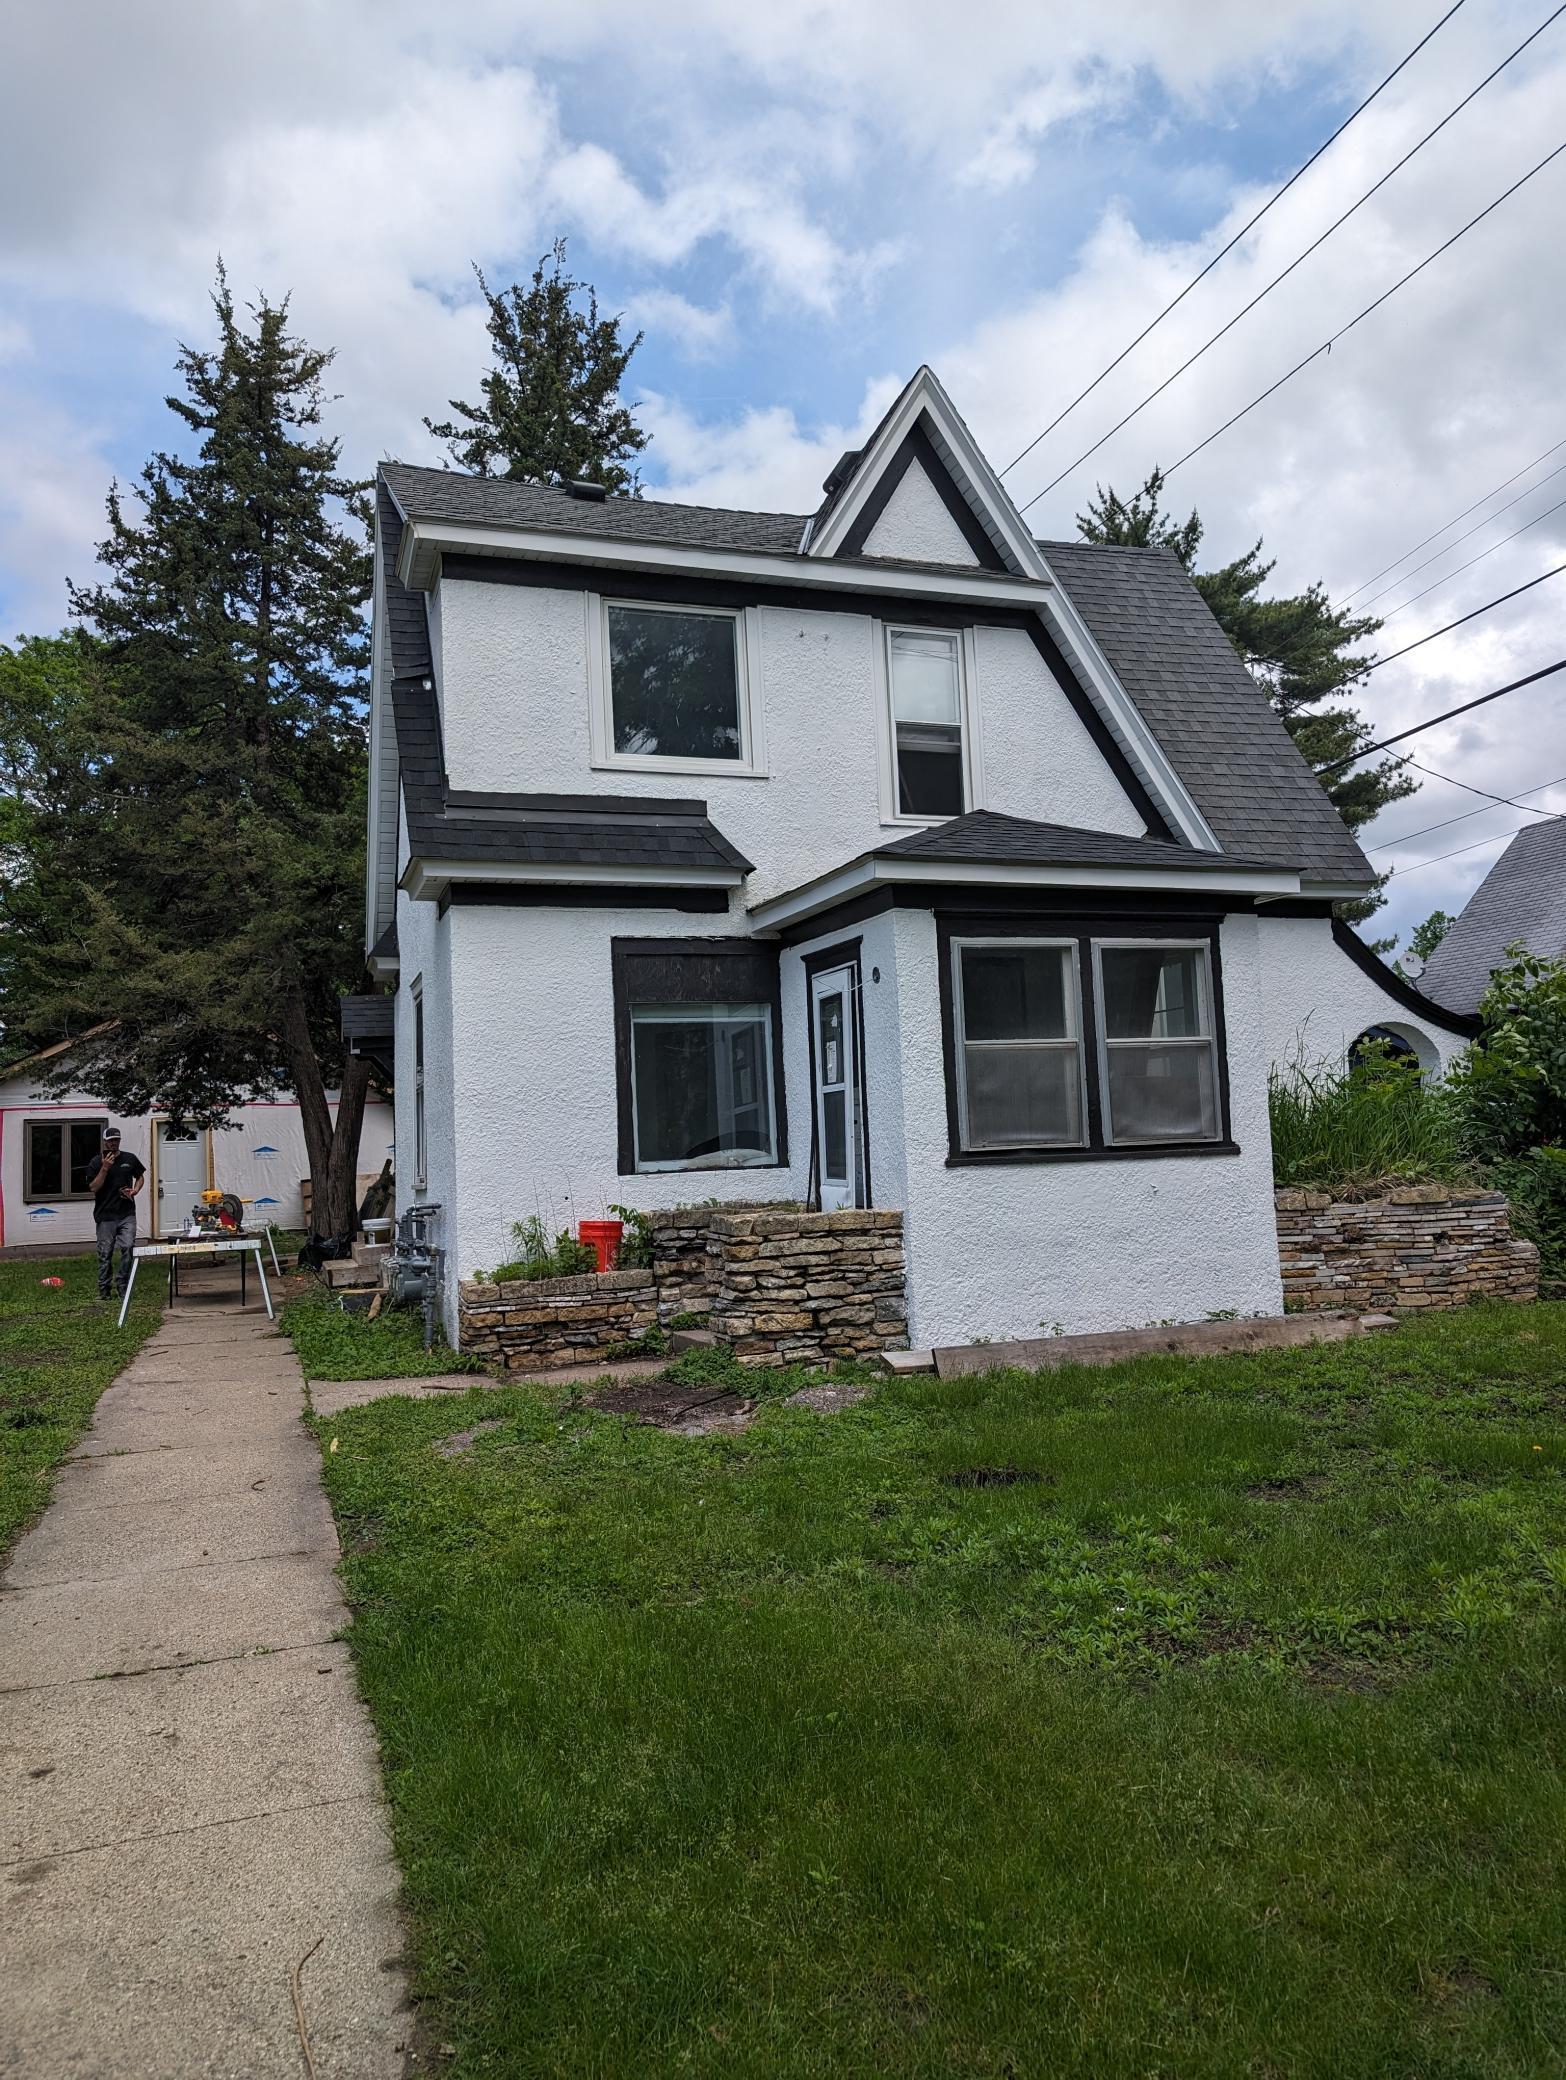
Active
$525,000
5
bds
|
2
ba
|
1,440
sqft
|
built
1908
302 E 48th St, Minneapolis, MN 55419
$-1,447
Cash flow
-14.4%
Cash-on-Cash Return
2.4%
Cap rate
0.4%
Rent to Value Ratio

Active
$209,900
1
bds
|
1
ba
|
763
sqft
|
built
1984
3054 Lake Shore Dr, Minneapolis, MN 55416
$-422
Cash flow
-10.5%
Cash-on-Cash Return
3.3%
Cap rate
0.8%
Rent to Value Ratio
Active
$335,000
3
bds
|
2
ba
|
1,553
sqft
|
built
1983
3151 Dean Ct, Minneapolis, MN 55416
$-822
Cash flow
-12.8%
Cash-on-Cash Return
2.7%
Cap rate
0.9%
Rent to Value Ratio
Active
$83,000
2
bds
|
1
ba
|
1,066
sqft
|
built
1985
3232 Fremont Ave N, Minneapolis, MN 55412
$175
Cash flow
11.0%
Cash-on-Cash Return
8.2%
Cap rate
1.9%
Rent to Value Ratio
Active
$720,000
8
bds
|
4
ba
|
2,856
sqft
|
built
1909
2740 Lyndale Ave S, Minneapolis, MN 55408
$-3,189
Cash flow
-23.1%
Cash-on-Cash Return
0.4%
Cap rate
0.3%
Rent to Value Ratio
Active
$284,900
1
bds
|
1
ba
|
875
sqft
|
built
2007
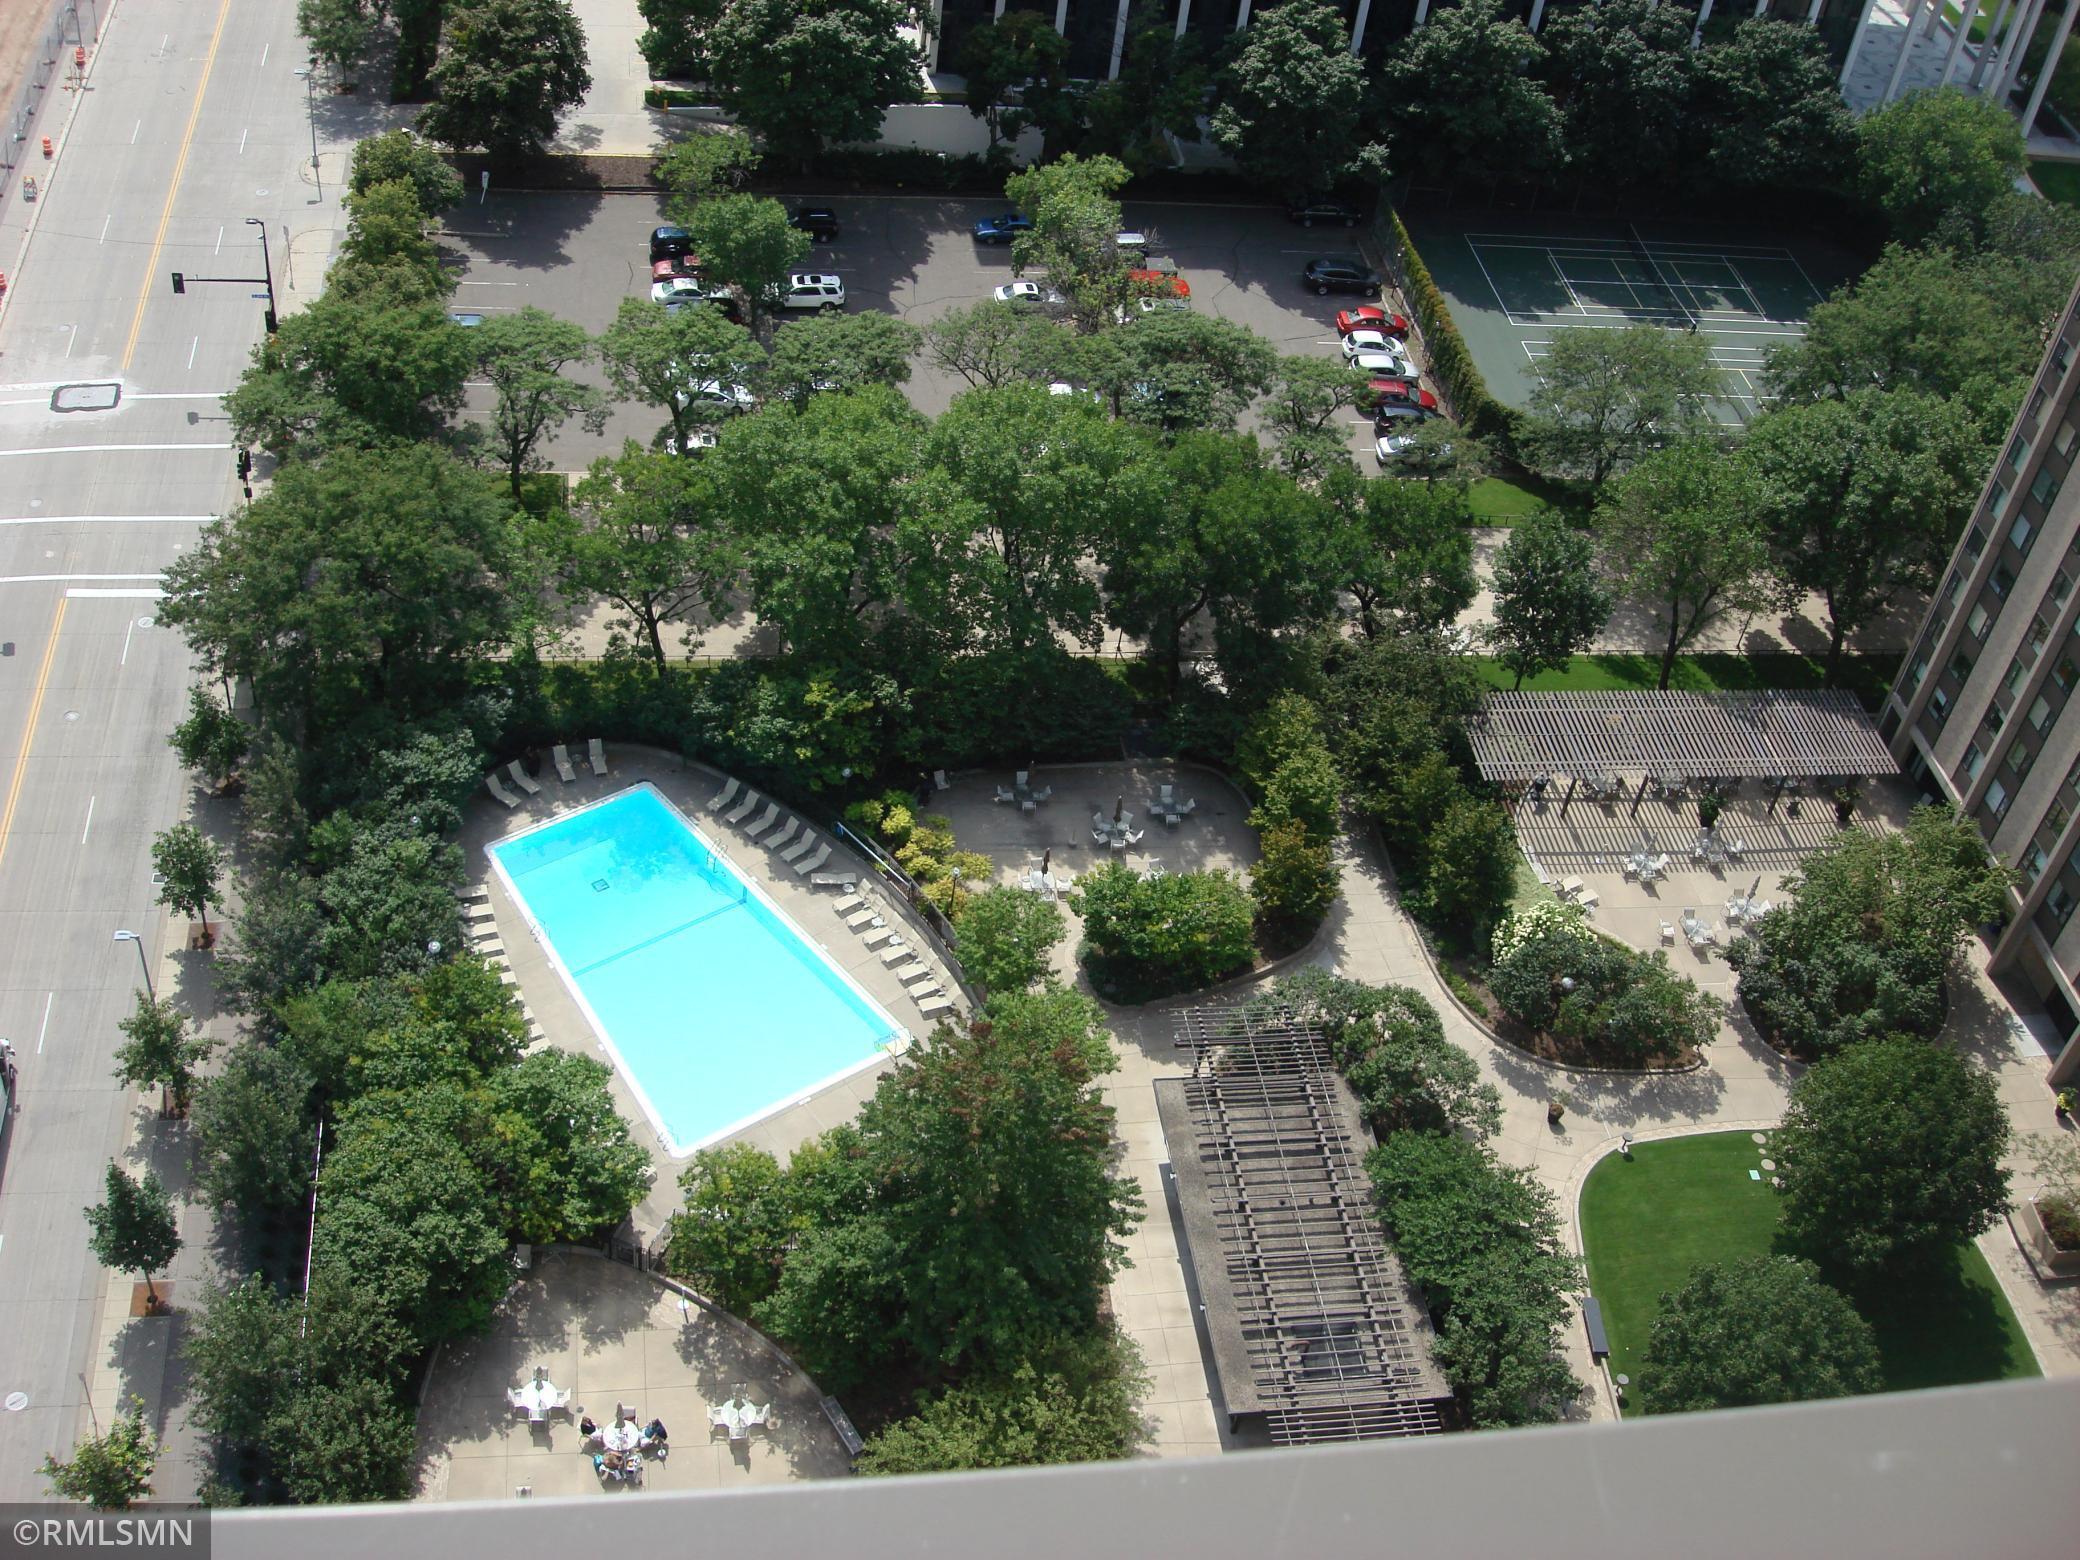
201 S 11th St, Minneapolis, MN 55403
$-1,156
Cash flow
-21.2%
Cash-on-Cash Return
0.8%
Cap rate
0.8%
Rent to Value Ratio
Active
$559,000
2
bds
|
3
ba
|
2,219
sqft
|
built
1975
1058 Cedar View Dr, Minneapolis, MN 55405
$-1,590
Cash flow
-14.8%
Cash-on-Cash Return
2.3%
Cap rate
0.6%
Rent to Value Ratio

Active
$2,875,000
5
bds
|
5
ba
|
9,017
sqft
|
built
1923
4637 E Lake Harriet Pkwy, Minneapolis, MN 55419
$-9,563
Cash flow
-17.4%
Cash-on-Cash Return
1.7%
Cap rate
0.3%
Rent to Value Ratio
Active
$229,900
1
bds
|
1
ba
|
830
sqft
|
built
2006
521 S 7th St, Minneapolis, MN 55415
$-573
Cash flow
-13.0%
Cash-on-Cash Return
2.7%
Cap rate
0.8%
Rent to Value Ratio

Active
$359,900
2
bds
|
1
ba
|
1,494
sqft
|
built
2007
730 Stinson Blvd, Minneapolis, MN 55413
$-1,014
Cash flow
-14.7%
Cash-on-Cash Return
2.3%
Cap rate
0.8%
Rent to Value Ratio
Active
$125,000
1
bds
|
1
ba
|
667
sqft
|
built
1965
15 S 1st St, Minneapolis, MN 55401
$-256
Cash flow
-10.7%
Cash-on-Cash Return
3.2%
Cap rate
1.3%
Rent to Value Ratio
Active
$199,900
1
bds
|
1
ba
|
753
sqft
|
built
2004
9 W Franklin Ave, Minneapolis, MN 55404
$-270
Cash flow
-7.0%
Cash-on-Cash Return
4.1%
Cap rate
0.9%
Rent to Value Ratio
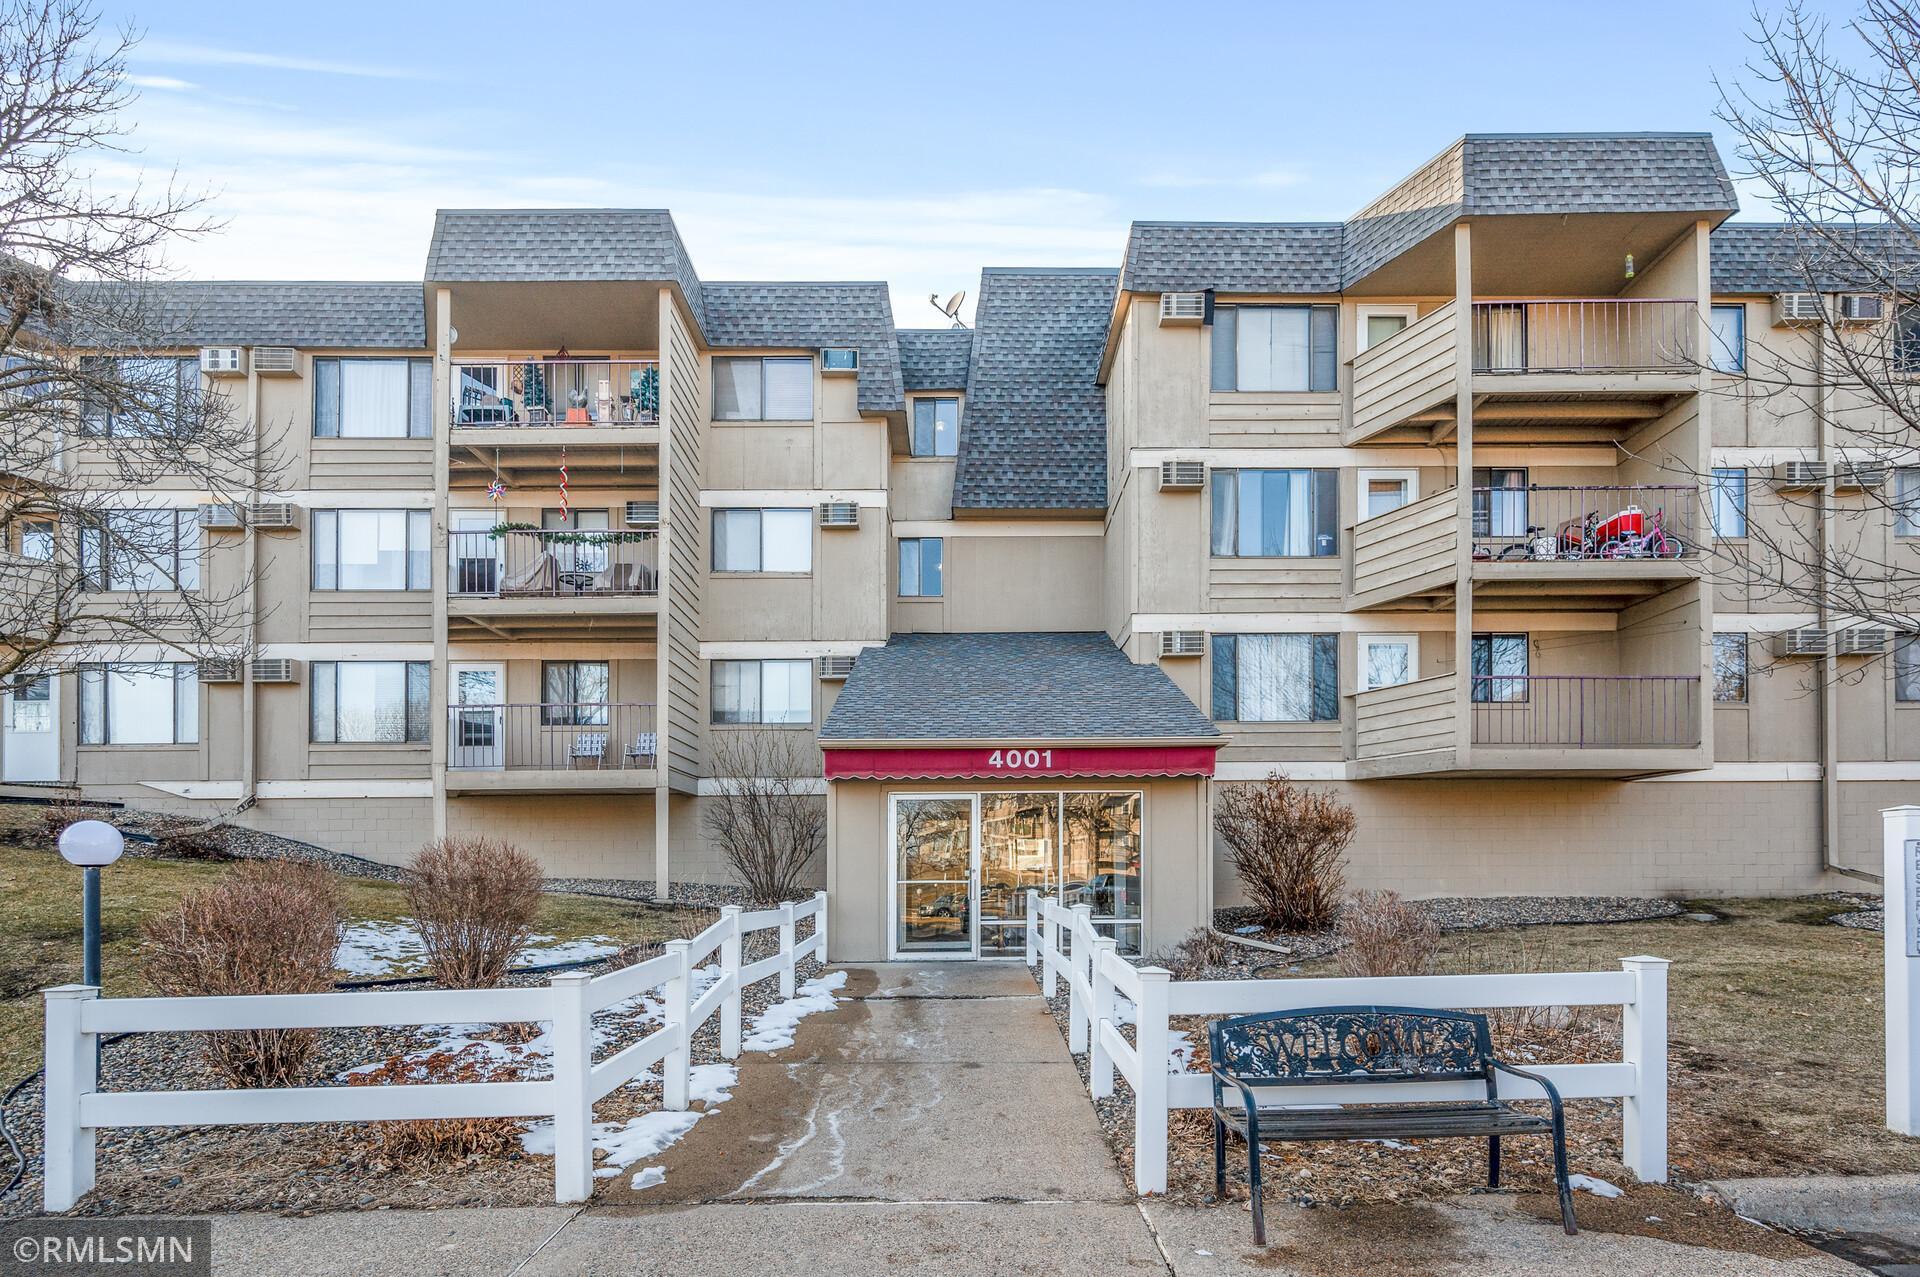
Active
$181,900
3
bds
|
2
ba
|
1,200
sqft
|
built
1974
4001 Heritage Hills Dr, Minneapolis, MN 55437
$-214
Cash flow
-6.1%
Cash-on-Cash Return
4.3%
Cap rate
1.0%
Rent to Value Ratio
Active
$1,645,000
5
bds
|
5
ba
|
6,603
sqft
|
built
1929
5231 Clinton Ave, Minneapolis, MN 55419
$-3,825
Cash flow
-12.1%
Cash-on-Cash Return
2.9%
Cap rate
0.5%
Rent to Value Ratio
Active
$2,750,000
3
bds
|
3
ba
|
2,623
sqft
|
built
2022
1111 W River Pkwy, Minneapolis, MN 55415
$-12,301
Cash flow
-23.3%
Cash-on-Cash Return
0.3%
Cap rate
0.3%
Rent to Value Ratio
Active
$699,900
1
bds
|
2
ba
|
1,460
sqft
|
built
2019
728 3rd St N, Minneapolis, MN 55401
$-1,830
Cash flow
-13.6%
Cash-on-Cash Return
2.5%
Cap rate
0.6%
Rent to Value Ratio
Active
$117,400
bds
|
1
ba
|
504
sqft
|
built
1965
15 S 1st St, Minneapolis, MN 55401
$-337
Cash flow
-15.0%
Cash-on-Cash Return
2.2%
Cap rate
1.1%
Rent to Value Ratio
Active
$599,900
2
bds
|
2
ba
|
1,691
sqft
|
built
2007
100 3rd Ave S, Minneapolis, MN 55401
$-1,886
Cash flow
-16.4%
Cash-on-Cash Return
1.9%
Cap rate
0.7%
Rent to Value Ratio
Active
$149,900
1
bds
|
1
ba
|
647
sqft
|
built
1963
2706 Humboldt Ave S, Minneapolis, MN 55408
$-160
Cash flow
-5.6%
Cash-on-Cash Return
4.4%
Cap rate
0.9%
Rent to Value Ratio
Active
$125,000
1
bds
|
1
ba
|
630
sqft
|
built
1907
1204 Harmon Pl, Minneapolis, MN 55403
$-437
Cash flow
-18.2%
Cash-on-Cash Return
1.5%
Cap rate
1.1%
Rent to Value Ratio
Active
$1,895,000
5
bds
|
8
ba
|
6,029
sqft
|
built
1926
2728 Dean Pkwy, Minneapolis, MN 55416
$-6,942
Cash flow
-19.1%
Cash-on-Cash Return
1.3%
Cap rate
0.4%
Rent to Value Ratio
Active
$300,000
2
bds
|
2
ba
|
1,160
sqft
|
built
1979
210 W Grant St, Minneapolis, MN 55403
$-840
Cash flow
-14.6%
Cash-on-Cash Return
2.3%
Cap rate
0.9%
Rent to Value Ratio
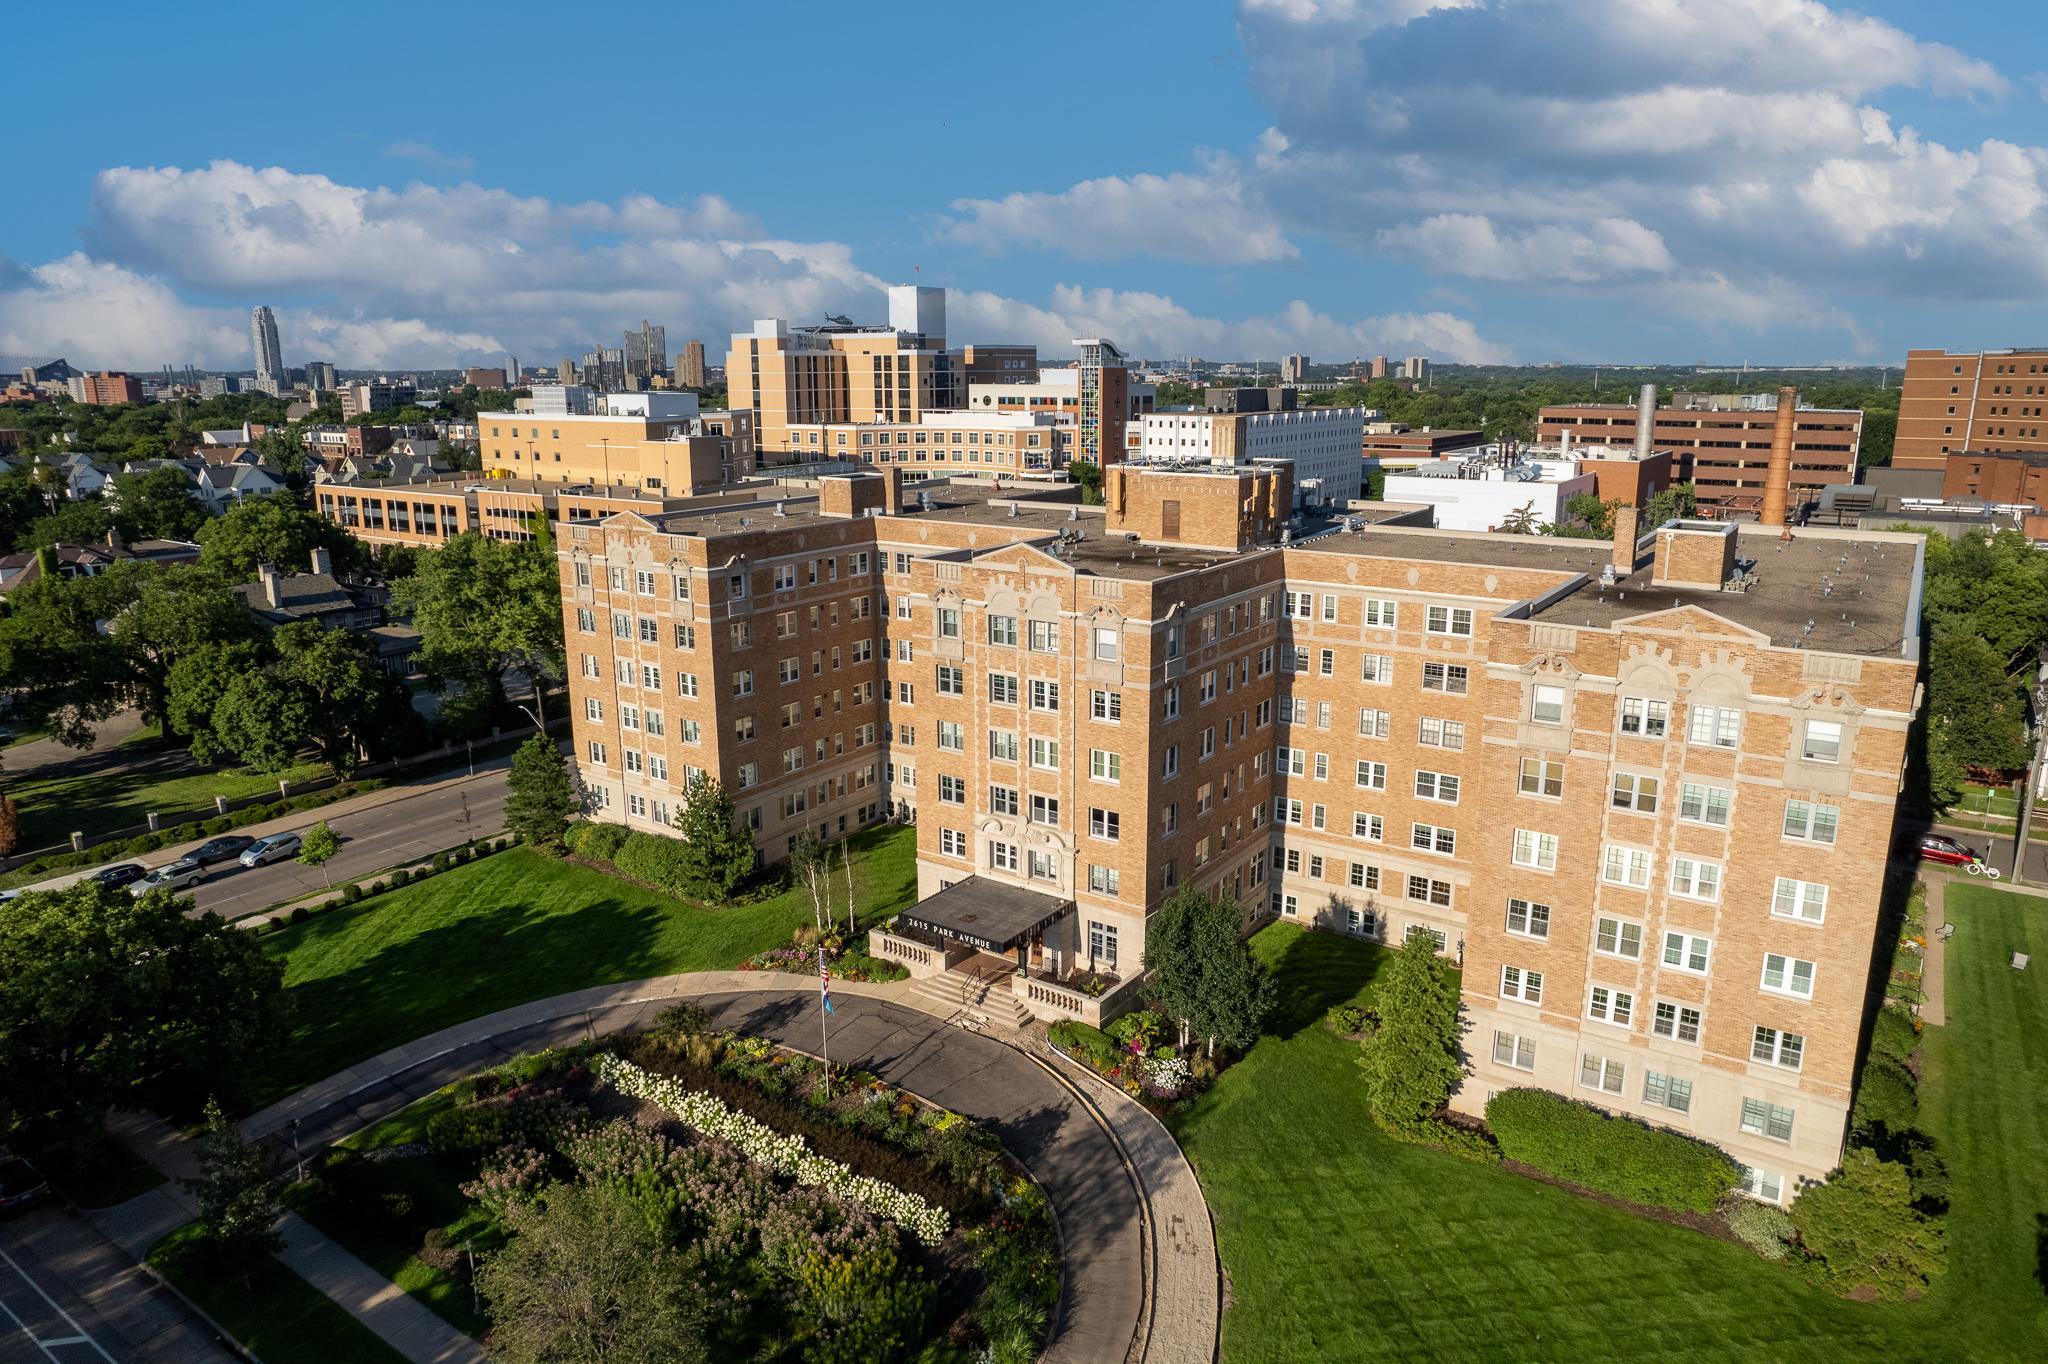
Active
$105,000
1
bds
|
1
ba
|
805
sqft
|
built
1930
2615 Park Ave, Minneapolis, MN 55407
$-365
Cash flow
-18.1%
Cash-on-Cash Return
1.5%
Cap rate
1.6%
Rent to Value Ratio
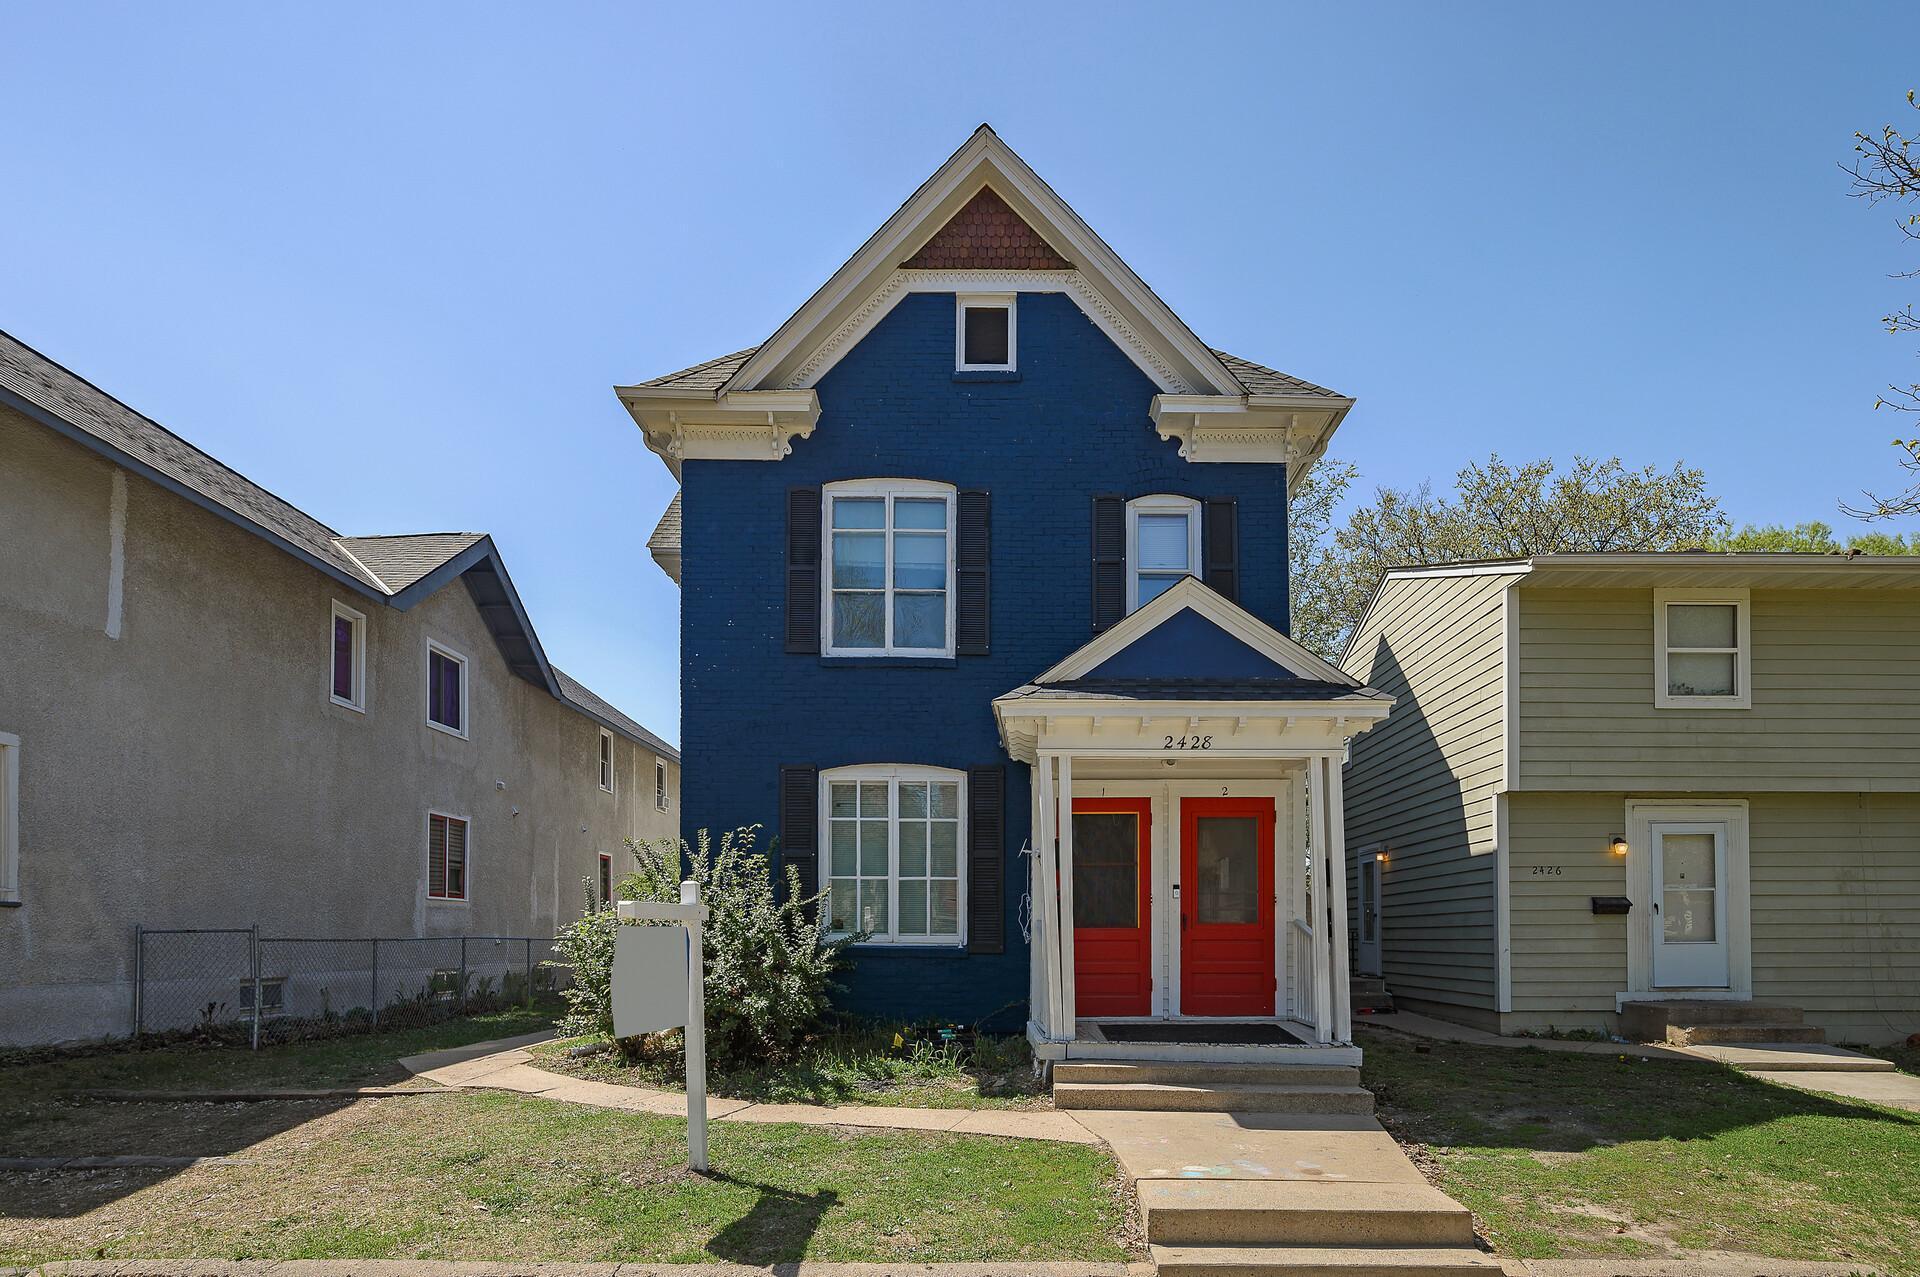
Active
$599,900
10
bds
|
4
ba
|
3,704
sqft
|
built
1900
2428 11th Ave S, Minneapolis, MN 55404
$-1,730
Cash flow
-15.0%
Cash-on-Cash Return
2.2%
Cap rate
0.4%
Rent to Value Ratio
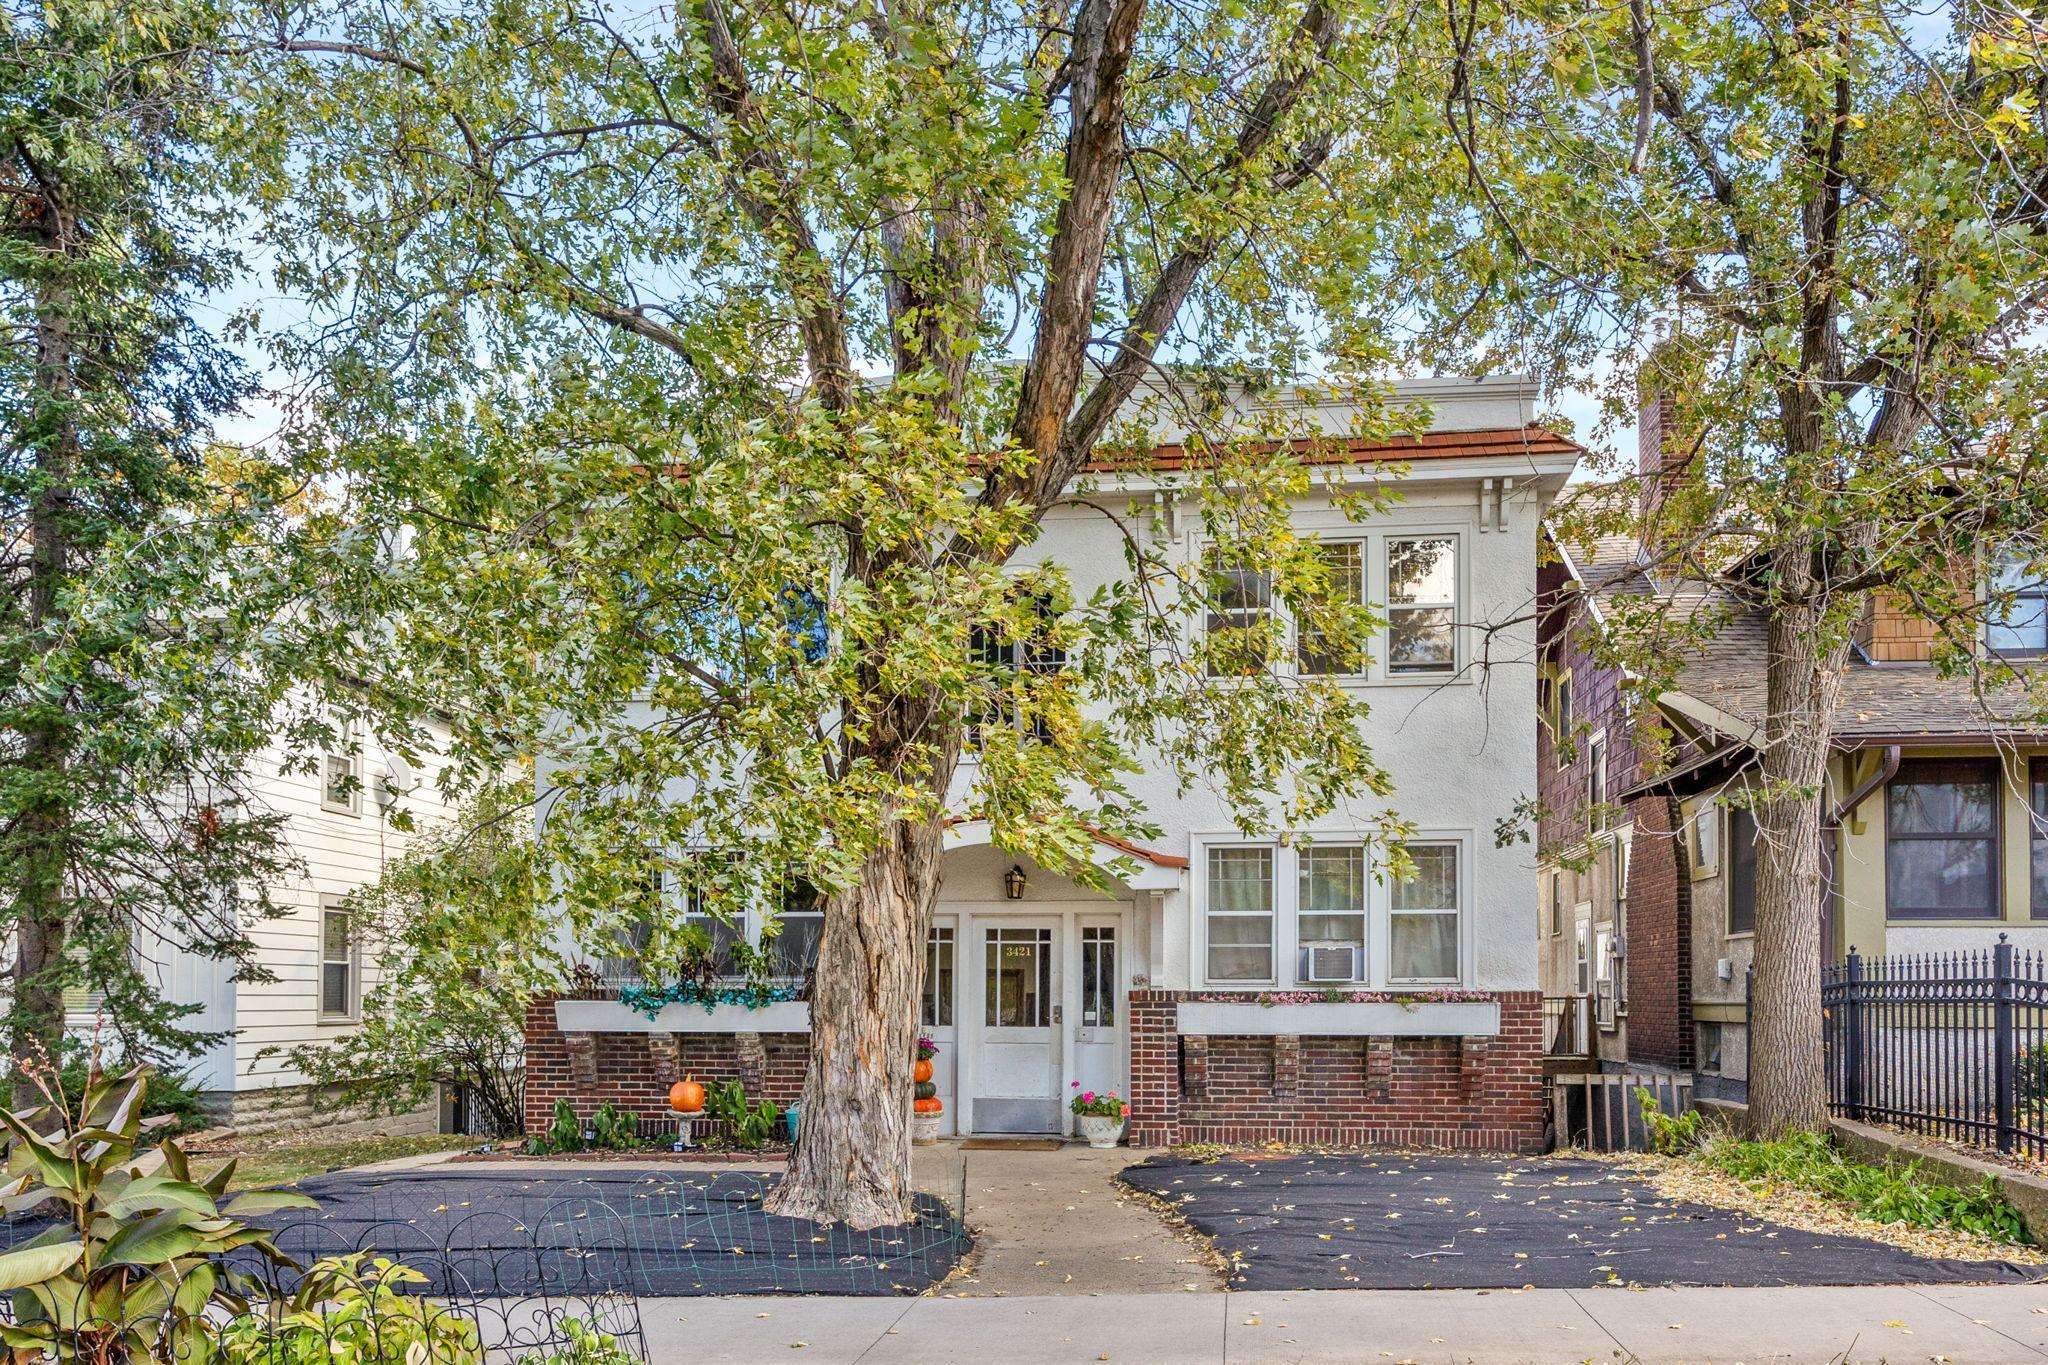
Active
$125,000
1
bds
|
1
ba
|
650
sqft
|
built
1924
3421 Hennepin Ave, Minneapolis, MN 55408
$-146
Cash flow
-6.1%
Cash-on-Cash Return
4.3%
Cap rate
1.0%
Rent to Value Ratio
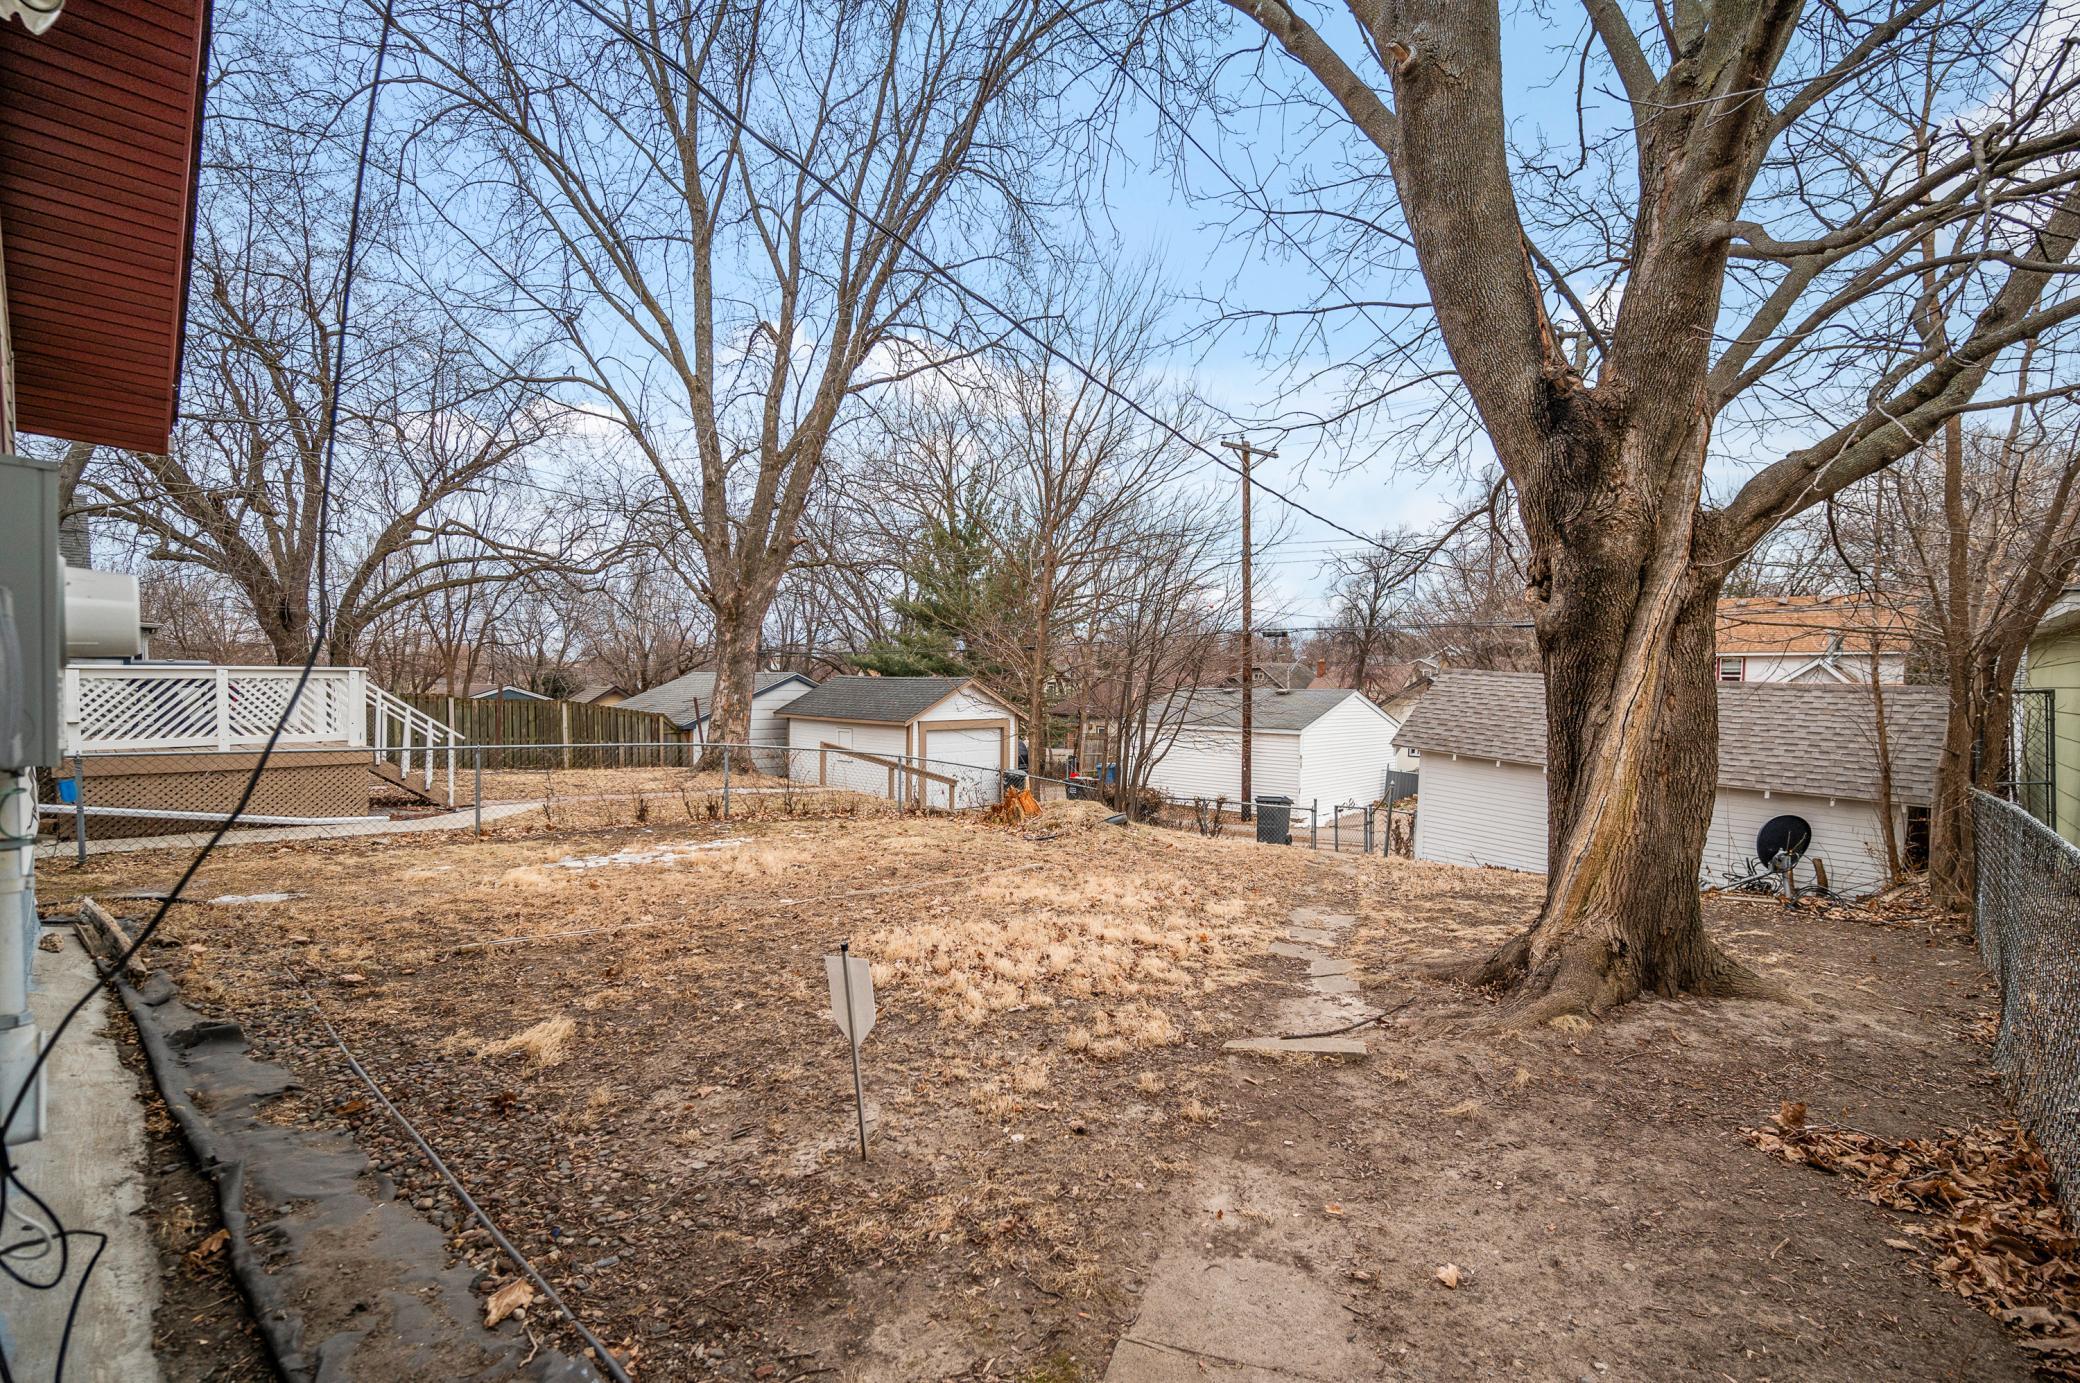
Active
$239,000
3
bds
|
2
ba
|
1,174
sqft
|
built
1921
3431 Irving Ave N, Minneapolis, MN 55412
$-87
Cash flow
-1.9%
Cash-on-Cash Return
5.2%
Cap rate
0.8%
Rent to Value Ratio
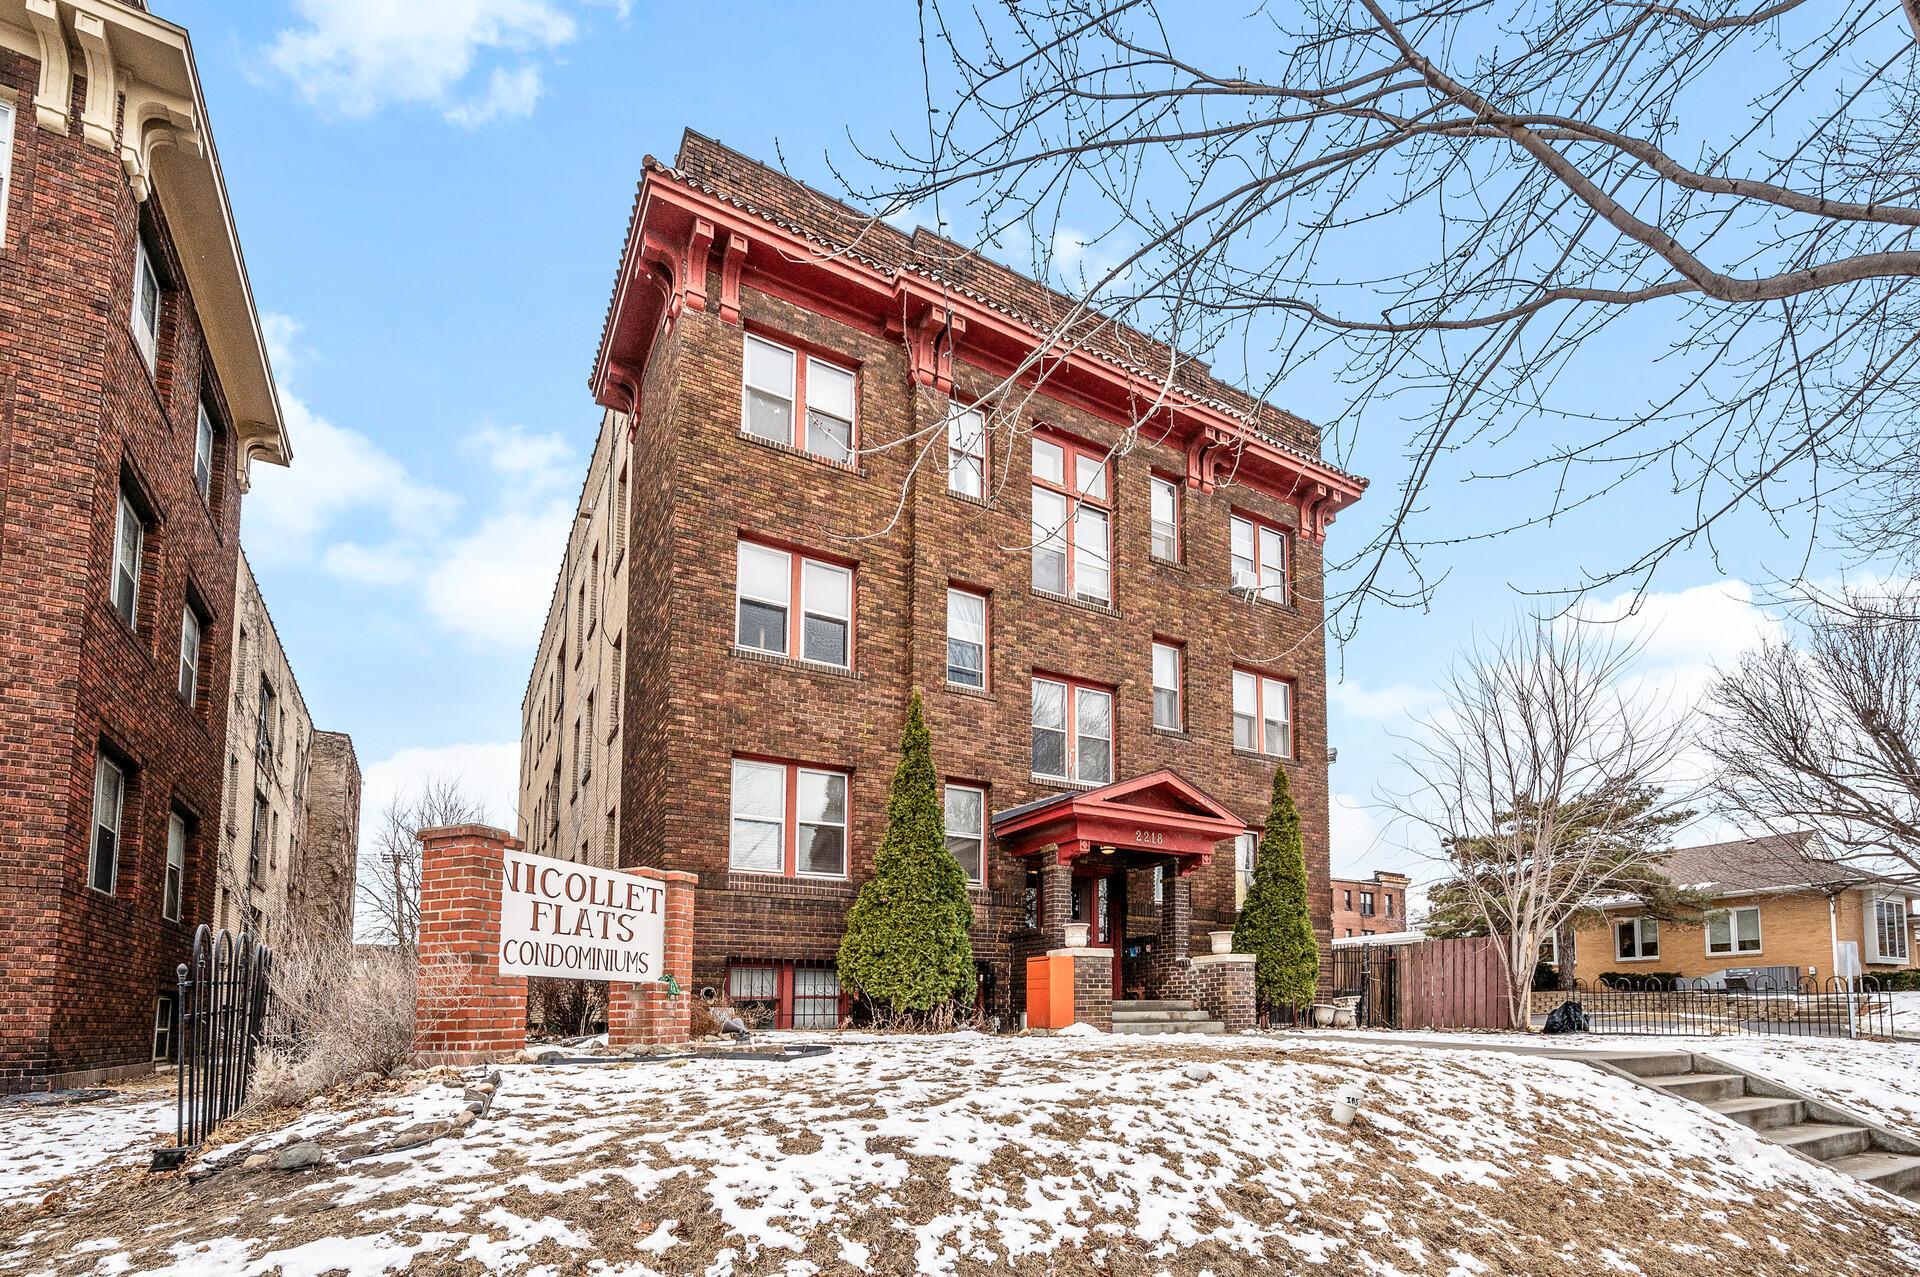
Active
$95,000
1
bds
|
1
ba
|
475
sqft
|
built
1916
2218 Nicollet Ave, Minneapolis, MN 55404
$-86
Cash flow
-4.7%
Cash-on-Cash Return
4.6%
Cap rate
1.3%
Rent to Value Ratio
Pending
$699,000
2
bds
|
2
ba
|
1,352
sqft
|
built
2006
100 3rd Ave S, Minneapolis, MN 55401
$-2,284
Cash flow
-17.0%
Cash-on-Cash Return
1.8%
Cap rate
0.6%
Rent to Value Ratio
Active
$1,650,000
2
bds
|
3
ba
|
3,079
sqft
|
built
2007
201 S 11th St, Minneapolis, MN 55403
$-8,403
Cash flow
-26.6%
Cash-on-Cash Return
-0.4%
Cap rate
0.4%
Rent to Value Ratio
Active
$524,900
8
bds
|
3
ba
|
2,850
sqft
|
built
1900
2834 15th Ave S, Minneapolis, MN 55407
$-1,727
Cash flow
-17.2%
Cash-on-Cash Return
1.7%
Cap rate
0.4%
Rent to Value Ratio
Pending
$98,900
1
bds
|
1
ba
|
600
sqft
|
built
1970
2616 Harriet Ave, Minneapolis, MN 55408
$-113
Cash flow
-6.0%
Cash-on-Cash Return
4.3%
Cap rate
1.1%
Rent to Value Ratio
Active
$299,900
1
bds
|
1
ba
|
875
sqft
|
built
2007
201 S 11th St, Minneapolis, MN 55403
$-819
Cash flow
-14.2%
Cash-on-Cash Return
2.4%
Cap rate
0.9%
Rent to Value Ratio
Active
$159,500
1
bds
|
1
ba
|
1,010
sqft
|
built
1900
2929 Chicago Ave, Minneapolis, MN 55407
$-473
Cash flow
-15.5%
Cash-on-Cash Return
2.1%
Cap rate
1.0%
Rent to Value Ratio

Active
$105,000
1
bds
|
1
ba
|
650
sqft
|
built
1985
433 S 7th St, Minneapolis, MN 55415
$-55
Cash flow
-2.7%
Cash-on-Cash Return
5.1%
Cap rate
1.6%
Rent to Value Ratio
Active
$539,000
4
bds
|
2
ba
|
1,880
sqft
|
built
1928
3604 E 56th St, Minneapolis, MN 55417
$-1,109
Cash flow
-10.7%
Cash-on-Cash Return
3.2%
Cap rate
0.5%
Rent to Value Ratio
Active
$180,000
2
bds
|
2
ba
|
1,110
sqft
|
built
1930
410 23rd Ave N, Minneapolis, MN 55411
$68
Cash flow
2.0%
Cash-on-Cash Return
6.1%
Cap rate
1.1%
Rent to Value Ratio
Active
$325,000
2
bds
|
2
ba
|
1,153
sqft
|
built
2004
500 E Grant St, Minneapolis, MN 55404
$-1,190
Cash flow
-19.1%
Cash-on-Cash Return
1.3%
Cap rate
0.8%
Rent to Value Ratio
Active
$179,824
2
bds
|
2
ba
|
1,100
sqft
|
built
1973
1920 S 1st St, Minneapolis, MN 55454
$-1,036
Cash flow
-30.1%
Cash-on-Cash Return
-1.2%
Cap rate
1.2%
Rent to Value Ratio
Active
$1,495,000
2
bds
|
3
ba
|
2,359
sqft
|
built
2024
3041 Holmes Ave S, Minneapolis, MN 55408
$-4,209
Cash flow
-14.7%
Cash-on-Cash Return
2.3%
Cap rate
0.4%
Rent to Value Ratio