Minneapolis, MN Investment Properties for Sale
Browse homes for sale and investment properties in Minneapolis, MN. Refine your search by price, property type, or more.
Best cash flowing properties in Minneapolis, MN
Active
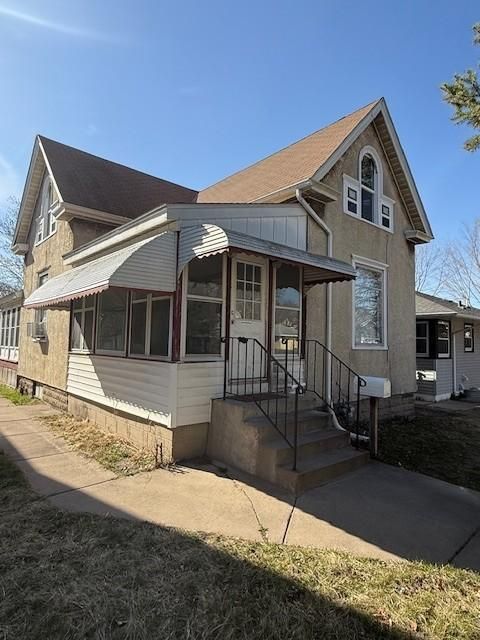
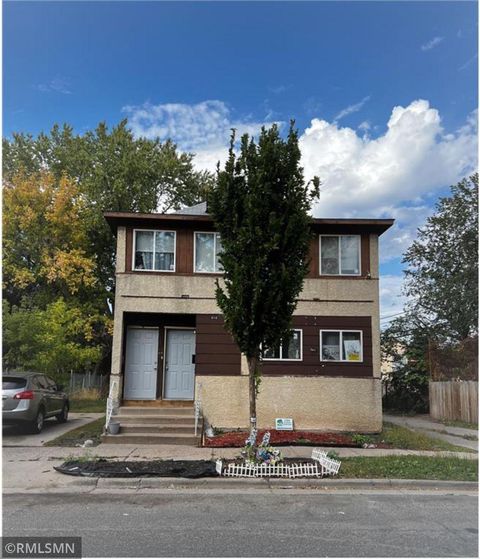
$182,900
3
bds
|
1
ba
|
1,228
sqft
|
built
1900
727 Upton Ave N, Minneapolis, MN 55411
$381
Cash flow
10.9%
Cash-on-Cash Return
8.2%
Cap rate
1.2%
Rent to Value Ratio
Active
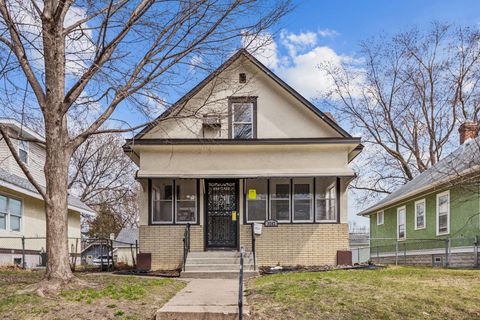
$219,900
3
bds
|
2
ba
|
1,252
sqft
|
built
1912
3242 Logan Ave N, Minneapolis, MN 55412
$276
Cash flow
6.5%
Cash-on-Cash Return
7.2%
Cap rate
1.0%
Rent to Value Ratio
1,076 out of 1,293 properties for sale in Minneapolis, MN
Limited Results Shown
Create a free account, or log in to reveal all property listings and enjoy the complete experience.
Active
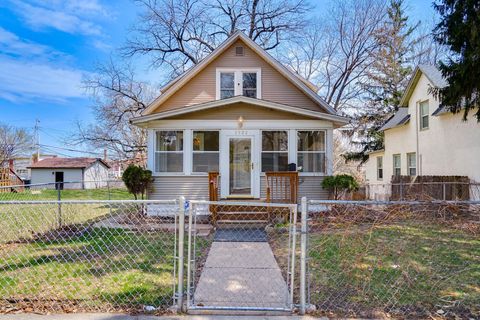
$270,000
3
bds
|
2
ba
|
2,218
sqft
|
built
1915
2522 Thomas Ave N, Minneapolis, MN 55411
$98
Cash flow
1.9%
Cash-on-Cash Return
6.1%
Cap rate
0.9%
Rent to Value Ratio

Active
$515,000
1
bds
|
2
ba
|
1,474
sqft
|
built
1913
801 Washington Ave N, Minneapolis, MN 55401
$-1,449
Cash flow
-14.7%
Cash-on-Cash Return
2.3%
Cap rate
0.6%
Rent to Value Ratio
Active
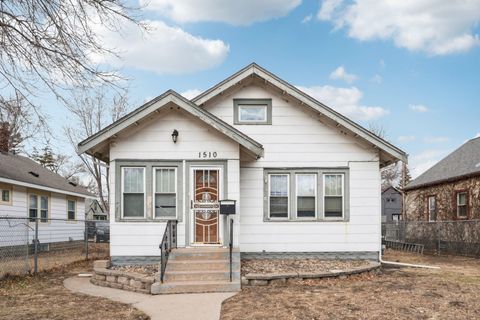
$219,900
3
bds
|
1
ba
|
1,021
sqft
|
built
1926
1510 44th Ave N, Minneapolis, MN 55412
$5
Cash flow
0.1%
Cash-on-Cash Return
5.7%
Cap rate
0.9%
Rent to Value Ratio

Active
$429,900
3
bds
|
2
ba
|
1,523
sqft
|
built
1985
201 2nd St NE, Minneapolis, MN 55413
$-1,231
Cash flow
-14.9%
Cash-on-Cash Return
2.2%
Cap rate
0.6%
Rent to Value Ratio
Active
$1,599,900
4
bds
|
4
ba
|
3,542
sqft
|
built
2025
4715 Zenith Ave S, Minneapolis, MN 55410
$-6,631
Cash flow
-21.6%
Cash-on-Cash Return
0.7%
Cap rate
0.1%
Rent to Value Ratio

Active
$379,900
1
bds
|
2
ba
|
1,038
sqft
|
built
2004
2840 Bryant Ave S, Minneapolis, MN 55408
$-817
Cash flow
-11.2%
Cash-on-Cash Return
3.1%
Cap rate
0.7%
Rent to Value Ratio
Active
$150,000
1
bds
|
1
ba
|
806
sqft
|
built
1930
2615 Park Ave, Minneapolis, MN 55407
$-791
Cash flow
-27.5%
Cash-on-Cash Return
-0.6%
Cap rate
1.2%
Rent to Value Ratio
Active
$212,900
1
bds
|
1
ba
|
710
sqft
|
built
2006
929 Portland Ave, Minneapolis, MN 55404
$-593
Cash flow
-14.5%
Cash-on-Cash Return
2.3%
Cap rate
0.8%
Rent to Value Ratio
Active
$379,900
2
bds
|
2
ba
|
1,268
sqft
|
built
2015
740 Portland Ave, Minneapolis, MN 55415
$-1,081
Cash flow
-14.8%
Cash-on-Cash Return
2.3%
Cap rate
0.7%
Rent to Value Ratio
Active
$80,000
1
bds
|
1
ba
|
675
sqft
|
built
1961
1800 Lasalle Ave, Minneapolis, MN 55403
$-67
Cash flow
-4.4%
Cash-on-Cash Return
4.7%
Cap rate
1.5%
Rent to Value Ratio
Active
$379,900
1
bds
|
1
ba
|
1,346
sqft
|
built
1923
1901 E Hennepin Ave, Minneapolis, MN 55413
$-833
Cash flow
-11.4%
Cash-on-Cash Return
3.0%
Cap rate
0.7%
Rent to Value Ratio
Active
$475,000
1
bds
|
1
ba
|
1,352
sqft
|
built
1922
718 Washington Ave N, Minneapolis, MN 55401
$-1,410
Cash flow
-15.5%
Cash-on-Cash Return
2.1%
Cap rate
0.7%
Rent to Value Ratio
Active
$359,000
4
bds
|
2
ba
|
3,008
sqft
|
built
1900
2405 Grand St NE, Minneapolis, MN 55418
$-151
Cash flow
-2.2%
Cash-on-Cash Return
5.2%
Cap rate
0.8%
Rent to Value Ratio
Active
$875,000
4
bds
|
5
ba
|
2,660
sqft
|
built
1900
2410 Irving Ave S, Minneapolis, MN 55405
$-2,427
Cash flow
-14.5%
Cash-on-Cash Return
2.4%
Cap rate
0.5%
Rent to Value Ratio
Active
$429,900
2
bds
|
2
ba
|
1,186
sqft
|
built
2006
215 10th Ave S, Minneapolis, MN 55415
$-1,226
Cash flow
-14.9%
Cash-on-Cash Return
2.3%
Cap rate
0.7%
Rent to Value Ratio

Active
$85,000
1
bds
|
1
ba
|
600
sqft
|
built
1925
1820 1st Ave S, Minneapolis, MN 55403
$-192
Cash flow
-11.8%
Cash-on-Cash Return
3.0%
Cap rate
1.5%
Rent to Value Ratio
Active
$224,000
2
bds
|
1
ba
|
840
sqft
|
built
1984
3047 Lake Shore Dr, Minneapolis, MN 55416
$-123
Cash flow
-2.9%
Cash-on-Cash Return
5.0%
Cap rate
0.9%
Rent to Value Ratio
Active
$1,395,000
6
bds
|
5
ba
|
5,737
sqft
|
built
1906
1767 Fremont Ave S, Minneapolis, MN 55403
$-3,795
Cash flow
-14.2%
Cash-on-Cash Return
2.4%
Cap rate
0.5%
Rent to Value Ratio
Active
$499,000
3
bds
|
3
ba
|
1,982
sqft
|
built
1919
1770 Humboldt Ave S, Minneapolis, MN 55403
$-1,203
Cash flow
-12.6%
Cash-on-Cash Return
2.8%
Cap rate
0.5%
Rent to Value Ratio

Active
$244,900
1
bds
|
1
ba
|
792
sqft
|
built
1900
250 Park Ave, Minneapolis, MN 55415
$-803
Cash flow
-17.1%
Cash-on-Cash Return
1.7%
Cap rate
0.8%
Rent to Value Ratio
Active
$3,550,000
5
bds
|
6
ba
|
7,900
sqft
|
built
1915
2774 W Lake Of The Isles Pkwy, Minneapolis, MN 55416
$-16,562
Cash flow
-24.3%
Cash-on-Cash Return
0.1%
Cap rate
0.2%
Rent to Value Ratio

Active
$187,500
3
bds
|
2
ba
|
1,200
sqft
|
built
1974
4001 Heritage Hills Dr, Minneapolis, MN 55437
$-257
Cash flow
-7.2%
Cash-on-Cash Return
4.0%
Cap rate
1.0%
Rent to Value Ratio
Active
$674,000
5
bds
|
3
ba
|
3,576
sqft
|
built
1905
3035 Irving Ave S, Minneapolis, MN 55408
$-2,287
Cash flow
-17.7%
Cash-on-Cash Return
1.6%
Cap rate
0.4%
Rent to Value Ratio

Active
$315,000
2
bds
|
2
ba
|
1,032
sqft
|
built
1999
645 N 1st St, Minneapolis, MN 55401
$-496
Cash flow
-8.2%
Cash-on-Cash Return
3.8%
Cap rate
0.8%
Rent to Value Ratio
Active
$99,500
bds
|
1
ba
|
341
sqft
|
built
1960
2639 Colfax Ave S, Minneapolis, MN 55408
$-205
Cash flow
-10.7%
Cash-on-Cash Return
3.2%
Cap rate
0.9%
Rent to Value Ratio
Active
$185,000
2
bds
|
2
ba
|
1,035
sqft
|
built
1972
450 Ford Rd, Minneapolis, MN 55426
$-930
Cash flow
-26.2%
Cash-on-Cash Return
-0.4%
Cap rate
1.0%
Rent to Value Ratio

Active
$128,500
1
bds
|
1
ba
|
610
sqft
|
built
1966
3236 Garfield Ave, Minneapolis, MN 55408
$-285
Cash flow
-11.6%
Cash-on-Cash Return
3.0%
Cap rate
1.0%
Rent to Value Ratio
Active
$229,999
4
bds
|
2
ba
|
2,592
sqft
|
built
1915
414 33rd Ave N, Minneapolis, MN 55412
$-169
Cash flow
-3.8%
Cash-on-Cash Return
4.8%
Cap rate
0.8%
Rent to Value Ratio
Active
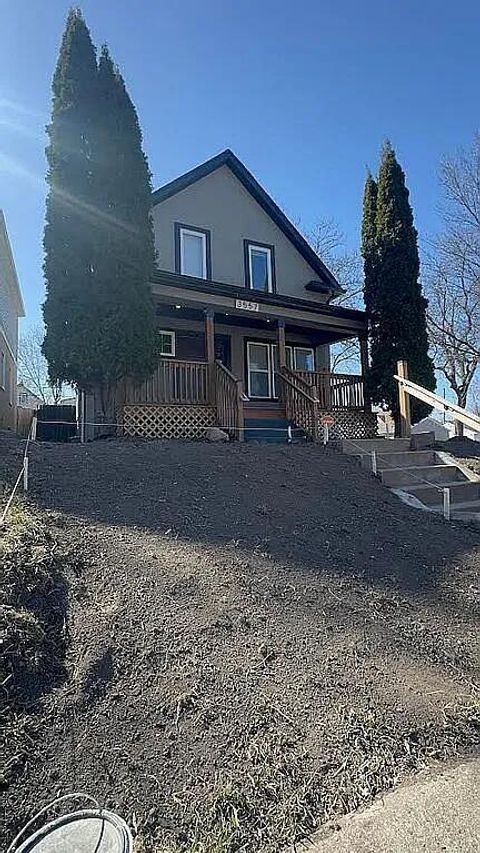
$340,000
4
bds
|
3
ba
|
1,600
sqft
|
built
1913
3557 Dupont Ave N, Minneapolis, MN 55412
$-1,195
Cash flow
-18.3%
Cash-on-Cash Return
1.5%
Cap rate
0.5%
Rent to Value Ratio
Active
$182,900
3
bds
|
1
ba
|
1,228
sqft
|
built
1900
727 Upton Ave N, Minneapolis, MN 55411
$381
Cash flow
10.9%
Cash-on-Cash Return
8.2%
Cap rate
1.2%
Rent to Value Ratio
Active
$395,000
4
bds
|
2
ba
|
1,800
sqft
|
built
1959
5608 28th Ave S, Minneapolis, MN 55417
$-798
Cash flow
-10.5%
Cash-on-Cash Return
3.3%
Cap rate
0.6%
Rent to Value Ratio

Active
$1,025,000
3
bds
|
2
ba
|
2,933
sqft
|
built
1900
702 N 1st St, Minneapolis, MN 55401
$-4,350
Cash flow
-22.1%
Cash-on-Cash Return
0.6%
Cap rate
0.6%
Rent to Value Ratio

Active
$154,000
1
bds
|
1
ba
|
687
sqft
|
built
1965
15 S 1st St, Minneapolis, MN 55401
$-386
Cash flow
-13.1%
Cash-on-Cash Return
2.7%
Cap rate
1.0%
Rent to Value Ratio
Active
$219,900
3
bds
|
2
ba
|
1,252
sqft
|
built
1912
3242 Logan Ave N, Minneapolis, MN 55412
$276
Cash flow
6.5%
Cash-on-Cash Return
7.2%
Cap rate
1.0%
Rent to Value Ratio
Active
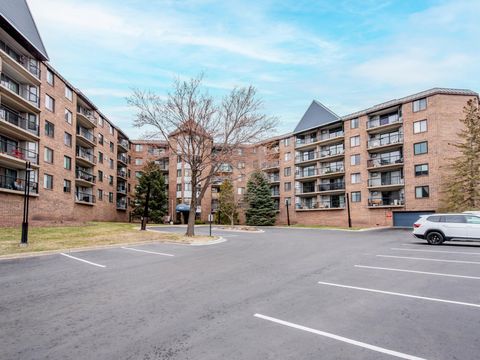
$121,900
1
bds
|
1
ba
|
718
sqft
|
built
1985
2601 Kenzie Ter, Minneapolis, MN 55418
$-266
Cash flow
-11.4%
Cash-on-Cash Return
3.1%
Cap rate
1.1%
Rent to Value Ratio
Active
$365,000
3
bds
|
2
ba
|
1,619
sqft
|
built
1960
11601 Wren St NW, Minneapolis, MN 55433
$-206
Cash flow
-2.9%
Cash-on-Cash Return
5.0%
Cap rate
0.7%
Rent to Value Ratio
Active
$299,000
1
bds
|
2
ba
|
1,000
sqft
|
built
2007
929 Portland Ave, Minneapolis, MN 55404
$-923
Cash flow
-16.1%
Cash-on-Cash Return
2.0%
Cap rate
0.8%
Rent to Value Ratio
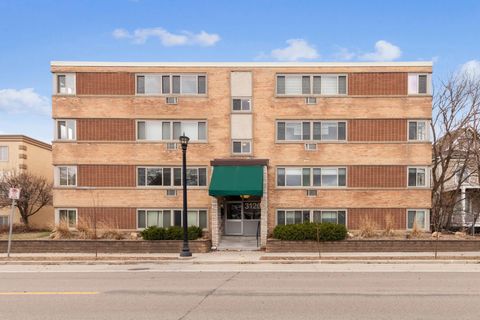
Active
$123,000
1
bds
|
1
ba
|
640
sqft
|
built
1958
3120 Hennepin Ave, Minneapolis, MN 55408
$-509
Cash flow
-21.6%
Cash-on-Cash Return
0.7%
Cap rate
1.0%
Rent to Value Ratio
Active
$332,500
5
bds
|
3
ba
|
2,671
sqft
|
built
1905
2939 Girard Ave N, Minneapolis, MN 55411
$-577
Cash flow
-9.1%
Cash-on-Cash Return
3.6%
Cap rate
0.6%
Rent to Value Ratio
Active
$190,000
2
bds
|
1
ba
|
993
sqft
|
built
1900
1802 4th Ave S, Minneapolis, MN 55404
$-343
Cash flow
-9.4%
Cash-on-Cash Return
3.5%
Cap rate
0.9%
Rent to Value Ratio