Minneapolis, MN Investment Properties for Sale
Browse homes for sale and investment properties in Minneapolis, MN. Refine your search by price, property type, or more.
Best cash flowing properties in Minneapolis, MN
Active
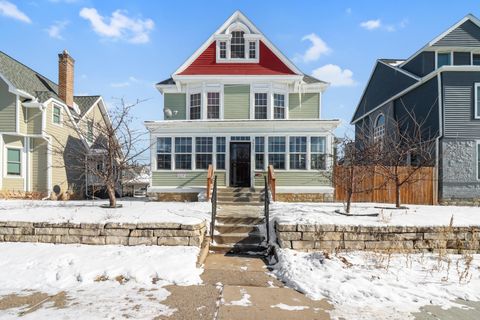
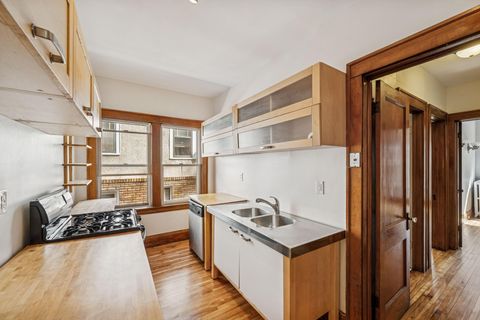
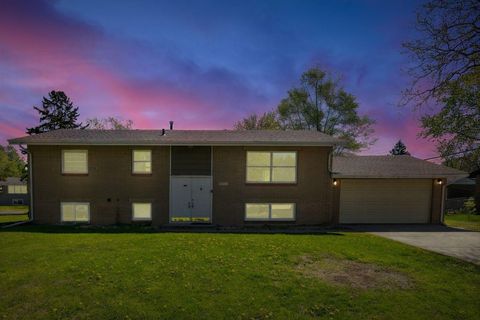
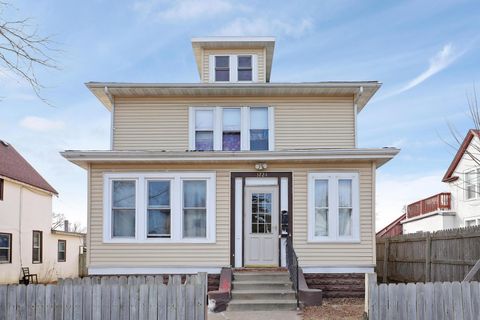
$499,900
5
bds
|
4
ba
|
3,503
sqft
|
built
1901
2637 Portland Ave, Minneapolis, MN 55407
$1,080
Cash flow
11.3%
Cash-on-Cash Return
8.3%
Cap rate
1.1%
Rent to Value Ratio
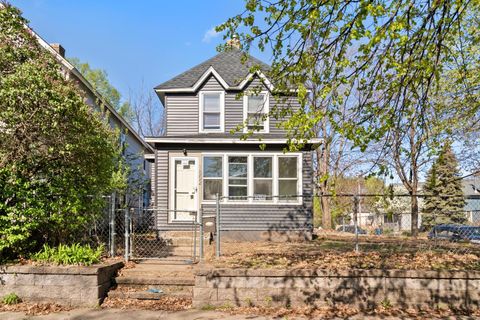
Active
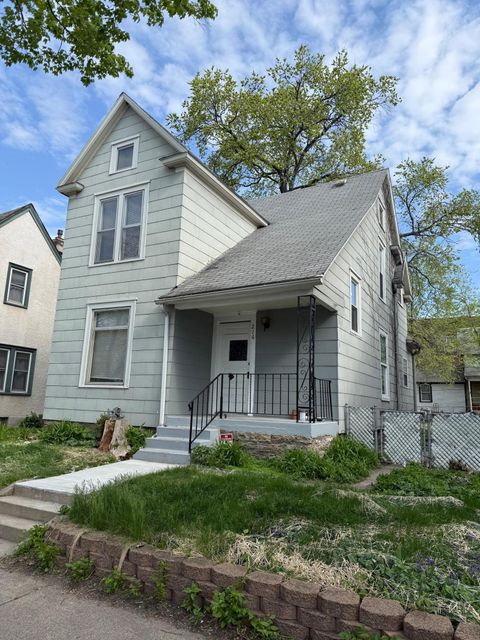
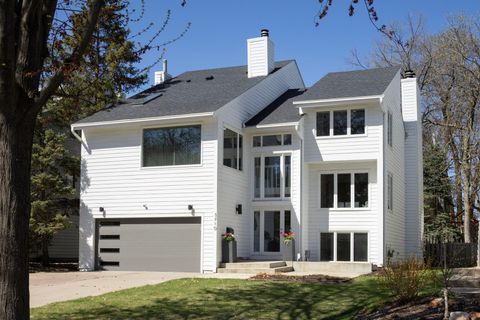
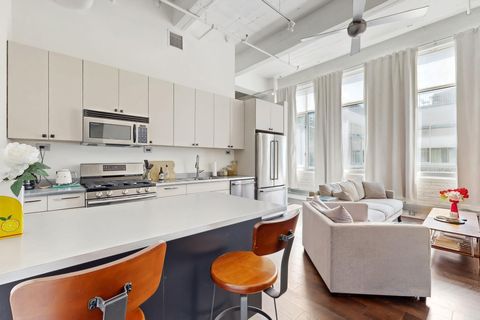
$285,000
4
bds
|
2
ba
|
1,646
sqft
|
built
1900
216 E 27th St, Minneapolis, MN 55408
$122
Cash flow
2.2%
Cash-on-Cash Return
6.2%
Cap rate
0.9%
Rent to Value Ratio
1,063 out of 1,279 properties for sale in Minneapolis, MN
Limited Results Shown
Create a free account, or log in to reveal all property listings and enjoy the complete experience.
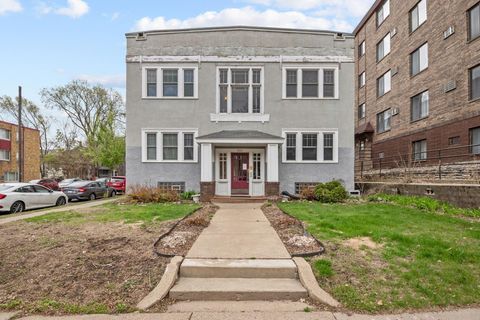
Active
$285,000
4
bds
|
2
ba
|
1,646
sqft
|
built
1900
216 E 27th St, Minneapolis, MN 55408
$122
Cash flow
2.2%
Cash-on-Cash Return
6.2%
Cap rate
0.9%
Rent to Value Ratio
Active
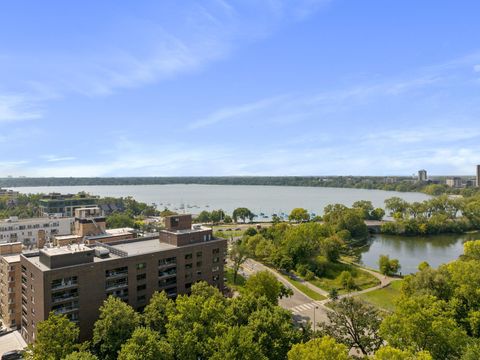
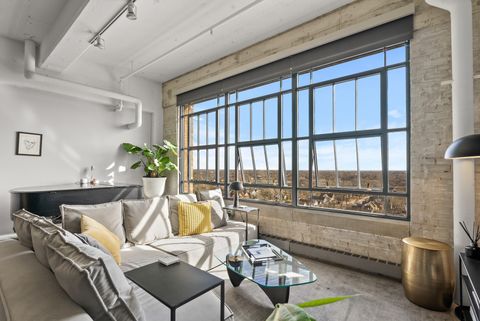
$219,900
1
bds
|
1
ba
|
875
sqft
|
built
1979
2885 Knox Ave S, Minneapolis, MN 55408
$-677
Cash flow
-16.1%
Cash-on-Cash Return
2.0%
Cap rate
0.9%
Rent to Value Ratio
Active
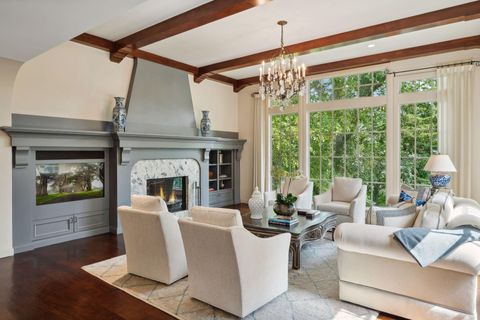
$499,900
5
bds
|
2
ba
|
2,070
sqft
|
built
1900
1510 Grand St NE, Minneapolis, MN 55413
$-1,319
Cash flow
-13.8%
Cash-on-Cash Return
2.5%
Cap rate
0.5%
Rent to Value Ratio
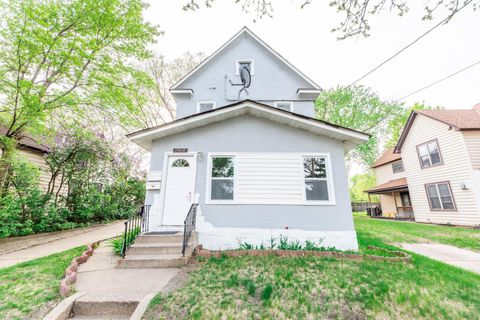
Active
$167,500
2
bds
|
1
ba
|
978
sqft
|
built
1920
3441 Portland Ave, Minneapolis, MN 55407
$-182
Cash flow
-5.7%
Cash-on-Cash Return
4.4%
Cap rate
1.1%
Rent to Value Ratio
Active
$1,450,000
4
bds
|
4
ba
|
3,764
sqft
|
built
1979
3710 Vincent Ave S, Minneapolis, MN 55410
$-4,895
Cash flow
-17.6%
Cash-on-Cash Return
1.6%
Cap rate
0.3%
Rent to Value Ratio
Active
$205,000
1
bds
|
1
ba
|
980
sqft
|
built
1900
2929 Chicago Ave, Minneapolis, MN 55407
$-440
Cash flow
-11.2%
Cash-on-Cash Return
3.1%
Cap rate
1.0%
Rent to Value Ratio
Active
$1,695,000
3
bds
|
3
ba
|
5,720
sqft
|
built
1927
4831 Sheridan Ave S, Minneapolis, MN 55410
$-5,078
Cash flow
-15.6%
Cash-on-Cash Return
2.1%
Cap rate
0.5%
Rent to Value Ratio
Active
$485,000
2
bds
|
2
ba
|
1,833
sqft
|
built
1985
222 Groveland Ave, Minneapolis, MN 55403
$-1,327
Cash flow
-14.3%
Cash-on-Cash Return
2.4%
Cap rate
0.5%
Rent to Value Ratio

Active
$214,900
2
bds
|
2
ba
|
1,070
sqft
|
built
1965
19 S 1st St, Minneapolis, MN 55401
$-861
Cash flow
-20.9%
Cash-on-Cash Return
0.9%
Cap rate
0.9%
Rent to Value Ratio
Active
$325,000
4
bds
|
2
ba
|
1,504
sqft
|
built
1924
2929 36th Ave S, Minneapolis, MN 55406
$-360
Cash flow
-5.8%
Cash-on-Cash Return
4.9%
Cap rate
0.8%
Rent to Value Ratio
Active
$825,000
7
bds
|
5
ba
|
5,363
sqft
|
built
1908
1121 Douglas Ave, Minneapolis, MN 55403
$-2,956
Cash flow
-18.7%
Cash-on-Cash Return
1.4%
Cap rate
0.4%
Rent to Value Ratio
Active
$1,695,000
3
bds
|
4
ba
|
3,293
sqft
|
built
2006
100 3rd Ave S, Minneapolis, MN 55401
$-7,616
Cash flow
-23.4%
Cash-on-Cash Return
0.3%
Cap rate
0.5%
Rent to Value Ratio
Active
$1,195,000
2
bds
|
3
ba
|
2,422
sqft
|
built
2017
1240 S 2nd St, Minneapolis, MN 55415
$-4,147
Cash flow
-18.1%
Cash-on-Cash Return
2.1%
Cap rate
0.6%
Rent to Value Ratio

Active
$369,000
2
bds
|
2
ba
|
1,172
sqft
|
built
2006
317 Groveland Ave, Minneapolis, MN 55403
$-1,345
Cash flow
-19.0%
Cash-on-Cash Return
1.3%
Cap rate
0.6%
Rent to Value Ratio
Active
$375,000
2
bds
|
2
ba
|
1,120
sqft
|
built
2006
929 Portland Ave, Minneapolis, MN 55404
$-1,051
Cash flow
-14.6%
Cash-on-Cash Return
2.3%
Cap rate
0.7%
Rent to Value Ratio
Active
$277,000
1
bds
|
1
ba
|
723
sqft
|
built
1900
400 N 1st St, Minneapolis, MN 55401
$-727
Cash flow
-13.7%
Cash-on-Cash Return
2.5%
Cap rate
0.7%
Rent to Value Ratio

Active
$665,000
4
bds
|
4
ba
|
2,530
sqft
|
built
1916
1767 Girard Ave S, Minneapolis, MN 55403
$-1,497
Cash flow
-11.7%
Cash-on-Cash Return
3.0%
Cap rate
0.5%
Rent to Value Ratio

Active
$159,900
1
bds
|
1
ba
|
687
sqft
|
built
1895
609 S 9th St, Minneapolis, MN 55404
$-288
Cash flow
-9.4%
Cash-on-Cash Return
3.5%
Cap rate
0.9%
Rent to Value Ratio

Active
$299,900
2
bds
|
2
ba
|
943
sqft
|
built
2005
619 8th St SE, Minneapolis, MN 55414
$-705
Cash flow
-12.3%
Cash-on-Cash Return
2.9%
Cap rate
0.7%
Rent to Value Ratio

Active
$565,000
6
bds
|
2
ba
|
2,633
sqft
|
built
1920
3816 Lyndale Ave S, Minneapolis, MN 55409
$-1,823
Cash flow
-16.8%
Cash-on-Cash Return
1.8%
Cap rate
0.4%
Rent to Value Ratio
Active
$299,900
4
bds
|
2
ba
|
2,040
sqft
|
built
1922
1634 Upton Ave N, Minneapolis, MN 55411
$-420
Cash flow
-7.3%
Cash-on-Cash Return
4.0%
Cap rate
0.7%
Rent to Value Ratio

Active
$350,000
3
bds
|
1
ba
|
1,450
sqft
|
built
1913
2407 Girard Ave S, Minneapolis, MN 55405
$-1,086
Cash flow
-16.2%
Cash-on-Cash Return
2.0%
Cap rate
0.7%
Rent to Value Ratio
Active
$389,900
3
bds
|
3
ba
|
2,130
sqft
|
built
2004
13775 54th Ave N, Minneapolis, MN 55446
$-557
Cash flow
-7.5%
Cash-on-Cash Return
4.0%
Cap rate
0.7%
Rent to Value Ratio
Active
$179,900
1
bds
|
1
ba
|
776
sqft
|
built
1979
210 W Grant St, Minneapolis, MN 55403
$-1,164
Cash flow
-33.8%
Cash-on-Cash Return
-1.5%
Cap rate
0.7%
Rent to Value Ratio

Active
$360,000
4
bds
|
2
ba
|
0
sqft
|
built
1900
3124 Colfax Ave S, Minneapolis, MN 55408
$-758
Cash flow
-11.0%
Cash-on-Cash Return
3.2%
Cap rate
0.6%
Rent to Value Ratio
Active
$474,900
4
bds
|
3
ba
|
2,464
sqft
|
built
1997
222 Ridgewood Ave, Minneapolis, MN 55403
$-1,514
Cash flow
-16.6%
Cash-on-Cash Return
2.4%
Cap rate
0.7%
Rent to Value Ratio
Active
$390,000
4
bds
|
3
ba
|
1,710
sqft
|
built
1915
4015 Queen Ave N, Minneapolis, MN 55412
$-442
Cash flow
-5.9%
Cash-on-Cash Return
4.3%
Cap rate
0.6%
Rent to Value Ratio
Active
$330,000
4
bds
|
3
ba
|
2,088
sqft
|
built
1967
8040 Xenia Ave N, Minneapolis, MN 55443
$-86
Cash flow
-1.4%
Cash-on-Cash Return
5.4%
Cap rate
0.8%
Rent to Value Ratio
Active
$299,900
1
bds
|
1
ba
|
675
sqft
|
built
1920
700 Washington Ave N, Minneapolis, MN 55401
$-1,100
Cash flow
-19.1%
Cash-on-Cash Return
1.3%
Cap rate
0.5%
Rent to Value Ratio

Active
$449,900
2
bds
|
2
ba
|
1,471
sqft
|
built
2004
500 E Grant St, Minneapolis, MN 55404
$-1,595
Cash flow
-18.5%
Cash-on-Cash Return
1.4%
Cap rate
0.7%
Rent to Value Ratio
Active
$229,900
2
bds
|
1
ba
|
1,022
sqft
|
built
1922
3501 Dupont Ave S, Minneapolis, MN 55408
$-415
Cash flow
-9.4%
Cash-on-Cash Return
3.5%
Cap rate
0.8%
Rent to Value Ratio
Active
$344,000
3
bds
|
1
ba
|
1,580
sqft
|
built
1950
5748 25th Ave S, Minneapolis, MN 55417
$-419
Cash flow
-6.4%
Cash-on-Cash Return
4.2%
Cap rate
0.7%
Rent to Value Ratio
Active
$295,000
1
bds
|
1
ba
|
810
sqft
|
built
1920
700 Washington Ave N, Minneapolis, MN 55401
$-738
Cash flow
-13.1%
Cash-on-Cash Return
2.7%
Cap rate
0.7%
Rent to Value Ratio

Active
$489,900
2
bds
|
2
ba
|
1,730
sqft
|
built
1941
5001 Thomas Ave S, Minneapolis, MN 55410
$-1,743
Cash flow
-18.6%
Cash-on-Cash Return
2.0%
Cap rate
0.4%
Rent to Value Ratio
Active
$279,900
2
bds
|
1
ba
|
1,024
sqft
|
built
1900
1852 Quincy St NE, Minneapolis, MN 55418
$55
Cash flow
1.0%
Cash-on-Cash Return
5.9%
Cap rate
0.7%
Rent to Value Ratio

Active
$899,900
4
bds
|
3
ba
|
2,415
sqft
|
built
1927
5128 Irving Ave S, Minneapolis, MN 55419
$-2,698
Cash flow
-15.6%
Cash-on-Cash Return
2.1%
Cap rate
0.4%
Rent to Value Ratio
Active
$499,900
5
bds
|
4
ba
|
3,503
sqft
|
built
1901
2637 Portland Ave, Minneapolis, MN 55407
$1,080
Cash flow
11.3%
Cash-on-Cash Return
8.3%
Cap rate
1.1%
Rent to Value Ratio
Active
$410,000
6
bds
|
2
ba
|
2,384
sqft
|
built
1912
3724 Bloomington Ave, Minneapolis, MN 55407
$-974
Cash flow
-12.4%
Cash-on-Cash Return
2.8%
Cap rate
0.5%
Rent to Value Ratio
Active
$249,000
1
bds
|
1
ba
|
907
sqft
|
built
2004
500 E Grant St, Minneapolis, MN 55404
$-1,073
Cash flow
-22.5%
Cash-on-Cash Return
0.5%
Cap rate
0.7%
Rent to Value Ratio
Active
$375,000
3
bds
|
2
ba
|
1,567
sqft
|
built
2002
3014 E 39th St, Minneapolis, MN 55406
$-613
Cash flow
-8.5%
Cash-on-Cash Return
3.7%
Cap rate
0.7%
Rent to Value Ratio