Minneapolis, MN Investment Properties for Sale
Browse homes for sale and investment properties in Minneapolis, MN. Refine your search by price, property type, or more.
Best cash flowing properties in Minneapolis, MN

Active
$99,900
2
bds
|
1
ba
|
748
sqft
|
built
1922
2938 Penn Ave N, Minneapolis, MN 55411
$425
Cash flow
22.2%
Cash-on-Cash Return
10.8%
Cap rate
1.4%
Rent to Value Ratio
Active
$89,900
1
bds
|
1
ba
|
560
sqft
|
built
1919
1901 Stevens Ave, Minneapolis, MN 55403
$-49
Cash flow
-2.8%
Cash-on-Cash Return
5.0%
Cap rate
1.3%
Rent to Value Ratio
1,012 out of 1,224 properties for sale in Minneapolis, MN
Limited Results Shown
Create a free account, or log in to reveal all property listings and enjoy the complete experience.
Active
$179,900
2
bds
|
1
ba
|
937
sqft
|
built
1982
1720 3rd Ave S, Minneapolis, MN 55404
$-336
Cash flow
-9.7%
Cash-on-Cash Return
3.4%
Cap rate
0.9%
Rent to Value Ratio
Active
$359,000
4
bds
|
3
ba
|
2,534
sqft
|
built
1900
1070 21st Ave SE, Minneapolis, MN 55414
$-594
Cash flow
-8.6%
Cash-on-Cash Return
3.7%
Cap rate
0.6%
Rent to Value Ratio
Active
$549,900
2
bds
|
2
ba
|
2,200
sqft
|
built
1978
1225 Lasalle Ave, Minneapolis, MN 55403
$-364
Cash flow
-3.5%
Cash-on-Cash Return
4.9%
Cap rate
1.5%
Rent to Value Ratio
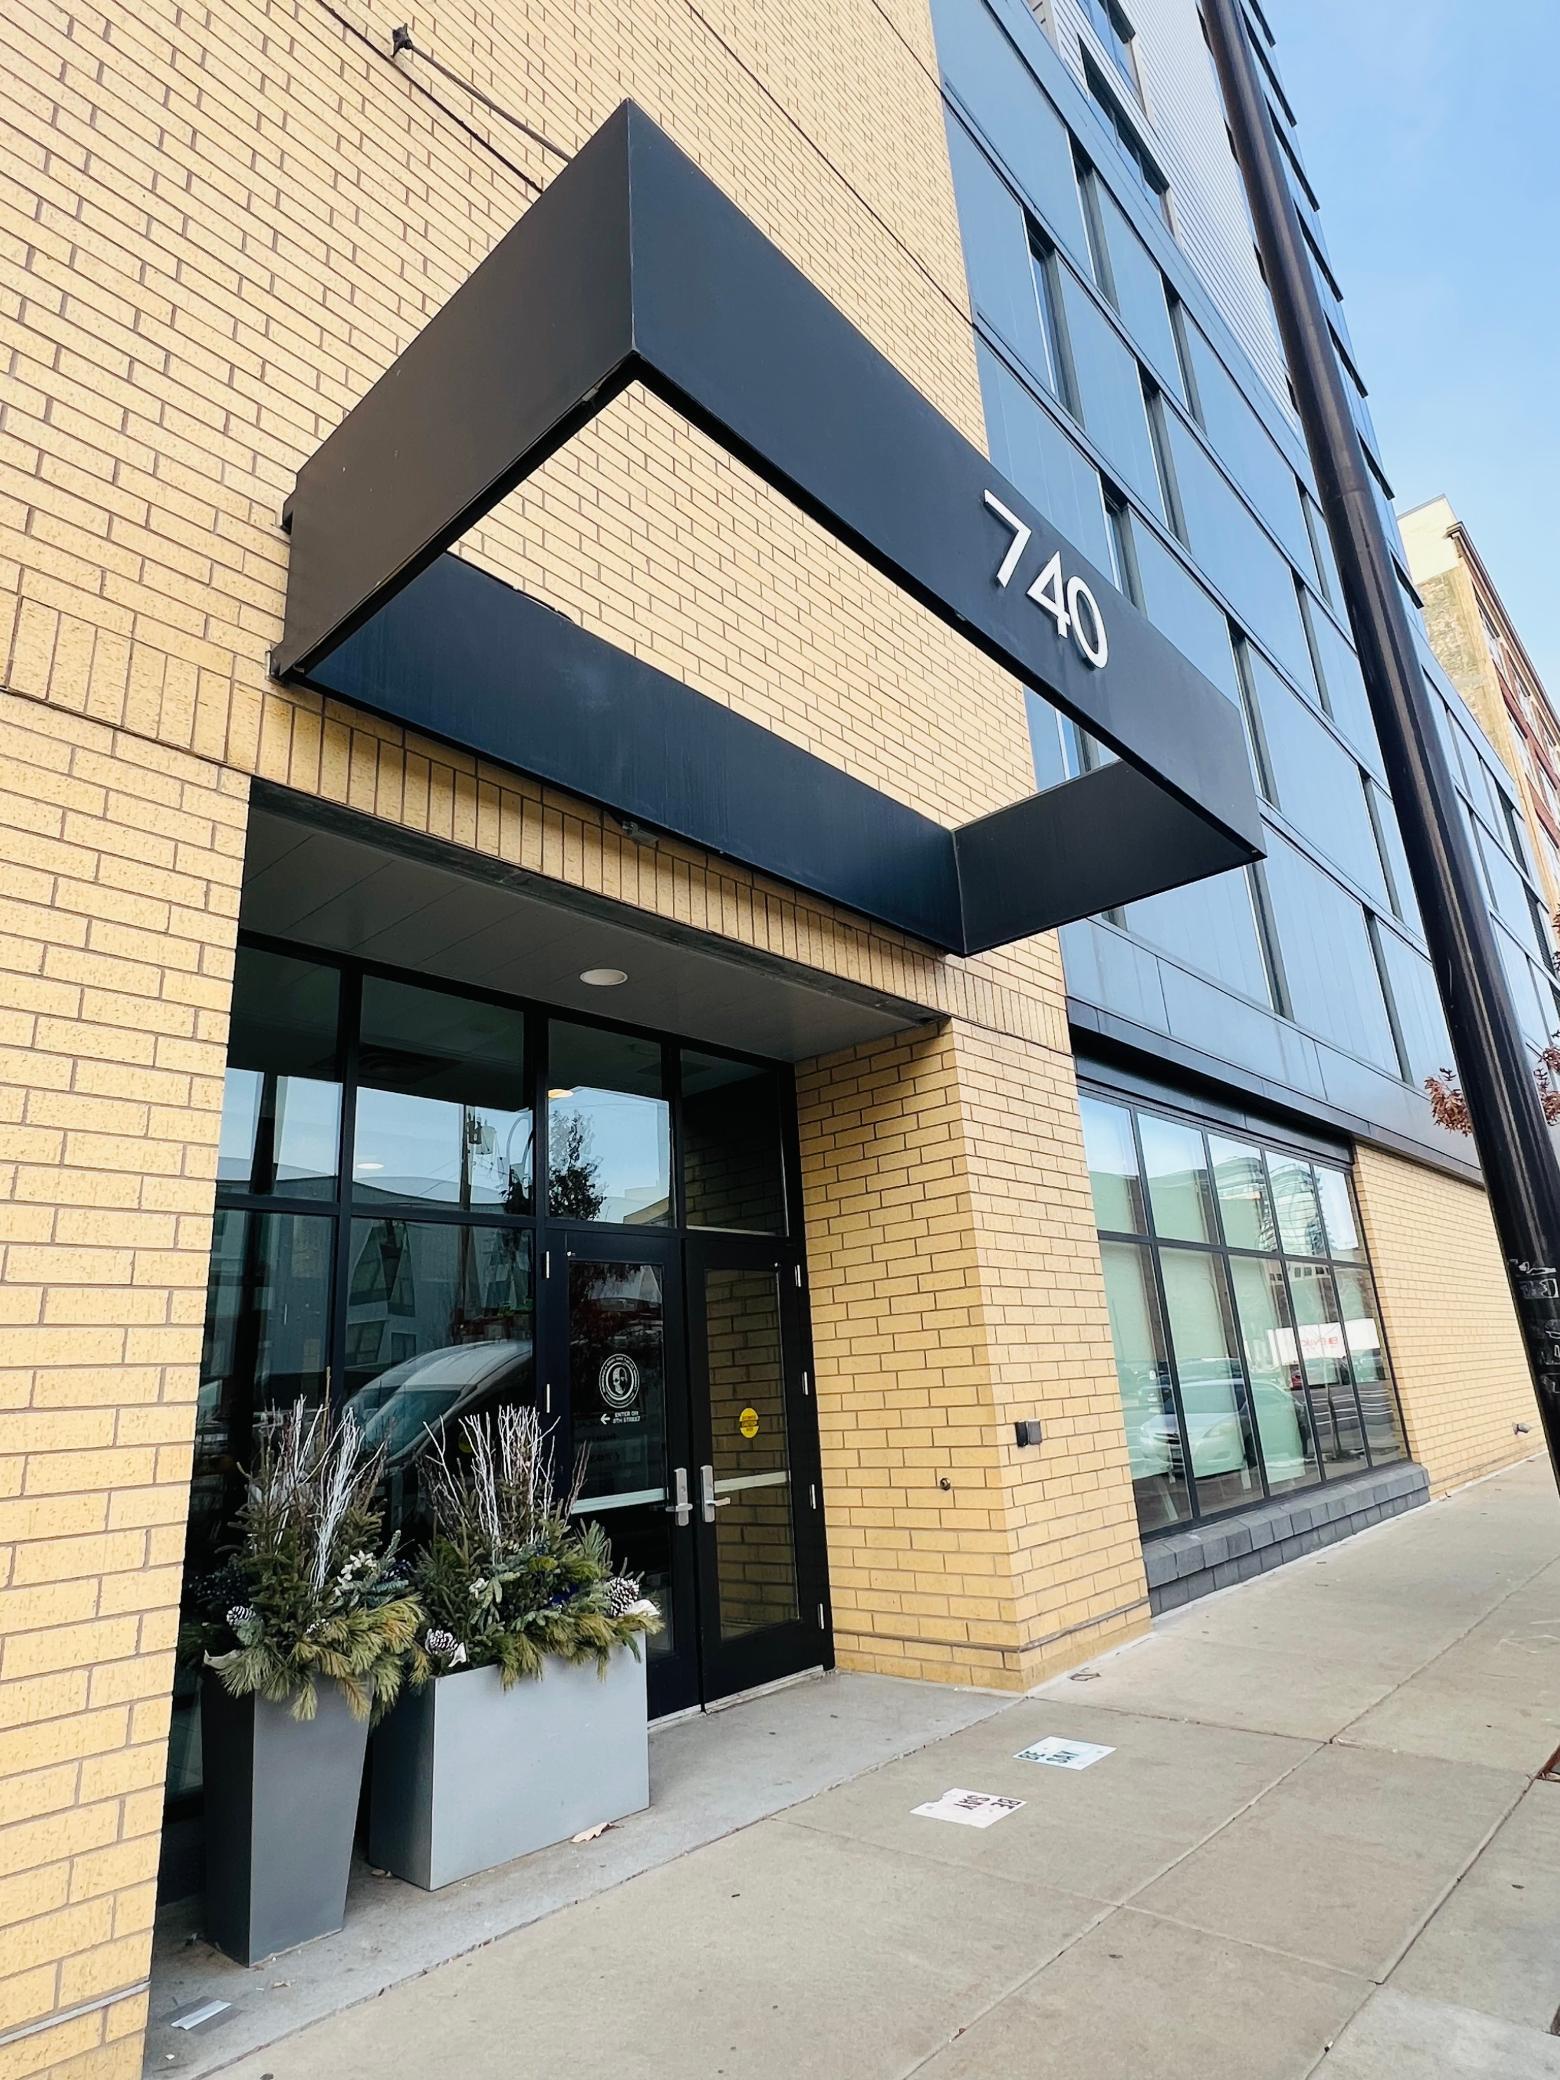
Active
$399,900
2
bds
|
2
ba
|
983
sqft
|
built
2015
740 Portland Ave, Minneapolis, MN 55415
$-1,067
Cash flow
-13.9%
Cash-on-Cash Return
2.5%
Cap rate
0.7%
Rent to Value Ratio
Active
$255,000
1
bds
|
1
ba
|
885
sqft
|
built
1979
2885 Knox Ave S, Minneapolis, MN 55408
$-941
Cash flow
-19.3%
Cash-on-Cash Return
1.3%
Cap rate
0.7%
Rent to Value Ratio
Active
$1,395,000
5
bds
|
5
ba
|
5,183
sqft
|
built
1907
1770 Knox Ave S, Minneapolis, MN 55403
$-3,543
Cash flow
-13.3%
Cash-on-Cash Return
2.6%
Cap rate
0.5%
Rent to Value Ratio

Active
$799,900
2
bds
|
3
ba
|
2,930
sqft
|
built
2006
317 Groveland Ave, Minneapolis, MN 55403
$-3,176
Cash flow
-20.7%
Cash-on-Cash Return
0.9%
Cap rate
0.6%
Rent to Value Ratio
Active
$89,900
1
bds
|
1
ba
|
560
sqft
|
built
1919
1901 Stevens Ave, Minneapolis, MN 55403
$-49
Cash flow
-2.8%
Cash-on-Cash Return
5.0%
Cap rate
1.3%
Rent to Value Ratio
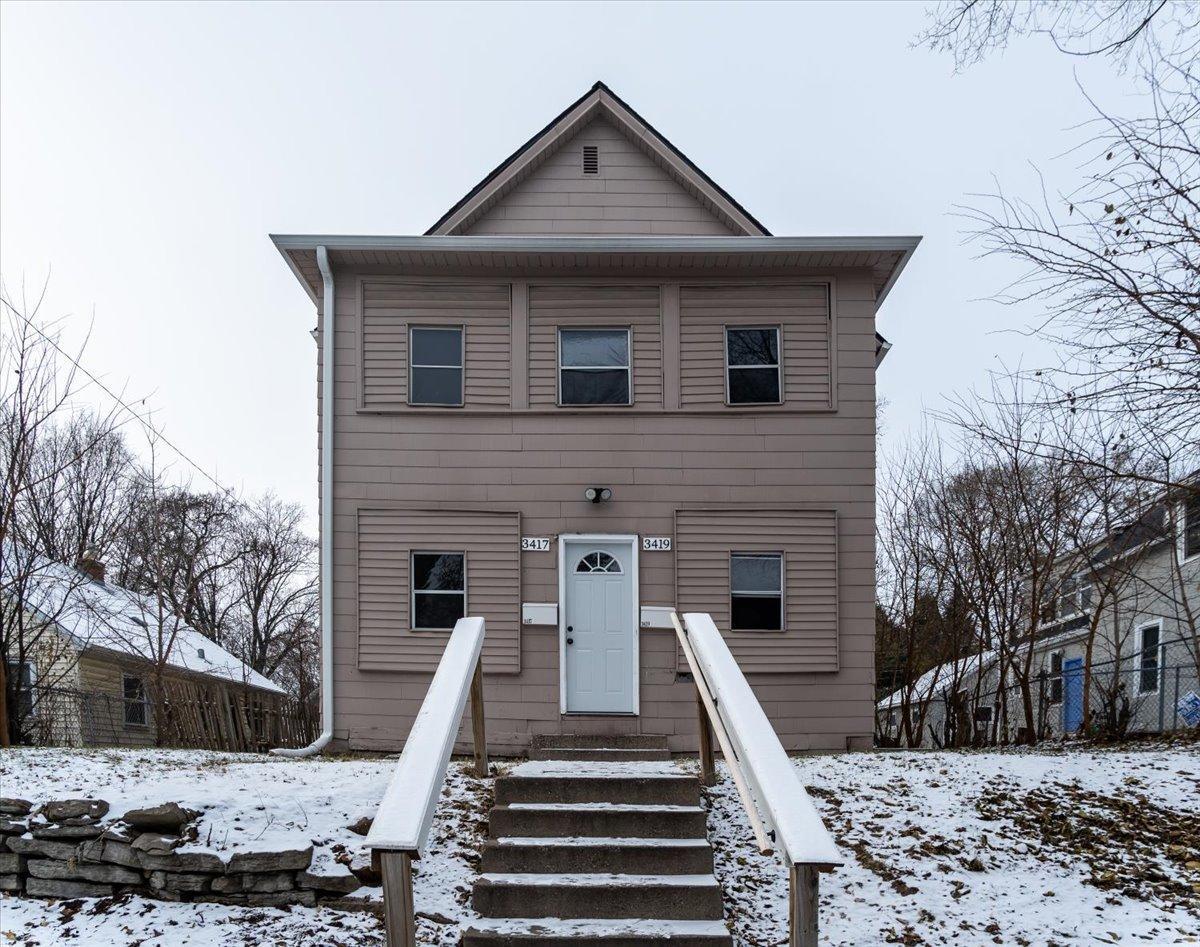
Active
$245,000
6
bds
|
2
ba
|
1,824
sqft
|
built
1892
3417 Bryant Ave N, Minneapolis, MN 55412
$-371
Cash flow
-7.9%
Cash-on-Cash Return
3.9%
Cap rate
0.7%
Rent to Value Ratio
Active
$649,000
6
bds
|
2
ba
|
3,368
sqft
|
built
1925
4752 Lyndale Ave S, Minneapolis, MN 55419
$-2,265
Cash flow
-18.2%
Cash-on-Cash Return
1.5%
Cap rate
0.4%
Rent to Value Ratio
Active
$775,000
3
bds
|
4
ba
|
3,270
sqft
|
built
1978
1225 Lasalle Ave, Minneapolis, MN 55403
$-4,541
Cash flow
-30.6%
Cash-on-Cash Return
-1.4%
Cap rate
0.7%
Rent to Value Ratio
Active
$164,900
1
bds
|
1
ba
|
865
sqft
|
built
2006
2929 Chicago Ave, Minneapolis, MN 55407
$-162
Cash flow
-5.1%
Cash-on-Cash Return
4.5%
Cap rate
1.2%
Rent to Value Ratio
Active
$84,900
bds
|
1
ba
|
605
sqft
|
built
1973
1920 S 1st St, Minneapolis, MN 55454
$-465
Cash flow
-28.6%
Cash-on-Cash Return
-0.9%
Cap rate
1.5%
Rent to Value Ratio
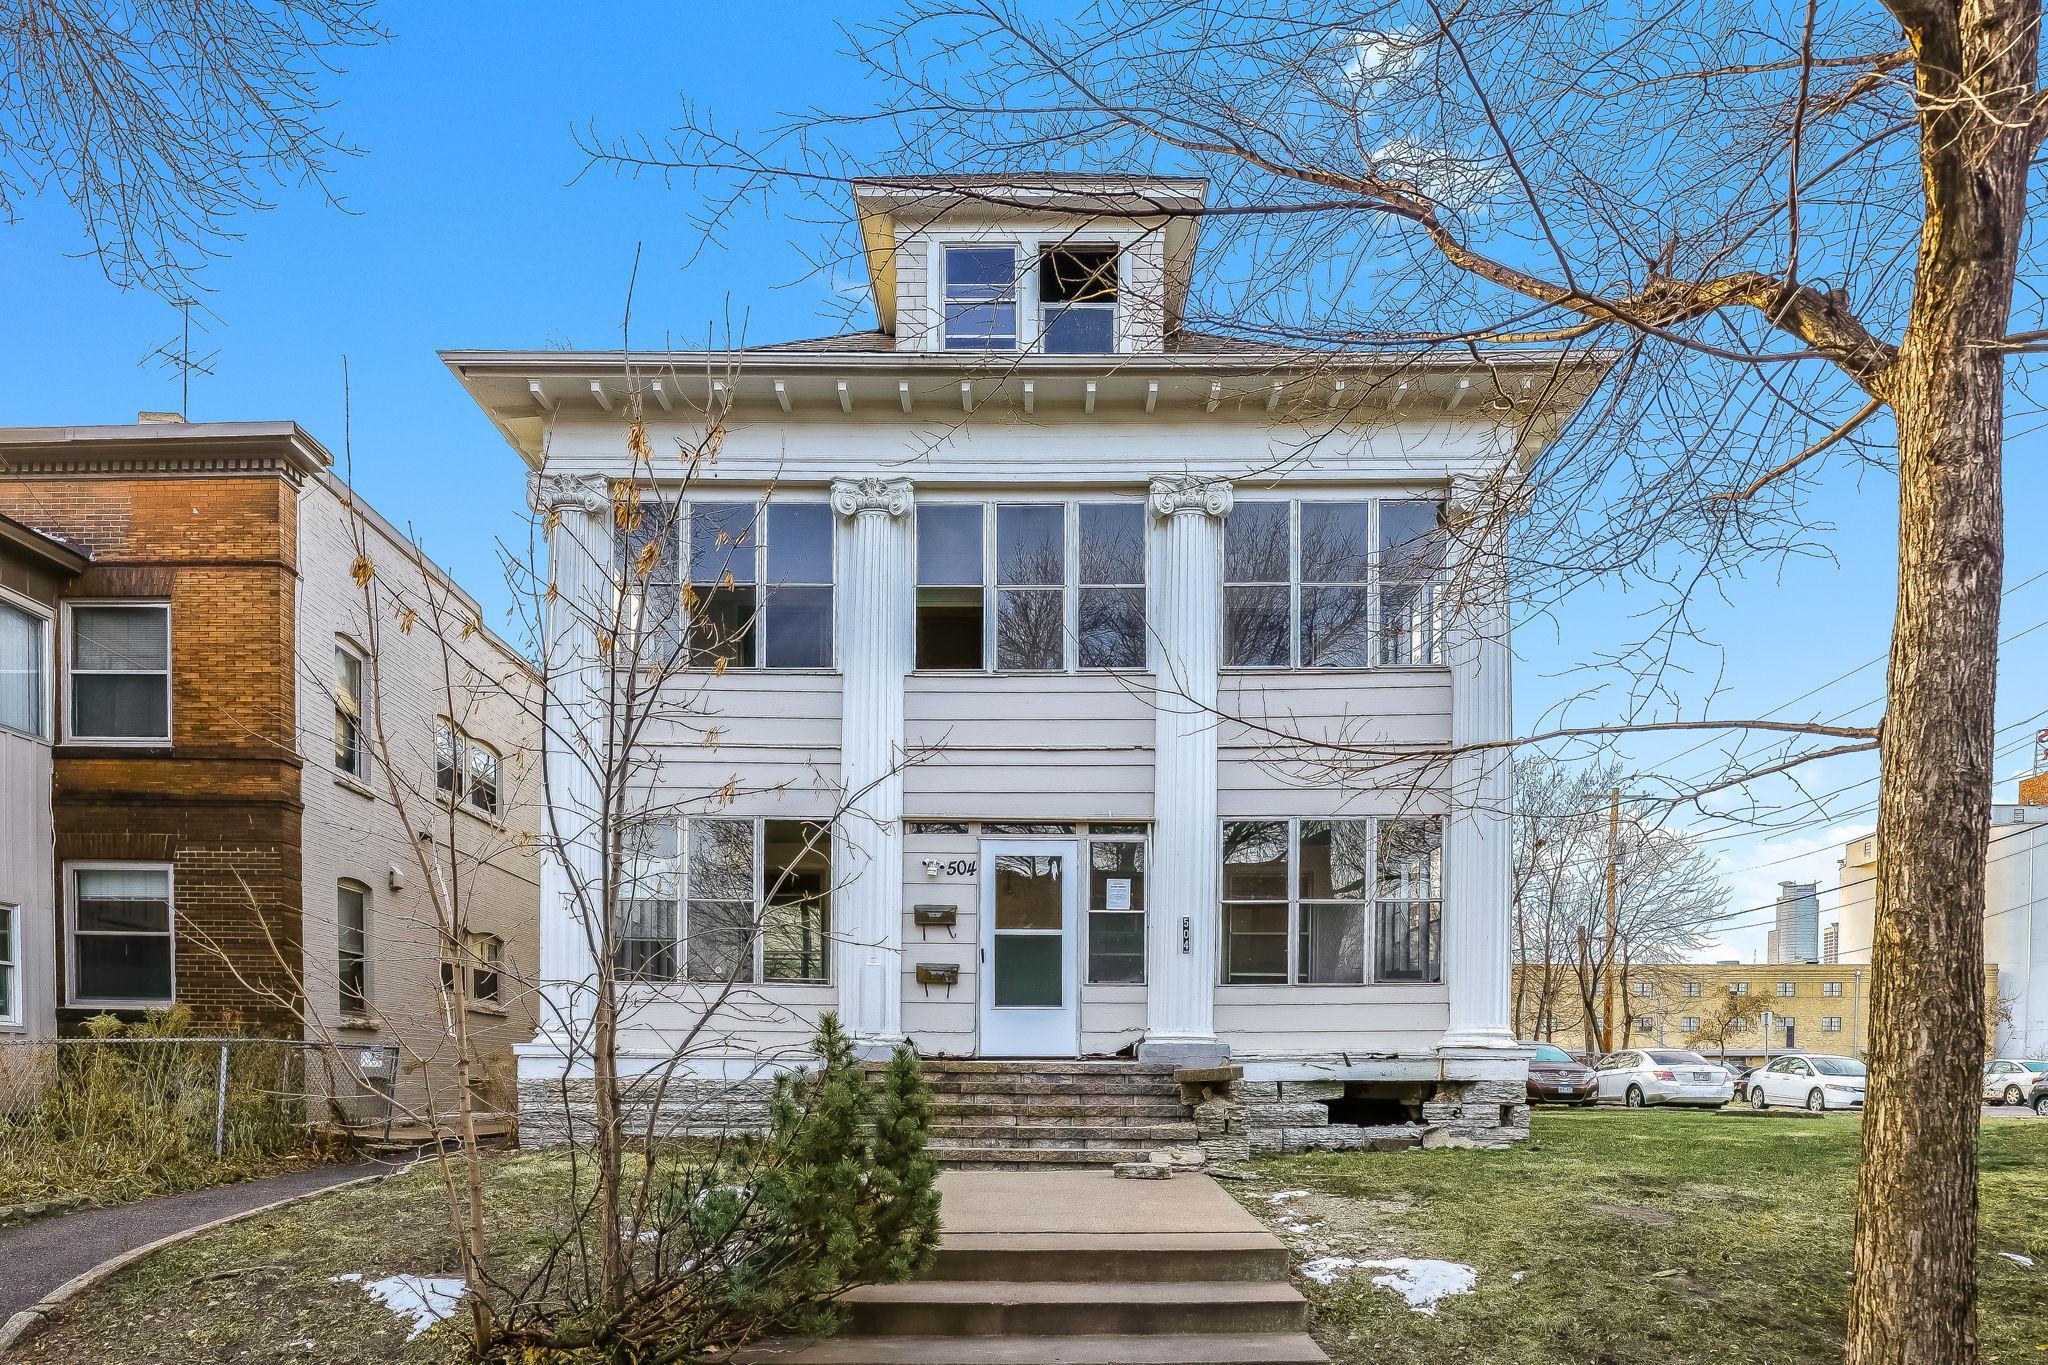
Active
$599,850
9
bds
|
3
ba
|
3,548
sqft
|
built
1903
504 University Ave SE, Minneapolis, MN 55414
$-2,281
Cash flow
-19.8%
Cash-on-Cash Return
1.1%
Cap rate
0.3%
Rent to Value Ratio
Active
$135,000
1
bds
|
1
ba
|
616
sqft
|
built
1965
3844 Nicollet Ave, Minneapolis, MN 55409
$-201
Cash flow
-7.8%
Cash-on-Cash Return
3.9%
Cap rate
1.0%
Rent to Value Ratio

Active
$125,000
1
bds
|
1
ba
|
677
sqft
|
built
1978
1225 Lasalle Ave, Minneapolis, MN 55403
$-360
Cash flow
-15.0%
Cash-on-Cash Return
2.2%
Cap rate
1.3%
Rent to Value Ratio
Active
$239,900
1
bds
|
1
ba
|
943
sqft
|
built
2004
500 E Grant St, Minneapolis, MN 55404
$-832
Cash flow
-18.1%
Cash-on-Cash Return
1.5%
Cap rate
0.8%
Rent to Value Ratio
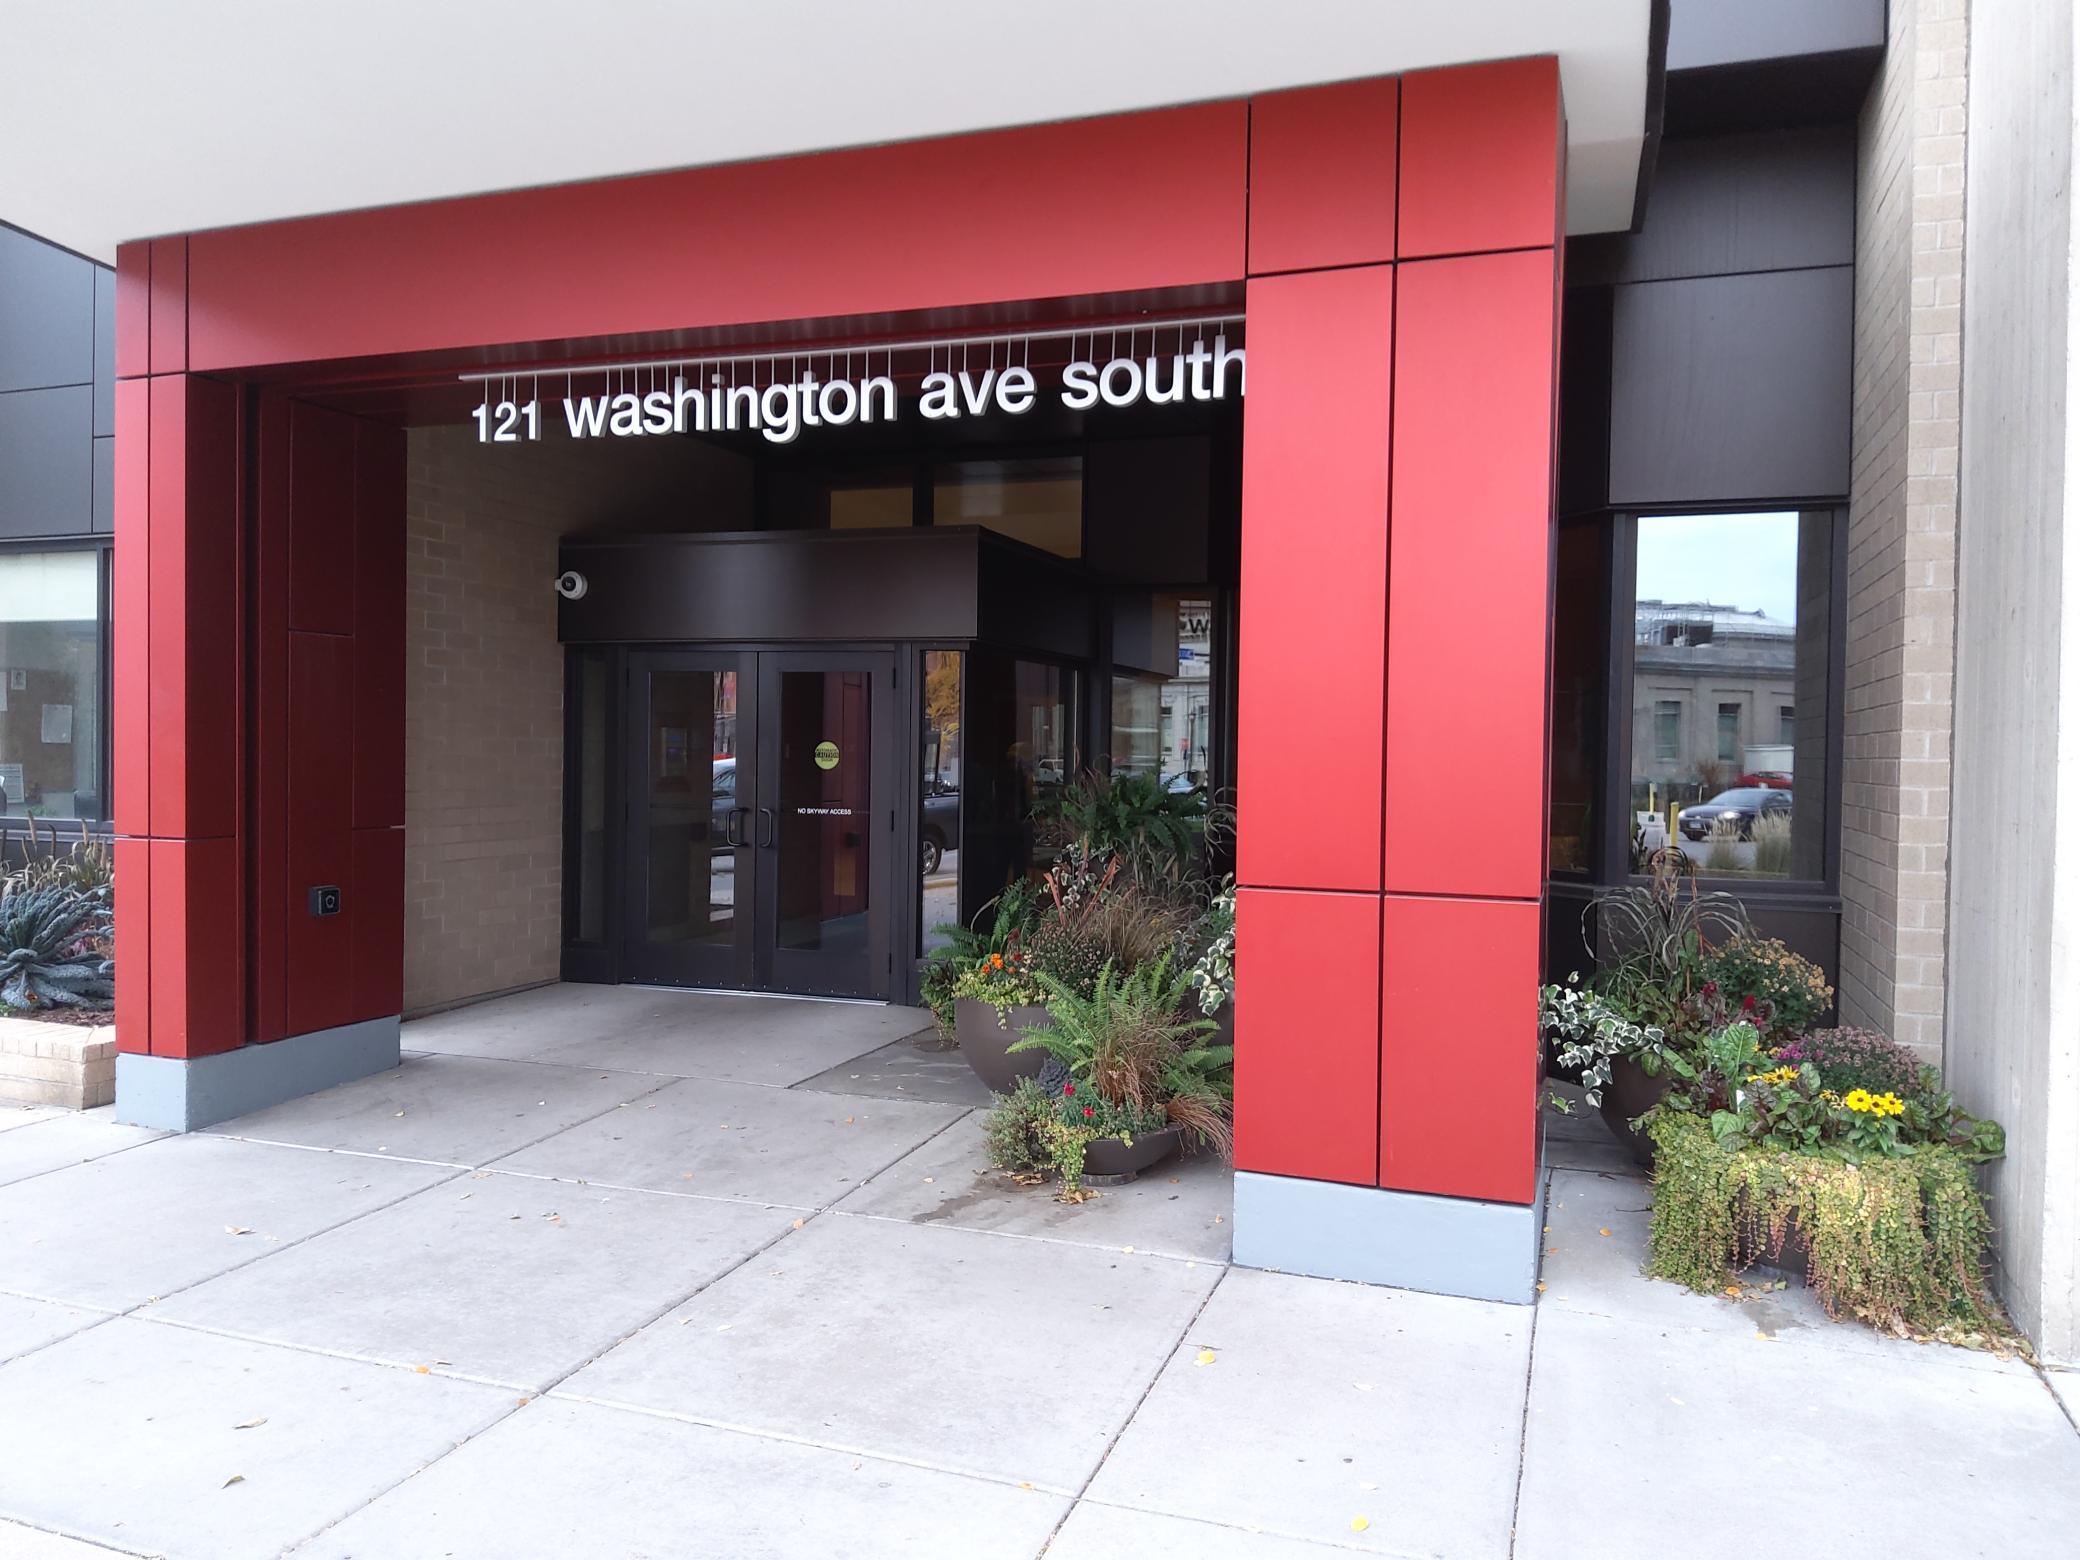
Active
$179,900
1
bds
|
1
ba
|
771
sqft
|
built
1981
121 Washington Ave S, Minneapolis, MN 55401
$-666
Cash flow
-19.3%
Cash-on-Cash Return
1.2%
Cap rate
0.9%
Rent to Value Ratio
Active
$499,900
5
bds
|
4
ba
|
2,583
sqft
|
built
1900
1096 14th Ave SE, Minneapolis, MN 55414
$-671
Cash flow
-7.0%
Cash-on-Cash Return
4.1%
Cap rate
0.6%
Rent to Value Ratio
Active
$424,900
6
bds
|
2
ba
|
2,376
sqft
|
built
1990
904 9th Ave SE, Minneapolis, MN 55414
$-831
Cash flow
-10.2%
Cash-on-Cash Return
3.3%
Cap rate
0.6%
Rent to Value Ratio
Active
$2,425,000
2
bds
|
3
ba
|
1,903
sqft
|
built
2022
255 Hennepin Ave, Minneapolis, MN 55401
$-13,432
Cash flow
-28.9%
Cash-on-Cash Return
-1.0%
Cap rate
0.3%
Rent to Value Ratio
Active
$484,900
3
bds
|
3
ba
|
1,416
sqft
|
built
1985
230 3rd Ave NE, Minneapolis, MN 55413
$-1,058
Cash flow
-11.4%
Cash-on-Cash Return
3.1%
Cap rate
0.6%
Rent to Value Ratio
Pending
$135,000
1
bds
|
1
ba
|
896
sqft
|
built
1977
1200 Nicollet Mall, Minneapolis, MN 55403
$-327
Cash flow
-12.6%
Cash-on-Cash Return
2.8%
Cap rate
1.3%
Rent to Value Ratio
Active
$595,000
2
bds
|
2
ba
|
1,490
sqft
|
built
2016
740 Portland Ave, Minneapolis, MN 55415
$-2,089
Cash flow
-18.3%
Cash-on-Cash Return
1.5%
Cap rate
0.5%
Rent to Value Ratio
Active
$144,900
1
bds
|
1
ba
|
640
sqft
|
built
1951
2201 3rd Ave S, Minneapolis, MN 55404
$-292
Cash flow
-10.5%
Cash-on-Cash Return
3.3%
Cap rate
1.0%
Rent to Value Ratio

Active
$1,595,000
2
bds
|
3
ba
|
3,253
sqft
|
built
2007
201 S 11th St, Minneapolis, MN 55403
$-6,971
Cash flow
-22.8%
Cash-on-Cash Return
0.4%
Cap rate
0.5%
Rent to Value Ratio
Active
$389,900
3
bds
|
2
ba
|
1,775
sqft
|
built
1977
1200 Nicollet Mall, Minneapolis, MN 55403
$-1,310
Cash flow
-17.5%
Cash-on-Cash Return
1.6%
Cap rate
0.8%
Rent to Value Ratio
Active
$7,500,000
5
bds
|
6
ba
|
9,139
sqft
|
built
2020
2552 W Lake Of The Isles Pkwy, Minneapolis, MN 55405
$-34,350
Cash flow
-23.9%
Cash-on-Cash Return
0.2%
Cap rate
0.1%
Rent to Value Ratio
Active
$3,750,000
2
bds
|
3
ba
|
2,866
sqft
|
built
2022
255 Hennepin Ave, Minneapolis, MN 55401
$-22,934
Cash flow
-31.9%
Cash-on-Cash Return
-1.7%
Cap rate
0.2%
Rent to Value Ratio
Active
$99,900
2
bds
|
1
ba
|
748
sqft
|
built
1922
2938 Penn Ave N, Minneapolis, MN 55411
$425
Cash flow
22.2%
Cash-on-Cash Return
10.8%
Cap rate
1.4%
Rent to Value Ratio
Active
$1,999,900
3
bds
|
6
ba
|
5,135
sqft
|
built
2001
1700 Kenwood Pkwy, Minneapolis, MN 55405
$-5,961
Cash flow
-15.6%
Cash-on-Cash Return
2.1%
Cap rate
0.4%
Rent to Value Ratio

Active
$520,000
2
bds
|
2
ba
|
1,350
sqft
|
built
2016
740 Portland Ave, Minneapolis, MN 55415
$-1,408
Cash flow
-14.1%
Cash-on-Cash Return
2.4%
Cap rate
0.7%
Rent to Value Ratio
Active
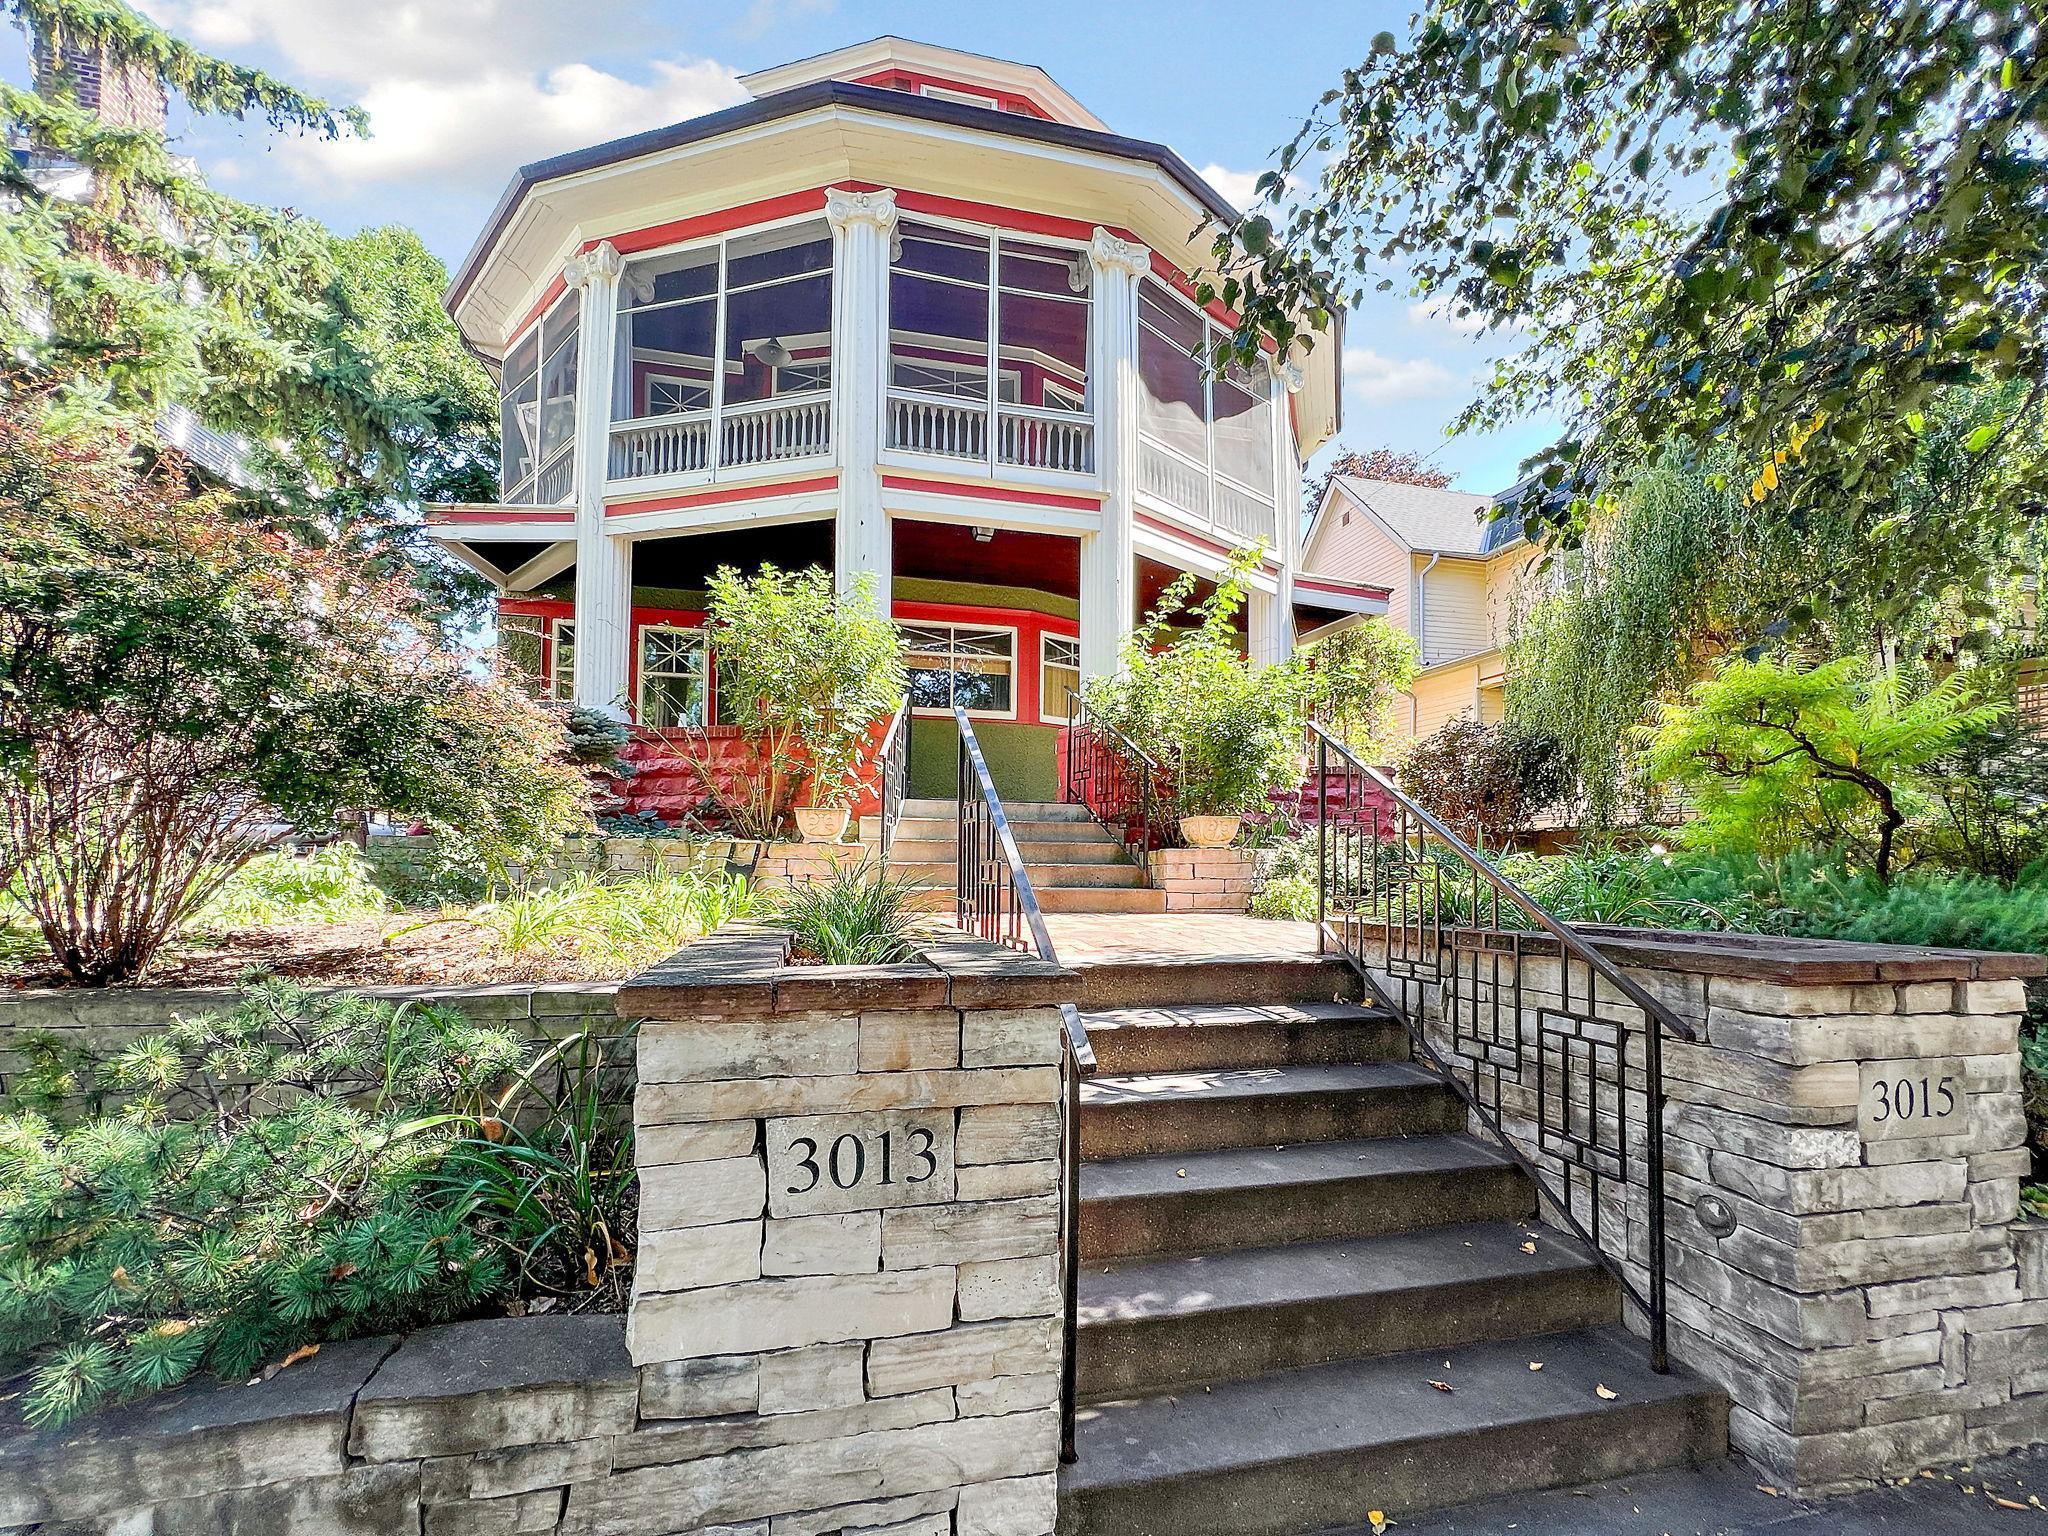
$999,900
6
bds
|
3
ba
|
4,232
sqft
|
built
1906
3013 James Ave S, Minneapolis, MN 55408
$-3,788
Cash flow
-19.8%
Cash-on-Cash Return
1.1%
Cap rate
0.3%
Rent to Value Ratio
Active
$699,900
4
bds
|
3
ba
|
1,961
sqft
|
built
1900
3017 James Ave S, Minneapolis, MN 55408
$-1,546
Cash flow
-11.5%
Cash-on-Cash Return
3.0%
Cap rate
0.5%
Rent to Value Ratio
Active
$119,000
1
bds
|
1
ba
|
665
sqft
|
built
1985
433 S 7th St, Minneapolis, MN 55415
$-316
Cash flow
-13.9%
Cash-on-Cash Return
2.5%
Cap rate
1.3%
Rent to Value Ratio
Active
$137,000
1
bds
|
1
ba
|
820
sqft
|
built
1900
2929 Chicago Ave, Minneapolis, MN 55407
$-55
Cash flow
-2.1%
Cash-on-Cash Return
5.2%
Cap rate
1.5%
Rent to Value Ratio
Active
$289,000
2
bds
|
2
ba
|
1,435
sqft
|
built
1980
5601 Dewey Hill Rd, Minneapolis, MN 55439
$-1,057
Cash flow
-19.1%
Cash-on-Cash Return
1.3%
Cap rate
0.8%
Rent to Value Ratio

Active
$79,900
bds
|
1
ba
|
441
sqft
|
built
1982
431 S 7th St, Minneapolis, MN 55415
$-266
Cash flow
-17.4%
Cash-on-Cash Return
1.7%
Cap rate
1.5%
Rent to Value Ratio
Active
$574,900
2
bds
|
2
ba
|
1,930
sqft
|
built
2008
201 S 11th St, Minneapolis, MN 55403
$-2,559
Cash flow
-23.2%
Cash-on-Cash Return
0.3%
Cap rate
0.8%
Rent to Value Ratio
Active
$599,000
2
bds
|
2
ba
|
1,524
sqft
|
built
2018
1240 S 2nd St, Minneapolis, MN 55415
$-1,625
Cash flow
-14.2%
Cash-on-Cash Return
2.4%
Cap rate
0.7%
Rent to Value Ratio