Minneapolis, MN Investment Properties for Sale
Browse homes for sale and investment properties in Minneapolis, MN. Refine your search by price, property type, or more.
Best cash flowing properties in Minneapolis, MN
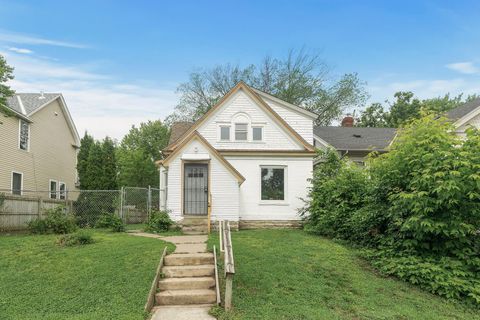
Pending
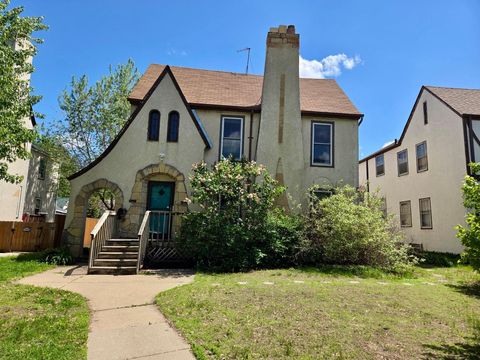
$199,900
3
bds
|
1
ba
|
1,634
sqft
|
built
1900
3227 Fremont Ave N, Minneapolis, MN 55412
$242
Cash flow
6.3%
Cash-on-Cash Return
7.1%
Cap rate
1.0%
Rent to Value Ratio
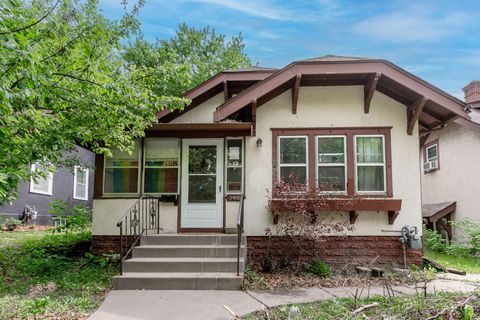
Active
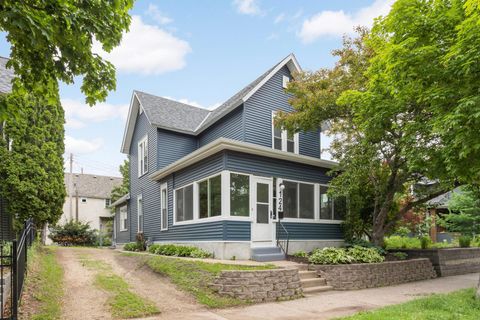
$210,000
3
bds
|
1
ba
|
1,240
sqft
|
built
1926
3418 Logan Ave N, Minneapolis, MN 55412
$208
Cash flow
5.2%
Cash-on-Cash Return
6.9%
Cap rate
1.0%
Rent to Value Ratio
990 out of 1,198 properties for sale in Minneapolis, MN
Limited Results Shown
Create a free account, or log in to reveal all property listings and enjoy the complete experience.
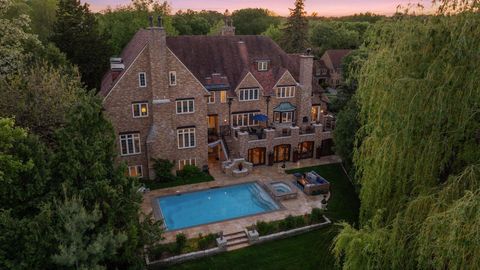
Pending
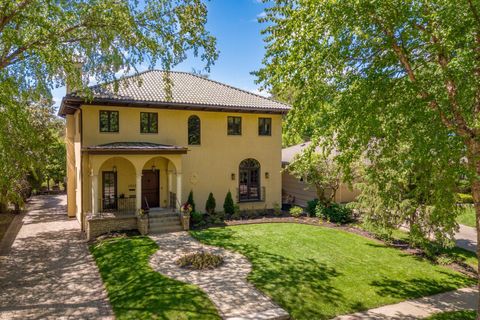
$3,350,000
6
bds
|
8
ba
|
9,177
sqft
|
built
1932
4807 Sheridan Ave S, Minneapolis, MN 55410
$-14,127
Cash flow
-22.0%
Cash-on-Cash Return
0.6%
Cap rate
0.3%
Rent to Value Ratio
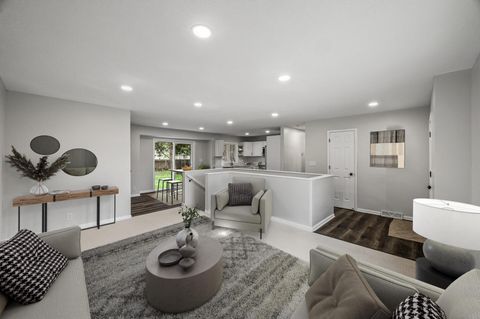
Pending
$374,900
4
bds
|
2
ba
|
1,951
sqft
|
built
1957
3213 63rd Ave N, Minneapolis, MN 55429
$-693
Cash flow
-9.6%
Cash-on-Cash Return
3.5%
Cap rate
0.5%
Rent to Value Ratio
Active
$249,900
2
bds
|
1
ba
|
1,294
sqft
|
built
1990
5995 Wedgewood Ln N, Minneapolis, MN 55446
$-345
Cash flow
-7.2%
Cash-on-Cash Return
4.0%
Cap rate
0.8%
Rent to Value Ratio
Active
$249,990
3
bds
|
2
ba
|
1,221
sqft
|
built
1923
1067 27th Ave SE, Minneapolis, MN 55414
$139
Cash flow
2.9%
Cash-on-Cash Return
6.3%
Cap rate
0.9%
Rent to Value Ratio

Pending
$624,900
4
bds
|
2
ba
|
2,213
sqft
|
built
1924
5349 Oliver Ave S, Minneapolis, MN 55419
$-1,110
Cash flow
-9.3%
Cash-on-Cash Return
3.5%
Cap rate
0.6%
Rent to Value Ratio
Active
$415,000
2
bds
|
2
ba
|
1,358
sqft
|
built
1989
401 S 1st St, Minneapolis, MN 55401
$-742
Cash flow
-9.3%
Cash-on-Cash Return
3.5%
Cap rate
0.7%
Rent to Value Ratio

Active
$265,000
4
bds
|
2
ba
|
2,084
sqft
|
built
1920
3725 Fremont Ave N, Minneapolis, MN 55412
$-286
Cash flow
-5.6%
Cash-on-Cash Return
4.4%
Cap rate
0.8%
Rent to Value Ratio

Active
$389,900
5
bds
|
2
ba
|
2,480
sqft
|
built
1913
1722 James Ave N, Minneapolis, MN 55411
$-803
Cash flow
-10.7%
Cash-on-Cash Return
3.2%
Cap rate
0.5%
Rent to Value Ratio

Active
$1,495,000
8
bds
|
5
ba
|
6,599
sqft
|
built
1922
1625 W 25th St, Minneapolis, MN 55405
$-5,955
Cash flow
-20.8%
Cash-on-Cash Return
0.9%
Cap rate
0.3%
Rent to Value Ratio
Active
$488,824
4
bds
|
2
ba
|
2,301
sqft
|
built
1950
5820 44th Ave S, Minneapolis, MN 55417
$-860
Cash flow
-9.2%
Cash-on-Cash Return
3.6%
Cap rate
0.6%
Rent to Value Ratio
Active
$275,000
2
bds
|
2
ba
|
1,162
sqft
|
built
2006
4500 Chicago Ave, Minneapolis, MN 55407
$-600
Cash flow
-11.4%
Cash-on-Cash Return
3.1%
Cap rate
0.8%
Rent to Value Ratio
Pending
$425,000
2
bds
|
1
ba
|
1,008
sqft
|
built
1916
5236 Vincent Ave S, Minneapolis, MN 55410
$-829
Cash flow
-10.2%
Cash-on-Cash Return
3.3%
Cap rate
0.5%
Rent to Value Ratio
Active
$799,000
3
bds
|
3
ba
|
2,661
sqft
|
built
1946
1112 Vincent Ave S, Minneapolis, MN 55405
$-1,186
Cash flow
-7.7%
Cash-on-Cash Return
3.9%
Cap rate
0.6%
Rent to Value Ratio
Pending
$199,900
3
bds
|
1
ba
|
1,634
sqft
|
built
1900
3227 Fremont Ave N, Minneapolis, MN 55412
$242
Cash flow
6.3%
Cash-on-Cash Return
7.1%
Cap rate
1.0%
Rent to Value Ratio

Active
$514,900
6
bds
|
4
ba
|
3,100
sqft
|
built
1900
2744 Stevens Ave, Minneapolis, MN 55408
$-1,367
Cash flow
-13.9%
Cash-on-Cash Return
2.5%
Cap rate
0.5%
Rent to Value Ratio
Active
$639,900
2
bds
|
2
ba
|
1,793
sqft
|
built
2006
215 10th Ave S, Minneapolis, MN 55415
$-2,275
Cash flow
-18.5%
Cash-on-Cash Return
1.4%
Cap rate
0.6%
Rent to Value Ratio
Active
$412,500
2
bds
|
2
ba
|
1,156
sqft
|
built
2016
740 Portland Ave, Minneapolis, MN 55415
$-1,162
Cash flow
-14.7%
Cash-on-Cash Return
2.3%
Cap rate
0.7%
Rent to Value Ratio
Active
$210,000
3
bds
|
1
ba
|
1,240
sqft
|
built
1926
3418 Logan Ave N, Minneapolis, MN 55412
$208
Cash flow
5.2%
Cash-on-Cash Return
6.9%
Cap rate
1.0%
Rent to Value Ratio
Active
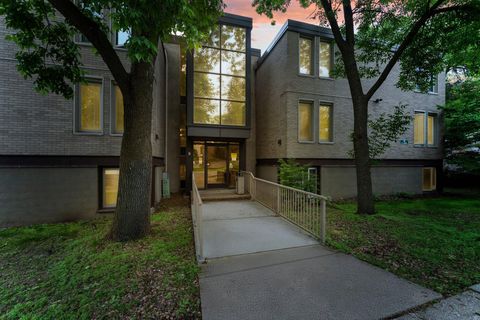
$4,250,000
2
bds
|
3
ba
|
3,031
sqft
|
built
2022
1111 W River Pkwy, Minneapolis, MN 55415
$-22,340
Cash flow
-27.4%
Cash-on-Cash Return
-0.6%
Cap rate
0.1%
Rent to Value Ratio
Pending
$250,000
3
bds
|
2
ba
|
2,422
sqft
|
built
1956
5107 James Ave N, Minneapolis, MN 55430
$-64
Cash flow
-1.3%
Cash-on-Cash Return
5.4%
Cap rate
0.8%
Rent to Value Ratio
Active
$275,000
2
bds
|
1
ba
|
937
sqft
|
built
2001
560 N 2nd St, Minneapolis, MN 55401
$-766
Cash flow
-14.5%
Cash-on-Cash Return
2.3%
Cap rate
0.8%
Rent to Value Ratio
Active
$1,795,000
5
bds
|
4
ba
|
4,727
sqft
|
built
2004
3742 Abbott Ave S, Minneapolis, MN 55410
$-6,023
Cash flow
-17.5%
Cash-on-Cash Return
1.7%
Cap rate
0.4%
Rent to Value Ratio
Active
$699,500
8
bds
|
5
ba
|
4,360
sqft
|
built
1931
4429 Portland Ave, Minneapolis, MN 55407
$-2,454
Cash flow
-18.3%
Cash-on-Cash Return
1.5%
Cap rate
0.3%
Rent to Value Ratio

Active
$645,000
3
bds
|
3
ba
|
2,058
sqft
|
built
1917
4705 Lyndale Ave S, Minneapolis, MN 55419
$-1,120
Cash flow
-9.1%
Cash-on-Cash Return
3.6%
Cap rate
0.6%
Rent to Value Ratio
Active
$99,900
1
bds
|
1
ba
|
706
sqft
|
built
1965
1405 E 40th St, Minneapolis, MN 55407
$-148
Cash flow
-7.7%
Cash-on-Cash Return
3.9%
Cap rate
1.2%
Rent to Value Ratio
Active
$315,000
3
bds
|
2
ba
|
1,591
sqft
|
built
1900
124 W 27th St, Minneapolis, MN 55408
$142
Cash flow
2.4%
Cash-on-Cash Return
6.2%
Cap rate
0.9%
Rent to Value Ratio
Active
$393,000
2
bds
|
2
ba
|
90
sqft
|
built
1977
5619 Woodlawn Blvd, Minneapolis, MN 55417
$-500
Cash flow
-6.6%
Cash-on-Cash Return
4.2%
Cap rate
0.6%
Rent to Value Ratio
Pending
$585,000
4
bds
|
2
ba
|
2,154
sqft
|
built
1911
3252 Aldrich Ave S, Minneapolis, MN 55408
$-1,252
Cash flow
-11.2%
Cash-on-Cash Return
3.1%
Cap rate
0.5%
Rent to Value Ratio

Active
$599,999
5
bds
|
4
ba
|
2,088
sqft
|
built
1950
4707 France Ave S, Minneapolis, MN 55410
$-1,711
Cash flow
-14.9%
Cash-on-Cash Return
2.3%
Cap rate
0.4%
Rent to Value Ratio
Active
$370,000
3
bds
|
2
ba
|
1,272
sqft
|
built
1937
4207 Vincent Ave N, Minneapolis, MN 55412
$-621
Cash flow
-8.8%
Cash-on-Cash Return
3.7%
Cap rate
0.6%
Rent to Value Ratio
Active
$249,000
2
bds
|
1
ba
|
994
sqft
|
built
2006
4525 Park Commons Dr, Minneapolis, MN 55416
$-669
Cash flow
-14.0%
Cash-on-Cash Return
2.5%
Cap rate
0.8%
Rent to Value Ratio
Active
$164,900
1
bds
|
1
ba
|
664
sqft
|
built
1966
48 Groveland Ter, Minneapolis, MN 55403
$-593
Cash flow
-18.8%
Cash-on-Cash Return
1.4%
Cap rate
1.0%
Rent to Value Ratio
Active
$1,695,000
2
bds
|
3
ba
|
1,905
sqft
|
built
2022
1111 W River Pkwy, Minneapolis, MN 55415
$-8,759
Cash flow
-27.0%
Cash-on-Cash Return
-0.5%
Cap rate
0.3%
Rent to Value Ratio

Active
$997,850
4
bds
|
4
ba
|
3,295
sqft
|
built
2025
4804 12th Ave S, Minneapolis, MN 55417
$-1,202
Cash flow
-6.3%
Cash-on-Cash Return
4.2%
Cap rate
0.6%
Rent to Value Ratio
Active
$364,900
4
bds
|
2
ba
|
1,750
sqft
|
built
1900
2616 30th Ave S, Minneapolis, MN 55406
$67
Cash flow
1.0%
Cash-on-Cash Return
5.9%
Cap rate
0.7%
Rent to Value Ratio

Active
$1,495,000
2
bds
|
3
ba
|
2,533
sqft
|
built
1927
510 Groveland Ave, Minneapolis, MN 55403
$-9,853
Cash flow
-34.4%
Cash-on-Cash Return
-2.2%
Cap rate
0.3%
Rent to Value Ratio

Active
$315,000
2
bds
|
1
ba
|
1,060
sqft
|
built
1941
3243 Cleveland St NE, Minneapolis, MN 55418
$-577
Cash flow
-9.6%
Cash-on-Cash Return
3.5%
Cap rate
0.6%
Rent to Value Ratio

Active
$275,000
5
bds
|
3
ba
|
1,988
sqft
|
built
1906
3328 5th Ave S, Minneapolis, MN 55408
$-279
Cash flow
-5.3%
Cash-on-Cash Return
4.5%
Cap rate
0.7%
Rent to Value Ratio

Pending
$545,000
4
bds
|
3
ba
|
3,328
sqft
|
built
1929
4022 Xerxes Ave N, Minneapolis, MN 55412
$-955
Cash flow
-9.1%
Cash-on-Cash Return
3.6%
Cap rate
0.6%
Rent to Value Ratio

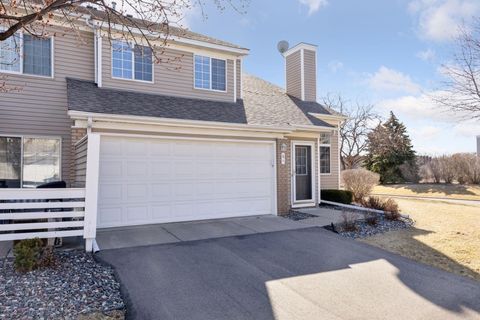
Pending
$485,000
4
bds
|
3
ba
|
2,908
sqft
|
built
1984
12085 Evergreen St NW, Minneapolis, MN 55448
$-724
Cash flow
-7.8%
Cash-on-Cash Return
3.9%
Cap rate
0.6%
Rent to Value Ratio