Hennepin County Investment Properties for Sale
Browse homes for sale and investment properties in Hennepin County. Refine your search by price, property type, or more.
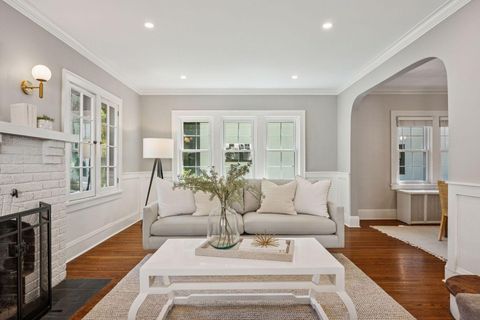
Best cash flowing properties in Hennepin County
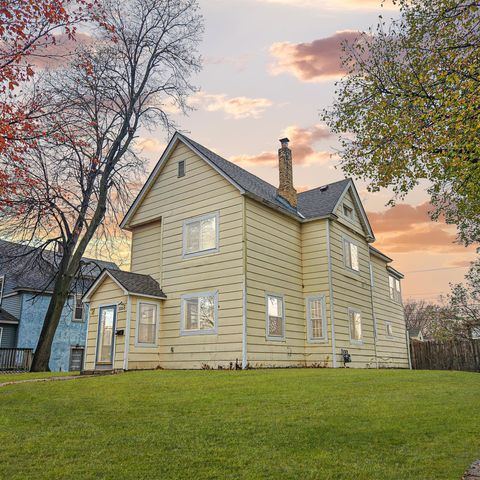
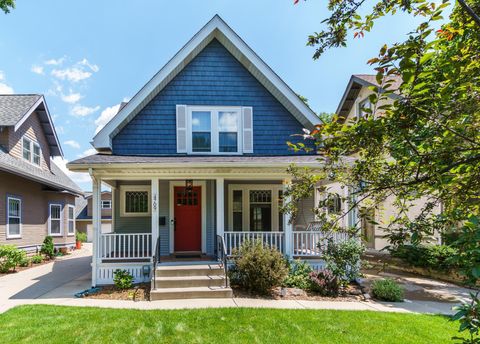
Active
$255,000
5
bds
|
2
ba
|
1,808
sqft
|
built
1903
3253 Humboldt Ave N, Minneapolis, MN 55412
$99
Cash flow
2.0%
Cash-on-Cash Return
6.1%
Cap rate
0.9%
Rent to Value Ratio
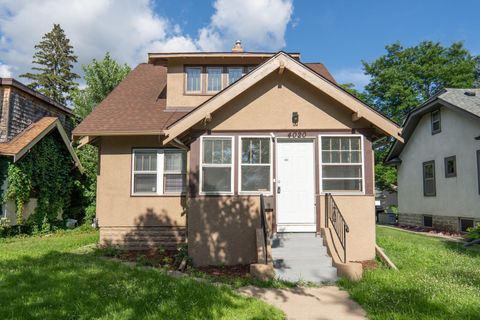
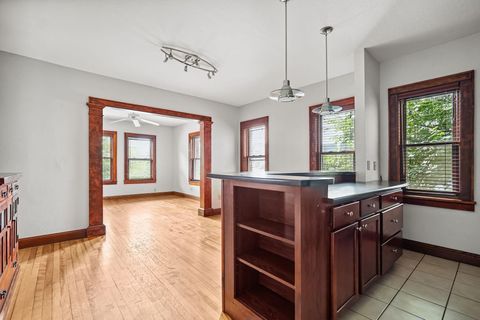
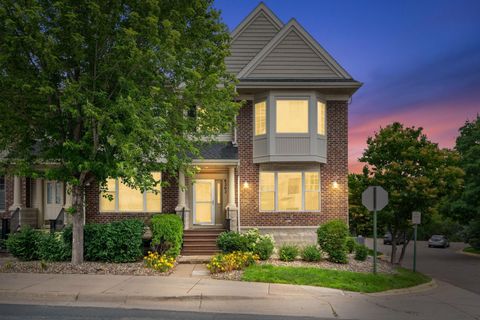
Active
$259,900
5
bds
|
1
ba
|
1,322
sqft
|
built
1919
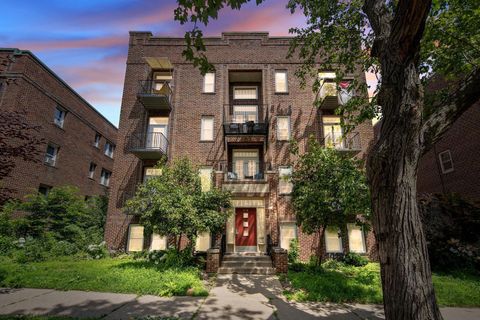
4020 Emerson Ave N, Minneapolis, MN 55412
$37
Cash flow
0.7%
Cash-on-Cash Return
5.8%
Cap rate
0.8%
Rent to Value Ratio
801 out of 1,188 properties for sale in Hennepin County
Limited Results Shown
Create a free account, or log in to reveal all property listings and enjoy the complete experience.
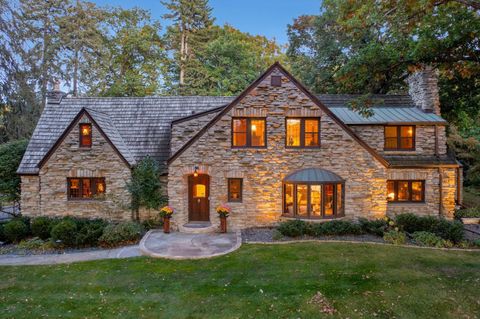
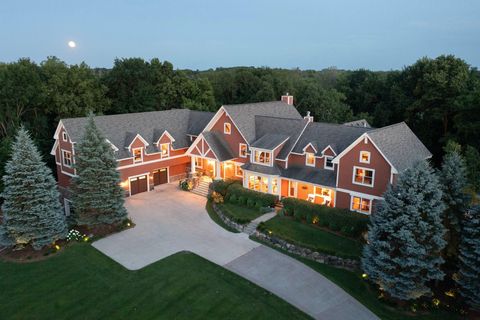
Active
$5,250,000
6
bds
|
8
ba
|
8,085
sqft
|
built
1936
5117 Schaefer Rd, Edina, MN 55436
$-23,835
Cash flow
-23.7%
Cash-on-Cash Return
0.2%
Cap rate
0.1%
Rent to Value Ratio
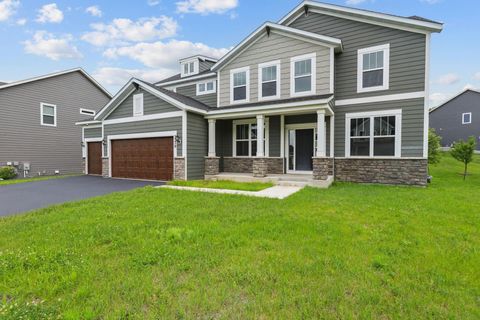
Active
$861,000
5
bds
|
3
ba
|
3,126
sqft
|
built
2020
5370 Fountain Ln N, Plymouth, MN 55446
$-2,108
Cash flow
-12.8%
Cash-on-Cash Return
2.7%
Cap rate
0.5%
Rent to Value Ratio
Active
$470,000
4
bds
|
3
ba
|
2,040
sqft
|
built
1981
3013 Bluffs Dr, Mound, MN 55364
$-582
Cash flow
-6.5%
Cash-on-Cash Return
4.2%
Cap rate
0.6%
Rent to Value Ratio
Active
$309,000
2
bds
|
3
ba
|
1,724
sqft
|
built
1978
4757 Spring Cir, Minnetonka, MN 55345
$-459
Cash flow
-7.8%
Cash-on-Cash Return
3.9%
Cap rate
0.8%
Rent to Value Ratio
Active
$650,000
3
bds
|
3
ba
|
2,252
sqft
|
built
1990
16101 Boulder Creek Dr, Minnetonka, MN 55345
$-1,294
Cash flow
-10.4%
Cash-on-Cash Return
3.3%
Cap rate
0.5%
Rent to Value Ratio
Active
$450,000
13
bds
|
6
ba
|
3,920
sqft
|
built
2003
1030 Knox Ave N, Minneapolis, MN 55411
$-1,026
Cash flow
-11.9%
Cash-on-Cash Return
2.9%
Cap rate
0.4%
Rent to Value Ratio
Active
$450,000
13
bds
|
4
ba
|
3,920
sqft
|
built
2003
1028 Knox Ave N, Minneapolis, MN 55411
$-1,382
Cash flow
-16.0%
Cash-on-Cash Return
2.0%
Cap rate
0.4%
Rent to Value Ratio
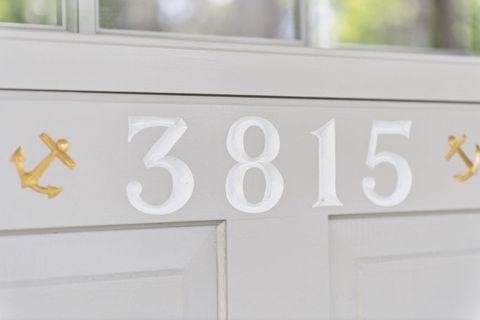
Active
$839,500
3
bds
|
2
ba
|
1,614
sqft
|
built
1920
3815 Deephaven Ave, Wayzata, MN 55391
$-2,751
Cash flow
-17.1%
Cash-on-Cash Return
1.7%
Cap rate
0.3%
Rent to Value Ratio
Active
$300,000
3
bds
|
2
ba
|
1,824
sqft
|
built
1962
1332 Logan Ave N, Minneapolis, MN 55411
$-405
Cash flow
-7.0%
Cash-on-Cash Return
4.1%
Cap rate
0.6%
Rent to Value Ratio

Active
$2,185,000
6
bds
|
7
ba
|
5,376
sqft
|
built
2006
20895 Spencer Ln, Excelsior, MN 55331
$-8,418
Cash flow
-20.1%
Cash-on-Cash Return
1.1%
Cap rate
0.3%
Rent to Value Ratio
Active
$595,000
3
bds
|
3
ba
|
2,564
sqft
|
built
2003
5108 Drummond Rd, Mound, MN 55364
$-881
Cash flow
-7.7%
Cash-on-Cash Return
3.9%
Cap rate
0.6%
Rent to Value Ratio
Active
$290,000
2
bds
|
2
ba
|
1,521
sqft
|
built
1999
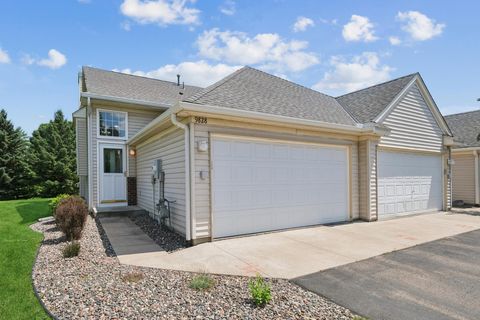
9828 Zinnia Ln N, Maple Grove, MN 55369
$-618
Cash flow
-11.1%
Cash-on-Cash Return
3.1%
Cap rate
0.7%
Rent to Value Ratio
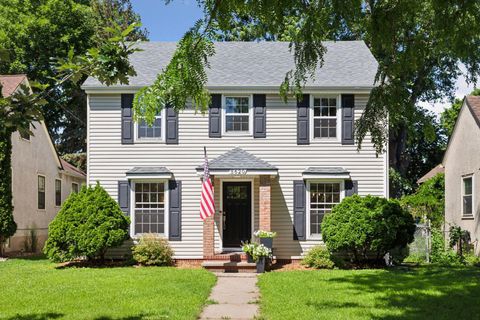
Active
$459,900
4
bds
|
2
ba
|
2,033
sqft
|
built
1937
5620 Stevens Ave, Minneapolis, MN 55419
$-409
Cash flow
-4.6%
Cash-on-Cash Return
4.6%
Cap rate
0.7%
Rent to Value Ratio
Active
$739,000
4
bds
|
2
ba
|
2,652
sqft
|
built
1900
2852 County Road 92 N, Maple Plain, MN 55359
$-1,825
Cash flow
-12.9%
Cash-on-Cash Return
2.7%
Cap rate
0.4%
Rent to Value Ratio
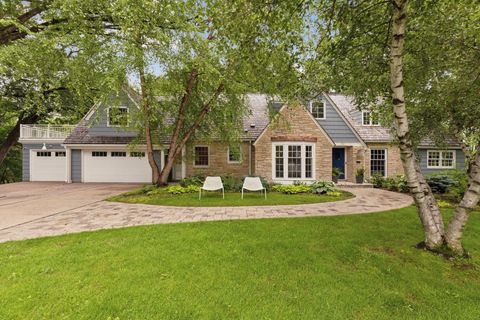
Active
$1,695,000
4
bds
|
4
ba
|
5,086
sqft
|
built
1940
512 Janalyn Cir, Golden Valley, MN 55416
$-5,519
Cash flow
-17.0%
Cash-on-Cash Return
1.8%
Cap rate
0.4%
Rent to Value Ratio
Active
$899,000
3
bds
|
2
ba
|
2,175
sqft
|
built
1925
4510 Arden Ave, Edina, MN 55424
$-1,858
Cash flow
-10.8%
Cash-on-Cash Return
3.2%
Cap rate
0.5%
Rent to Value Ratio
Active
$99,000
1
bds
|
1
ba
|
695
sqft
|
built
1917
1812 Clinton Ave, Minneapolis, MN 55404
$-148
Cash flow
-7.8%
Cash-on-Cash Return
3.9%
Cap rate
1.4%
Rent to Value Ratio
Active
$229,900
1
bds
|
1
ba
|
778
sqft
|
built
1972
2800 W 44th St, Minneapolis, MN 55410
$-617
Cash flow
-14.0%
Cash-on-Cash Return
2.5%
Cap rate
0.8%
Rent to Value Ratio
Active
$445,000
2
bds
|
2
ba
|
1,805
sqft
|
built
2006
2670 Kelley Pkwy, Long Lake, MN 55356
$-1,112
Cash flow
-13.0%
Cash-on-Cash Return
2.7%
Cap rate
0.7%
Rent to Value Ratio
Active
$259,900
4
bds
|
2
ba
|
1,584
sqft
|
built
1907
4007 Girard Ave N, Minneapolis, MN 55412
$-51
Cash flow
-1.0%
Cash-on-Cash Return
5.4%
Cap rate
0.8%
Rent to Value Ratio
Active
$2,100,000
5
bds
|
5
ba
|
4,959
sqft
|
built
2005
6617 Iroquois Trl, Edina, MN 55439
$-7,470
Cash flow
-18.6%
Cash-on-Cash Return
1.4%
Cap rate
0.3%
Rent to Value Ratio

Active
$144,000
2
bds
|
2
ba
|
1,094
sqft
|
built
1972
8935 Old Cedar Ave S, Bloomington, MN 55425
$-466
Cash flow
-16.9%
Cash-on-Cash Return
1.8%
Cap rate
1.0%
Rent to Value Ratio
Active
$3,450,000
5
bds
|
5
ba
|
6,885
sqft
|
built
2016
3776 Woodland Cove Pkwy, Excelsior, MN 55331
$-13,142
Cash flow
-19.9%
Cash-on-Cash Return
1.1%
Cap rate
0.3%
Rent to Value Ratio
Active
$4,800,000
3
bds
|
2
ba
|
1,323
sqft
|
built
1972
2182 Homestead Trl, Long Lake, MN 55356
$-20,611
Cash flow
-22.4%
Cash-on-Cash Return
0.5%
Cap rate
0.1%
Rent to Value Ratio
Active
$107,000
1
bds
|
1
ba
|
445
sqft
|
built
1917
1216 Powderhorn Ter, Minneapolis, MN 55407
$-146
Cash flow
-7.1%
Cash-on-Cash Return
4.0%
Cap rate
1.0%
Rent to Value Ratio
Active
$505,000
4
bds
|
3
ba
|
2,550
sqft
|
built
1986
8508 Park Knoll Cir, Bloomington, MN 55438
$-729
Cash flow
-7.5%
Cash-on-Cash Return
3.9%
Cap rate
0.6%
Rent to Value Ratio
Active
$670,000
5
bds
|
3
ba
|
3,050
sqft
|
built
2022
15613 116th Ave N, Osseo, MN 55369
$-826
Cash flow
-6.4%
Cash-on-Cash Return
4.2%
Cap rate
0.6%
Rent to Value Ratio
Active
$439,000
3
bds
|
2
ba
|
1,074
sqft
|
built
1952
7907 W 25th St, Saint Louis Park, MN 55426
$-922
Cash flow
-11.0%
Cash-on-Cash Return
3.2%
Cap rate
0.5%
Rent to Value Ratio
Active
$559,520
4
bds
|
2
ba
|
2,460
sqft
|
built
1986
2520 Florida Ave N, Golden Valley, MN 55427
$-1,445
Cash flow
-13.5%
Cash-on-Cash Return
2.6%
Cap rate
0.4%
Rent to Value Ratio
Active
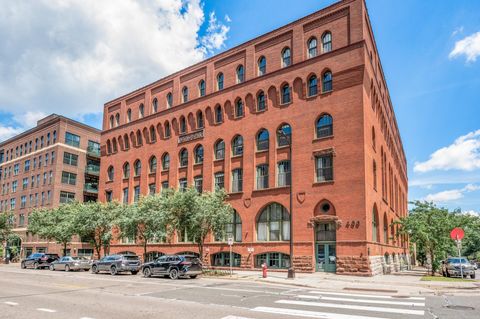
$343,500
2
bds
|
1
ba
|
976
sqft
|
built
1900
400 N 1st St, Minneapolis, MN 55401
$-1,230
Cash flow
-18.7%
Cash-on-Cash Return
1.4%
Cap rate
0.6%
Rent to Value Ratio
Active
$299,999
3
bds
|
2
ba
|
1,340
sqft
|
built
1981
9205 29th Ave N, New Hope, MN 55427
$-211
Cash flow
-3.7%
Cash-on-Cash Return
4.8%
Cap rate
0.7%
Rent to Value Ratio

Active
$279,900
2
bds
|
2
ba
|
1,411
sqft
|
built
1996
9136 Windsor Ter, Brooklyn Park, MN 55443
$-531
Cash flow
-9.9%
Cash-on-Cash Return
3.4%
Cap rate
0.7%
Rent to Value Ratio
Active
$459,900
3
bds
|
2
ba
|
1,683
sqft
|
built
1942
40 Penn Ave S, Minneapolis, MN 55405
$-468
Cash flow
-5.3%
Cash-on-Cash Return
4.5%
Cap rate
0.7%
Rent to Value Ratio
Active
$299,500
2
bds
|
2
ba
|
1,274
sqft
|
built
2007
1155 Ford Rd, Saint Louis Park, MN 55426
$-445
Cash flow
-7.8%
Cash-on-Cash Return
3.9%
Cap rate
0.8%
Rent to Value Ratio
Active
$3,495,000
5
bds
|
9
ba
|
11,708
sqft
|
built
2010
6445 County Road 26, Mound, MN 55364
$-15,454
Cash flow
-23.1%
Cash-on-Cash Return
0.4%
Cap rate
0.2%
Rent to Value Ratio
Active
$650,000
3
bds
|
2
ba
|
1,775
sqft
|
built
1909
4709 Colfax Ave S, Minneapolis, MN 55419
$-1,533
Cash flow
-12.3%
Cash-on-Cash Return
2.8%
Cap rate
0.5%
Rent to Value Ratio

Active
$369,900
3
bds
|
2
ba
|
1,775
sqft
|
built
1977
1200 Nicollet Mall, Minneapolis, MN 55403
$-2,429
Cash flow
-34.3%
Cash-on-Cash Return
-2.2%
Cap rate
0.5%
Rent to Value Ratio
Active
$390,000
3
bds
|
3
ba
|
1,900
sqft
|
built
2002
8202 Golden Valley Rd, Golden Valley, MN 55427
$-946
Cash flow
-12.7%
Cash-on-Cash Return
2.8%
Cap rate
0.6%
Rent to Value Ratio