Nephi, UT Investment Properties for Sale
Browse homes for sale and investment properties in Nephi, UT. Refine your search by price, property type, or more.
Best cash flowing properties in Nephi, UT
Active
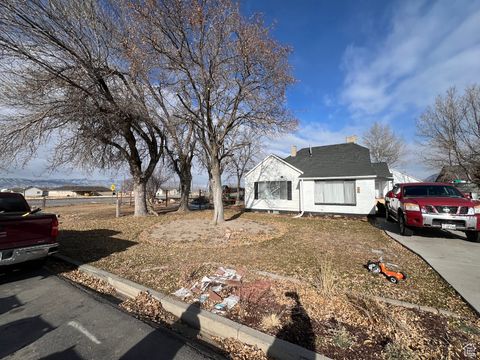
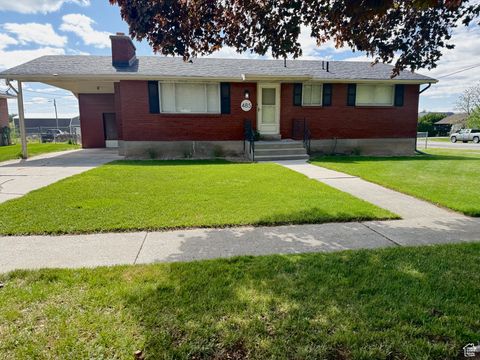
$324,900
4
bds
|
1
ba
|
2,086
sqft
|
built
1922
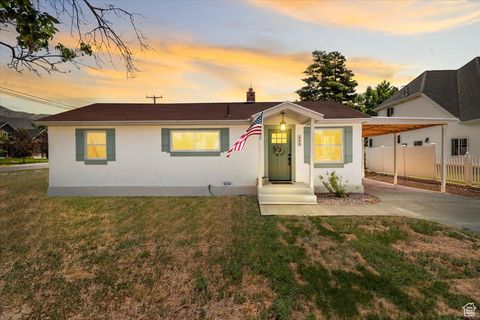
296 W 700 N, Nephi, UT 84648
$-338
Cash flow
-5.4%
Cash-on-Cash Return
4.4%
Cap rate
0.6%
Rent to Value Ratio
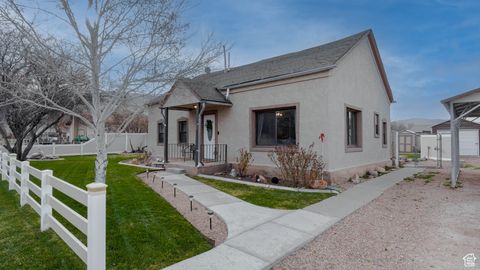
Active
$325,000
2
bds
|
1
ba
|
962
sqft
|
built
1878
480 E 200 N, Nephi, UT 84648
$-709
Cash flow
-11.4%
Cash-on-Cash Return
3.1%
Cap rate
0.4%
Rent to Value Ratio
17 out of 29 properties for sale in Nephi, UT
Limited Results Shown
Create a free account, or log in to reveal all property listings and enjoy the complete experience.
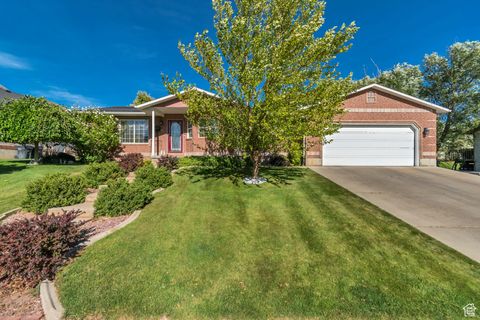
Active
$565,000
4
bds
|
3
ba
|
2,758
sqft
|
built
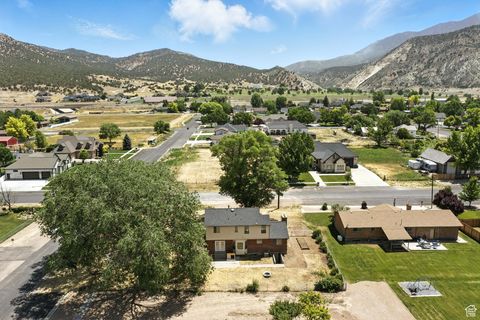
1997
1318 N 550 E, Nephi, UT 84648
$-1,291
Cash flow
-11.9%
Cash-on-Cash Return
2.9%
Cap rate
0.4%
Rent to Value Ratio
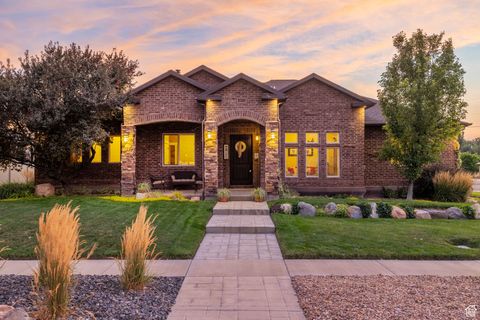
Active
$849,000
7
bds
|
5
ba
|
5,700
sqft
|
built
2008
116 S 600 E, Nephi, UT 84648
$-2,638
Cash flow
-16.2%
Cash-on-Cash Return
2.0%
Cap rate
0.3%
Rent to Value Ratio
Active
$549,000
4
bds
|
4
ba
|
3,954
sqft
|
built
2005
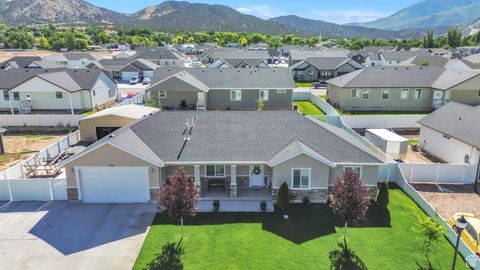
615 S 100 W, Nephi, UT 84648
$-909
Cash flow
-8.6%
Cash-on-Cash Return
3.7%
Cap rate
0.5%
Rent to Value Ratio
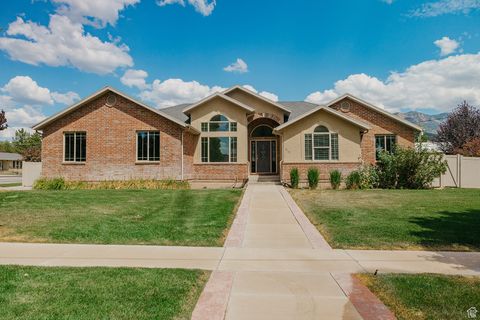
Active
$645,000
6
bds
|
3
ba
|
4,072
sqft
|
built
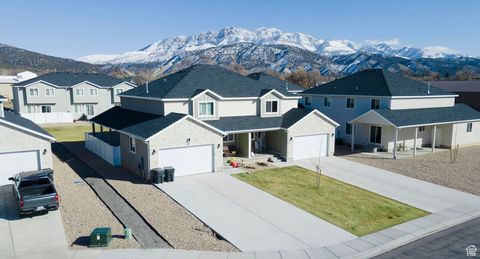
2006
148 E 1430 S, Nephi, UT 84648
$-1,127
Cash flow
-9.1%
Cash-on-Cash Return
3.6%
Cap rate
0.5%
Rent to Value Ratio
Active
$910,000
7
bds
|
4
ba
|
6,400
sqft
|
built
2005
1102 S 250 E, Nephi, UT 84648
$-2,227
Cash flow
-12.8%
Cash-on-Cash Return
2.7%
Cap rate
0.4%
Rent to Value Ratio
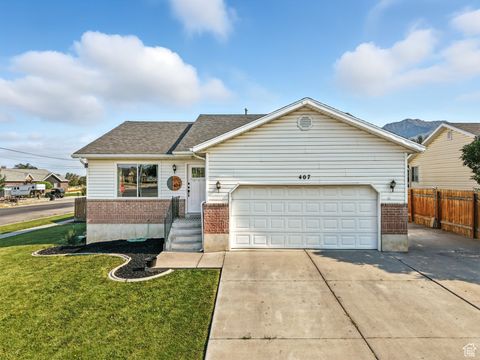
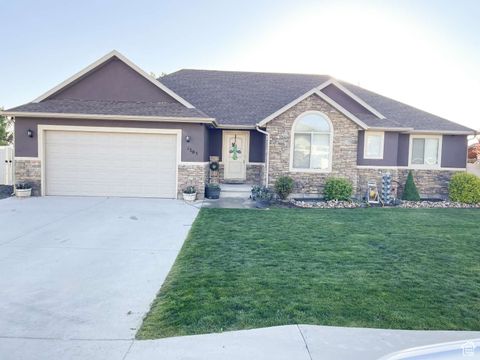
Active
$450,000
4
bds
|
2
ba
|
2,100
sqft
|
built
1999
407 E 760 S, Nephi, UT 84648
$-911
Cash flow
-10.6%
Cash-on-Cash Return
3.3%
Cap rate
0.4%
Rent to Value Ratio
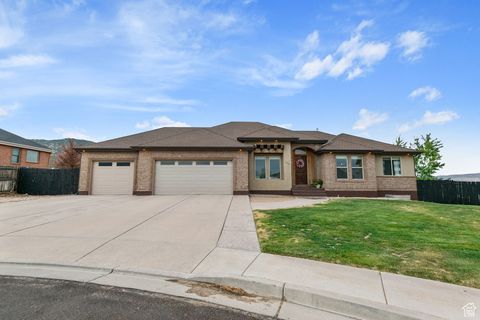
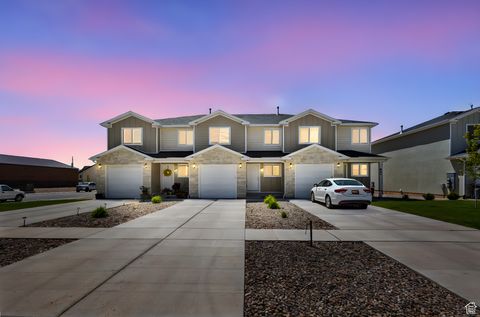
Active
$535,000
3
bds
|
2
ba
|
1,803
sqft
|
built
2021
1188 N 100 E, Nephi, UT 84648
$-790
Cash flow
-7.7%
Cash-on-Cash Return
3.9%
Cap rate
0.5%
Rent to Value Ratio
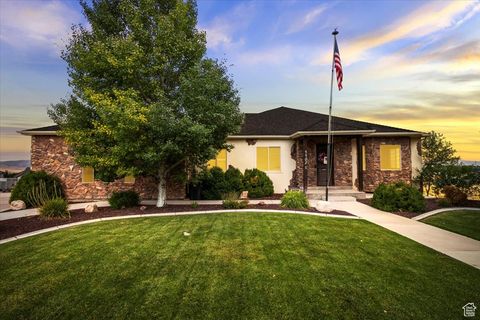
Active
$393,700
3
bds
|
3
ba
|
2,529
sqft
|
built
2022
926 N 165 W, Nephi, UT 84648
$-792
Cash flow
-10.5%
Cash-on-Cash Return
3.3%
Cap rate
0.5%
Rent to Value Ratio
Active
$552,900
4
bds
|
3
ba
|
3,173
sqft
|
built
1982
585 N 700 E, Nephi, UT 84648
$-1,301
Cash flow
-12.3%
Cash-on-Cash Return
2.9%
Cap rate
0.4%
Rent to Value Ratio
Active
$349,000
2
bds
|
1
ba
|
980
sqft
|
built
1942
496 N 500 E, Nephi, UT 84648
$-998
Cash flow
-14.9%
Cash-on-Cash Return
2.2%
Cap rate
0.3%
Rent to Value Ratio
Active
$429,900
3
bds
|
2
ba
|
2,046
sqft
|
built
1966
485 N 300 E, Nephi, UT 84648
$-1,225
Cash flow
-14.9%
Cash-on-Cash Return
2.3%
Cap rate
0.3%
Rent to Value Ratio
Active
$798,000
10
bds
|
4
ba
|
4,774
sqft
|
built
2022
971 N 100 W, Nephi, UT 84648
$-2,977
Cash flow
-19.5%
Cash-on-Cash Return
1.2%
Cap rate
0.2%
Rent to Value Ratio
Active
$545,000
6
bds
|
3
ba
|
3,306
sqft
|
built
2016
1303 N 150 E, Nephi, UT 84648
$-1,289
Cash flow
-12.3%
Cash-on-Cash Return
2.8%
Cap rate
0.4%
Rent to Value Ratio
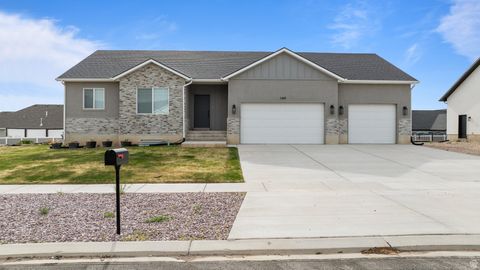
Active
$625,000
6
bds
|
3
ba
|
3,103
sqft
|
built
2022
1169 N 200 E, Nephi, UT 84648
$-793
Cash flow
-6.6%
Cash-on-Cash Return
4.2%
Cap rate
0.6%
Rent to Value Ratio
Active
$499,000
4
bds
|
2
ba
|
2,442
sqft
|
built
1998
68 E 100 N, Nephi, UT 84648
$-1,051
Cash flow
-11.0%
Cash-on-Cash Return
3.2%
Cap rate
0.4%
Rent to Value Ratio