Clark County Investment Properties for Sale
Browse homes for sale and investment properties in Clark County. Refine your search by price, property type, or more.
Best cash flowing properties in Clark County
Active
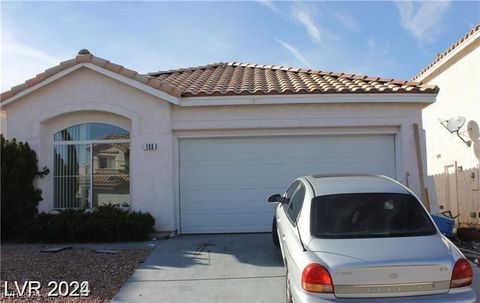
$145,000
1
bds
|
1
ba
|
462
sqft
|
built
1986
440 Elm Dr, Las Vegas, NV 89169
$-146
Cash flow
-5.3%
Cash-on-Cash Return
4.5%
Cap rate
0.8%
Rent to Value Ratio
Active
$179,000
2
bds
|
2
ba
|
996
sqft
|
built
1995
845 Mesquite Springs Dr, Mesquite, NV 89027
$-205
Cash flow
-6.0%
Cash-on-Cash Return
4.3%
Cap rate
0.8%
Rent to Value Ratio
6,566 out of 6,787 properties for sale in Clark County
Limited Results Shown
Create a free account, or log in to reveal all property listings and enjoy the complete experience.
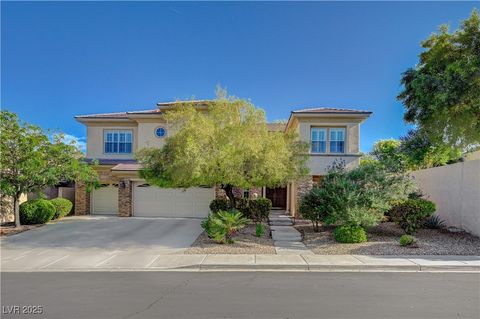
Active
$719,900
4
bds
|
3
ba
|
2,475
sqft
|
built
1996
9900 Summer Ash Ct, Las Vegas, NV 89134
$-2,365
Cash flow
-17.1%
Cash-on-Cash Return
1.7%
Cap rate
0.3%
Rent to Value Ratio
Active
$459,900
4
bds
|
3
ba
|
2,325
sqft
|
built
2010
6028 Stern Cove Ct, North Las Vegas, NV 89031
$-937
Cash flow
-10.6%
Cash-on-Cash Return
3.2%
Cap rate
0.5%
Rent to Value Ratio
Active
$284,999
3
bds
|
2
ba
|
1,258
sqft
|
built
1994
8452 Boseck Dr, Las Vegas, NV 89145
$-474
Cash flow
-8.7%
Cash-on-Cash Return
3.7%
Cap rate
0.6%
Rent to Value Ratio
Active
$679,000
5
bds
|
3
ba
|
2,874
sqft
|
built
1996
222 Hollyfern St, Henderson, NV 89074
$-957
Cash flow
-7.4%
Cash-on-Cash Return
4.0%
Cap rate
0.5%
Rent to Value Ratio

Active
$4,750,000
4
bds
|
6
ba
|
8,107
sqft
|
built
2000
1309 Imperia Dr, Henderson, NV 89052
$-18,629
Cash flow
-20.5%
Cash-on-Cash Return
1.0%
Cap rate
0.2%
Rent to Value Ratio
Active
$379,000
3
bds
|
2
ba
|
1,319
sqft
|
built
2022
527 Clearsable Ave, Henderson, NV 89044
$-521
Cash flow
-7.2%
Cash-on-Cash Return
4.0%
Cap rate
0.7%
Rent to Value Ratio
Active
$588,888
4
bds
|
3
ba
|
2,405
sqft
|
built
2004
177 Rocky Star St, Henderson, NV 89012
$-1,506
Cash flow
-13.3%
Cash-on-Cash Return
2.6%
Cap rate
0.4%
Rent to Value Ratio

Active
$519,900
3
bds
|
3
ba
|
1,770
sqft
|
built
2003
5220 Melbourne Ridge Ct, Las Vegas, NV 89141
$-951
Cash flow
-9.5%
Cash-on-Cash Return
3.5%
Cap rate
0.5%
Rent to Value Ratio
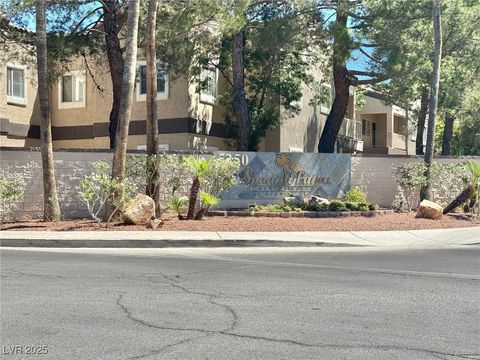
Active
$220,000
2
bds
|
2
ba
|
1,047
sqft
|
built
2000
5710 E Tropicana Ave, Las Vegas, NV 89122
$-397
Cash flow
-9.4%
Cash-on-Cash Return
3.5%
Cap rate
0.6%
Rent to Value Ratio

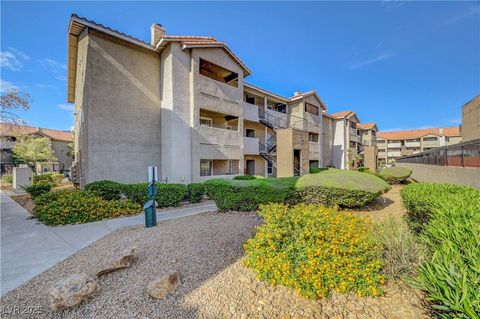
Active
$169,900
1
bds
|
1
ba
|
695
sqft
|
built
1999
5710 E Tropicana Ave, Las Vegas, NV 89122
$-322
Cash flow
-9.9%
Cash-on-Cash Return
3.4%
Cap rate
0.6%
Rent to Value Ratio
Active
$379,900
4
bds
|
2
ba
|
1,257
sqft
|
built
1957
2705 Howard Dr, Las Vegas, NV 89104
$-809
Cash flow
-11.1%
Cash-on-Cash Return
3.1%
Cap rate
0.4%
Rent to Value Ratio
Active
$433,000
3
bds
|
2
ba
|
1,674
sqft
|
built
2002
7515 Splashing Rock Dr, Las Vegas, NV 89131
$-930
Cash flow
-11.2%
Cash-on-Cash Return
3.1%
Cap rate
0.5%
Rent to Value Ratio
Active
$315,000
3
bds
|
3
ba
|
1,196
sqft
|
built
1973
1511 Living Desert Dr, Las Vegas, NV 89119
$-606
Cash flow
-10.0%
Cash-on-Cash Return
3.4%
Cap rate
0.6%
Rent to Value Ratio
Active
$499,900
3
bds
|
3
ba
|
1,562
sqft
|
built
1990
133 Mc Laren St, Henderson, NV 89074
$-1,217
Cash flow
-12.7%
Cash-on-Cash Return
2.8%
Cap rate
0.4%
Rent to Value Ratio
Active
$1,249,999
5
bds
|
5
ba
|
3,535
sqft
|
built
2003
10729 Grey Havens Ct, Las Vegas, NV 89135
$-3,762
Cash flow
-15.7%
Cash-on-Cash Return
2.1%
Cap rate
0.4%
Rent to Value Ratio

Active
$579,990
5
bds
|
3
ba
|
3,040
sqft
|
built
1999
825 Cornerstone Pl, North Las Vegas, NV 89031
$-1,108
Cash flow
-10.0%
Cash-on-Cash Return
3.4%
Cap rate
0.5%
Rent to Value Ratio

Active
$235,000
1
bds
|
1
ba
|
897
sqft
|
built
1973
2855 Geary Pl, Las Vegas, NV 89109
$-667
Cash flow
-14.8%
Cash-on-Cash Return
2.3%
Cap rate
0.6%
Rent to Value Ratio
Active
$257,000
2
bds
|
2
ba
|
1,034
sqft
|
built
1997
5250 S Rainbow Blvd, Las Vegas, NV 89118
$-663
Cash flow
-13.5%
Cash-on-Cash Return
2.6%
Cap rate
0.6%
Rent to Value Ratio
Active
$385,000
2
bds
|
2
ba
|
902
sqft
|
built
1990
4200 S Valley View Blvd, Las Vegas, NV 89103
$-572
Cash flow
-7.8%
Cash-on-Cash Return
3.9%
Cap rate
0.6%
Rent to Value Ratio
Active
$849,999
4
bds
|
5
ba
|
3,414
sqft
|
built
2002
4739 Laurel Canyon St, Las Vegas, NV 89129
$-2,330
Cash flow
-14.3%
Cash-on-Cash Return
2.4%
Cap rate
0.4%
Rent to Value Ratio

Active
$223,000
1
bds
|
1
ba
|
786
sqft
|
built
2005
23 E Agate Ave, Las Vegas, NV 89123
$-558
Cash flow
-13.1%
Cash-on-Cash Return
2.7%
Cap rate
0.7%
Rent to Value Ratio
Active
$273,600
2
bds
|
2
ba
|
1,089
sqft
|
built
1997
2300 E Silverado Ranch Blvd, Las Vegas, NV 89183
$-714
Cash flow
-13.6%
Cash-on-Cash Return
2.5%
Cap rate
0.6%
Rent to Value Ratio
Active
$226,000
2
bds
|
2
ba
|
960
sqft
|
built
1997
2300 E Silverado Ranch Blvd, Las Vegas, NV 89183
$-522
Cash flow
-12.1%
Cash-on-Cash Return
2.9%
Cap rate
0.6%
Rent to Value Ratio
Active
$389,000
3
bds
|
2
ba
|
1,232
sqft
|
built
1996
75 N Valle Verde Dr, Henderson, NV 89074
$-1,173
Cash flow
-15.7%
Cash-on-Cash Return
2.1%
Cap rate
0.4%
Rent to Value Ratio
Active
$749,900
3
bds
|
3
ba
|
2,509
sqft
|
built
1998
2262 Alanhurst Dr, Henderson, NV 89052
$-1,866
Cash flow
-13.0%
Cash-on-Cash Return
2.7%
Cap rate
0.4%
Rent to Value Ratio
Active
$2,190,000
4
bds
|
4
ba
|
3,547
sqft
|
built
2019
1181 Calle De Luz, Henderson, NV 89012
$-8,291
Cash flow
-19.8%
Cash-on-Cash Return
1.1%
Cap rate
0.2%
Rent to Value Ratio
Active
$4,950,000
6
bds
|
8
ba
|
8,844
sqft
|
built
2006
584 Saint Croix St, Henderson, NV 89012
$-18,220
Cash flow
-19.2%
Cash-on-Cash Return
1.3%
Cap rate
0.2%
Rent to Value Ratio
Active
$215,990
2
bds
|
2
ba
|
1,205
sqft
|
built
1984
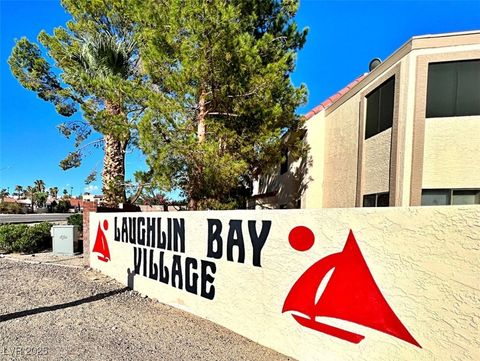
3740 Desert Marina Dr, Laughlin, NV 89029
$-527
Cash flow
-12.7%
Cash-on-Cash Return
2.8%
Cap rate
0.6%
Rent to Value Ratio
Active
$725,000
4
bds
|
3
ba
|
2,654
sqft
|
built
1992
8953 Belconte Ln, Henderson, NV 89074
$-1,529
Cash flow
-11.0%
Cash-on-Cash Return
3.1%
Cap rate
0.4%
Rent to Value Ratio
Active
$615,000
4
bds
|
3
ba
|
2,453
sqft
|
built
1996
8541 Highland View Ave, Las Vegas, NV 89145
$-1,270
Cash flow
-10.8%
Cash-on-Cash Return
3.2%
Cap rate
0.4%
Rent to Value Ratio
Active
$529,000
4
bds
|
3
ba
|
2,310
sqft
|
built
2005
9750 Maple Sugar Leaf Pl, Las Vegas, NV 89148
$-1,156
Cash flow
-11.4%
Cash-on-Cash Return
3.1%
Cap rate
0.4%
Rent to Value Ratio
Active
$895,000
5
bds
|
3
ba
|
2,791
sqft
|
built
2003
11784 Golden Moments Ave, Las Vegas, NV 89138
$-1,638
Cash flow
-9.5%
Cash-on-Cash Return
3.5%
Cap rate
0.5%
Rent to Value Ratio
Active
$900,000
7
bds
|
5
ba
|
4,658
sqft
|
built
1990
3021 Ocean Port Dr, Las Vegas, NV 89117
$-1,956
Cash flow
-11.3%
Cash-on-Cash Return
3.1%
Cap rate
0.5%
Rent to Value Ratio
Active
$525,000
3
bds
|
2
ba
|
1,388
sqft
|
built
1963
2043 Sombrero Dr, Las Vegas, NV 89169
$-849
Cash flow
-8.4%
Cash-on-Cash Return
3.7%
Cap rate
0.5%
Rent to Value Ratio
Active
$575,000
4
bds
|
2
ba
|
1,959
sqft
|
built
2007
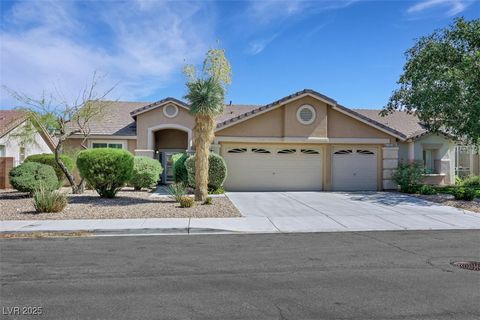
10311 Slope Ridge St, Las Vegas, NV 89131
$-1,073
Cash flow
-9.7%
Cash-on-Cash Return
3.4%
Cap rate
0.5%
Rent to Value Ratio
Active
$9,995,000
5
bds
|
7
ba
|
8,288
sqft
|
built
2021
665 Overlook Rim Dr, Henderson, NV 89012
$-46,413
Cash flow
-24.2%
Cash-on-Cash Return
0.1%
Cap rate
0.1%
Rent to Value Ratio
Active
$565,000
8
bds
|
0
ba
|
3,112
sqft
|
built
1984
2705 Jennydiane Dr, Las Vegas, NV 89121
$-1,837
Cash flow
-17.0%
Cash-on-Cash Return
1.8%
Cap rate
0.3%
Rent to Value Ratio
Active
$749,500
4
bds
|
2
ba
|
2,589
sqft
|
built
2000
2740 Carolina Blue Ave, Henderson, NV 89052
$-1,440
Cash flow
-10.0%
Cash-on-Cash Return
3.4%
Cap rate
0.5%
Rent to Value Ratio