Clark County Investment Properties for Sale
Browse homes for sale and investment properties in Clark County. Refine your search by price, property type, or more.
Best cash flowing properties in Clark County

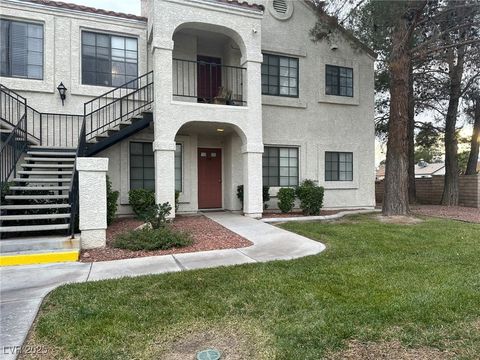
Active
$195,000
2
bds
|
2
ba
|
889
sqft
|
built
1987
2964 Juniper Hills Blvd, Las Vegas, NV 89142
$-135
Cash flow
-3.6%
Cash-on-Cash Return
4.8%
Cap rate
0.7%
Rent to Value Ratio
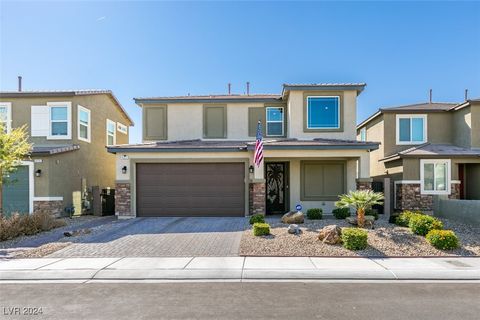
Active
$285,000
3
bds
|
3
ba
|
1,173
sqft
|
built
1999
2525 Sierra Bello Ave, Las Vegas, NV 89106
$-262
Cash flow
-4.8%
Cash-on-Cash Return
4.6%
Cap rate
0.7%
Rent to Value Ratio
5,692 out of 5,885 properties for sale in Clark County
Limited Results Shown
Create a free account, or log in to reveal all property listings and enjoy the complete experience.
Active
$1,179,000
5
bds
|
5
ba
|
4,658
sqft
|
built
2000
2445 Ping Dr, Henderson, NV 89074
$-3,563
Cash flow
-15.8%
Cash-on-Cash Return
2.1%
Cap rate
0.3%
Rent to Value Ratio
Active
$9,750,000
4
bds
|
7
ba
|
9,810
sqft
|
built
2007
4927 Snow White Rd, Mount Charleston, NV 89124
$-43,340
Cash flow
-23.2%
Cash-on-Cash Return
0.3%
Cap rate
0.1%
Rent to Value Ratio
Active
$917,999
4
bds
|
3
ba
|
3,151
sqft
|
built
2000
812 Eaglewood Dr, Las Vegas, NV 89144
$-2,380
Cash flow
-13.5%
Cash-on-Cash Return
2.6%
Cap rate
0.4%
Rent to Value Ratio
Active
$599,888
4
bds
|
3
ba
|
2,468
sqft
|
built
1990
950 Eagle Mountain Dr, Las Vegas, NV 89123
$-874
Cash flow
-7.6%
Cash-on-Cash Return
3.9%
Cap rate
0.5%
Rent to Value Ratio
Active
$770,000
5
bds
|
4
ba
|
3,004
sqft
|
built
1979
6995 Rogers St, Las Vegas, NV 89118
$-2,104
Cash flow
-14.3%
Cash-on-Cash Return
2.4%
Cap rate
0.3%
Rent to Value Ratio
Active
$525,000
3
bds
|
3
ba
|
2,114
sqft
|
built
2015
7613 Pulpit Rock Ct, Las Vegas, NV 89166
$-1,330
Cash flow
-13.2%
Cash-on-Cash Return
2.6%
Cap rate
0.4%
Rent to Value Ratio
Active
$630,000
3
bds
|
4
ba
|
2,034
sqft
|
built
2022
728 Omaggio Pl, Henderson, NV 89011
$-1,293
Cash flow
-10.7%
Cash-on-Cash Return
3.2%
Cap rate
0.5%
Rent to Value Ratio
Active
$680,000
4
bds
|
4
ba
|
3,122
sqft
|
built
2022
9993 Birch Knoll Ave, Las Vegas, NV 89166
$-1,615
Cash flow
-12.4%
Cash-on-Cash Return
2.8%
Cap rate
0.5%
Rent to Value Ratio
Active
$365,000
3
bds
|
3
ba
|
1,520
sqft
|
built
2022
6952 Skyline Blue St, North Las Vegas, NV 89086
$-482
Cash flow
-6.9%
Cash-on-Cash Return
4.1%
Cap rate
0.7%
Rent to Value Ratio
Active
$359,900
3
bds
|
3
ba
|
1,665
sqft
|
built
2022
2765 Frosted Teal Ave, North Las Vegas, NV 89086
$-885
Cash flow
-12.8%
Cash-on-Cash Return
2.7%
Cap rate
0.6%
Rent to Value Ratio
Active
$280,000
2
bds
|
2
ba
|
1,024
sqft
|
built
2001
6650 W Warm Springs Rd, Las Vegas, NV 89118
$-494
Cash flow
-9.2%
Cash-on-Cash Return
3.6%
Cap rate
0.6%
Rent to Value Ratio
Active
$649,900
4
bds
|
3
ba
|
2,347
sqft
|
built
1990
2012 Lady Lake St, Las Vegas, NV 89128
$-1,468
Cash flow
-11.8%
Cash-on-Cash Return
3.0%
Cap rate
0.4%
Rent to Value Ratio
Active
$175,000
2
bds
|
2
ba
|
1,070
sqft
|
built
1977
5248 Greene Ln, Las Vegas, NV 89119
$-289
Cash flow
-8.6%
Cash-on-Cash Return
3.7%
Cap rate
0.7%
Rent to Value Ratio
Active
$399,900
3
bds
|
3
ba
|
1,563
sqft
|
built
2020
1115 Brilliant Meadow Ave, North Las Vegas, NV 89086
$-737
Cash flow
-9.6%
Cash-on-Cash Return
3.5%
Cap rate
0.6%
Rent to Value Ratio
Active
$365,000
4
bds
|
2
ba
|
1,436
sqft
|
built
1981
4153 Broadriver Dr, Las Vegas, NV 89108
$-559
Cash flow
-8.0%
Cash-on-Cash Return
3.8%
Cap rate
0.5%
Rent to Value Ratio

Active
$457,000
5
bds
|
3
ba
|
2,169
sqft
|
built
1996
6276 Back Woods Rd, Las Vegas, NV 89142
$-588
Cash flow
-6.7%
Cash-on-Cash Return
4.1%
Cap rate
0.5%
Rent to Value Ratio
Active
$485,000
3
bds
|
3
ba
|
2,678
sqft
|
built
2003
6736 Sugarbird Ct, North Las Vegas, NV 89084
$-1,006
Cash flow
-10.8%
Cash-on-Cash Return
3.2%
Cap rate
0.5%
Rent to Value Ratio
Active
$499,000
3
bds
|
3
ba
|
1,853
sqft
|
built
2005
2526 Begonia Valley Ave, Henderson, NV 89074
$-887
Cash flow
-9.3%
Cash-on-Cash Return
3.5%
Cap rate
0.5%
Rent to Value Ratio
Active
$1,500,000
5
bds
|
4
ba
|
4,996
sqft
|
built
2003
6655 Tranquil Seas Ct, Las Vegas, NV 89139
$-3,367
Cash flow
-11.7%
Cash-on-Cash Return
3.0%
Cap rate
0.4%
Rent to Value Ratio
Active
$849,000
5
bds
|
3
ba
|
3,862
sqft
|
built
2002
2566 Antique Blossom Ave, Henderson, NV 89052
$-1,776
Cash flow
-10.9%
Cash-on-Cash Return
3.2%
Cap rate
0.5%
Rent to Value Ratio
Active
$589,900
4
bds
|
3
ba
|
2,372
sqft
|
built
1975
3057 Downing Pl, Las Vegas, NV 89121
$-1,207
Cash flow
-10.7%
Cash-on-Cash Return
3.2%
Cap rate
0.4%
Rent to Value Ratio
Active
$237,500
2
bds
|
2
ba
|
884
sqft
|
built
1988
4707 Nara Vista Way, Las Vegas, NV 89103
$-451
Cash flow
-9.9%
Cash-on-Cash Return
3.4%
Cap rate
0.6%
Rent to Value Ratio
Active
$480,000
3
bds
|
3
ba
|
1,997
sqft
|
built
2019
4323 Creekside Cavern Ave, North Las Vegas, NV 89084
$-888
Cash flow
-9.7%
Cash-on-Cash Return
3.5%
Cap rate
0.5%
Rent to Value Ratio
Active
$272,000
2
bds
|
2
ba
|
1,137
sqft
|
built
1992
6836 Elm Creek Dr, Las Vegas, NV 89108
$-499
Cash flow
-9.6%
Cash-on-Cash Return
3.5%
Cap rate
0.6%
Rent to Value Ratio
Active
$385,000
3
bds
|
4
ba
|
1,991
sqft
|
built
1996
491 Marina Cv, Boulder City, NV 89005
$-733
Cash flow
-9.9%
Cash-on-Cash Return
3.4%
Cap rate
0.6%
Rent to Value Ratio
Active
$420,000
4
bds
|
3
ba
|
1,650
sqft
|
built
2007
1169 Nightmoss Ave, Las Vegas, NV 89183
$-617
Cash flow
-7.7%
Cash-on-Cash Return
3.9%
Cap rate
0.5%
Rent to Value Ratio
Active
$400,000
3
bds
|
2
ba
|
1,622
sqft
|
built
2004
5717 Wizard Wand St, North Las Vegas, NV 89031
$-656
Cash flow
-8.6%
Cash-on-Cash Return
3.7%
Cap rate
0.5%
Rent to Value Ratio
Active
$525,000
2
bds
|
2
ba
|
2,012
sqft
|
built
2004
40 Luce Del Sole, Henderson, NV 89011
$-1,366
Cash flow
-13.6%
Cash-on-Cash Return
2.6%
Cap rate
0.6%
Rent to Value Ratio
Active
$2,200,000
6
bds
|
5
ba
|
5,622
sqft
|
built
1986
6971 Arville St, Las Vegas, NV 89118
$-3,140
Cash flow
-7.4%
Cash-on-Cash Return
4.0%
Cap rate
0.5%
Rent to Value Ratio
Active
$525,000
3
bds
|
3
ba
|
1,435
sqft
|
built
2019
56 Lomita Heights Dr, Las Vegas, NV 89138
$-1,284
Cash flow
-12.8%
Cash-on-Cash Return
2.7%
Cap rate
0.5%
Rent to Value Ratio
Active
$599,000
4
bds
|
3
ba
|
2,612
sqft
|
built
2016
933 Kimbark Ave, Las Vegas, NV 89148
$-1,687
Cash flow
-14.7%
Cash-on-Cash Return
2.3%
Cap rate
0.4%
Rent to Value Ratio
Active
$850,000
3
bds
|
3
ba
|
2,984
sqft
|
built
2003
1532 Via Cassia, Henderson, NV 89052
$-2,130
Cash flow
-13.1%
Cash-on-Cash Return
2.7%
Cap rate
0.4%
Rent to Value Ratio
Active
$250,000
2
bds
|
2
ba
|
1,069
sqft
|
built
2008
5521 Jackpot Winner Ln, Las Vegas, NV 89122
$-494
Cash flow
-10.3%
Cash-on-Cash Return
3.3%
Cap rate
0.6%
Rent to Value Ratio
Active
$198,800
2
bds
|
2
ba
|
900
sqft
|
built
1990
2240 Highpointe Dr, Laughlin, NV 89029
$-403
Cash flow
-10.6%
Cash-on-Cash Return
3.2%
Cap rate
0.7%
Rent to Value Ratio
Active
$465,000
3
bds
|
3
ba
|
2,570
sqft
|
built
2016
5852 Clear Haven Ln, North Las Vegas, NV 89081
$-1,112
Cash flow
-12.5%
Cash-on-Cash Return
2.8%
Cap rate
0.5%
Rent to Value Ratio
Active
$777,000
3
bds
|
2
ba
|
2,184
sqft
|
built
1988
7460 Buckskin Ave, Las Vegas, NV 89129
$-1,544
Cash flow
-10.4%
Cash-on-Cash Return
3.3%
Cap rate
0.5%
Rent to Value Ratio
Active
$374,990
2
bds
|
3
ba
|
1,593
sqft
|
built
2016
9037 Cross Stitch Ct, Las Vegas, NV 89149
$-797
Cash flow
-11.1%
Cash-on-Cash Return
3.1%
Cap rate
0.5%
Rent to Value Ratio
Active
$719,000
4
bds
|
3
ba
|
2,802
sqft
|
built
2002
1095 Endora Way, Boulder City, NV 89005
$-1,236
Cash flow
-9.0%
Cash-on-Cash Return
3.6%
Cap rate
0.5%
Rent to Value Ratio