Clark County Investment Properties for Sale
Browse homes for sale and investment properties in Clark County. Refine your search by price, property type, or more.
Best cash flowing properties in Clark County
Active
$175,000
2
bds
|
2
ba
|
976
sqft
|
built
1998
3318 N Decatur Blvd, Las Vegas, NV 89130
$-293
Cash flow
-8.7%
Cash-on-Cash Return
3.7%
Cap rate
0.8%
Rent to Value Ratio
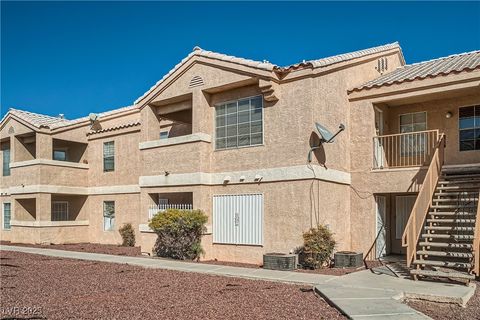
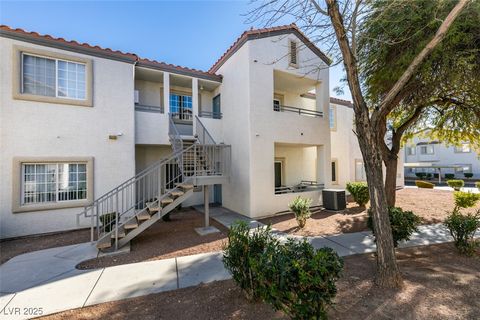
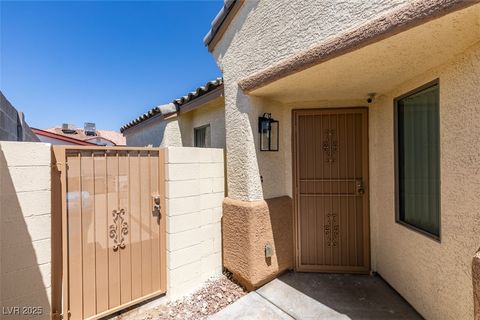
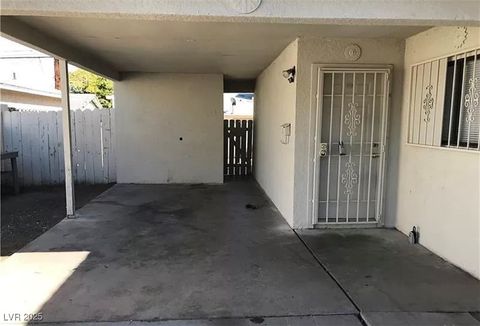
Active
$164,900
2
bds
|
2
ba
|
928
sqft
|
built
1999
1830 N Pecos Rd, Las Vegas, NV 89115
$-325
Cash flow
-10.3%
Cash-on-Cash Return
3.3%
Cap rate
0.7%
Rent to Value Ratio
6,132 out of 6,341 properties for sale in Clark County
Limited Results Shown
Create a free account, or log in to reveal all property listings and enjoy the complete experience.
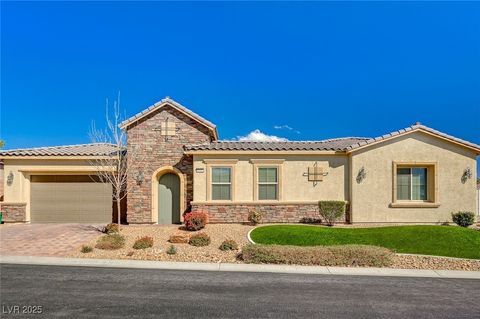
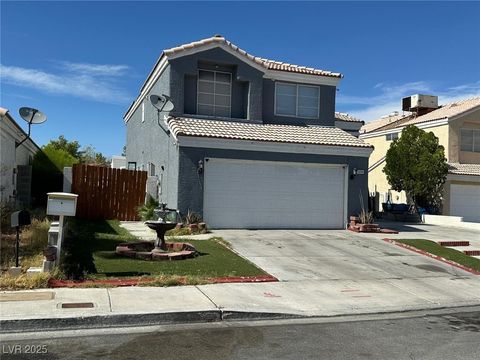
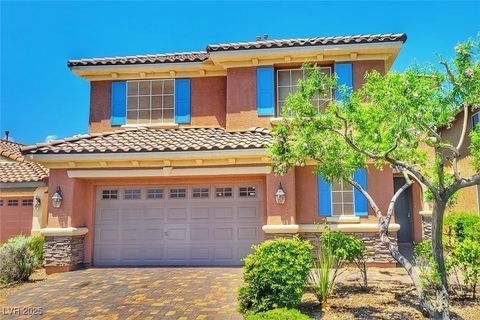
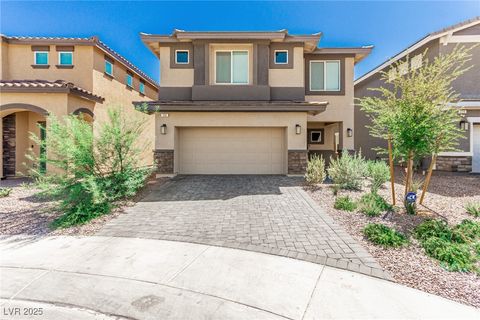
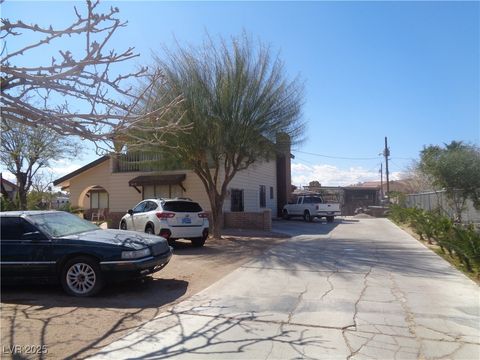
Active
$974,999
4
bds
|
4
ba
|
3,459
sqft
|
built
2018
6332 Cascade Range St, Las Vegas, NV 89149
$-1,302
Cash flow
-7.0%
Cash-on-Cash Return
4.1%
Cap rate
0.5%
Rent to Value Ratio
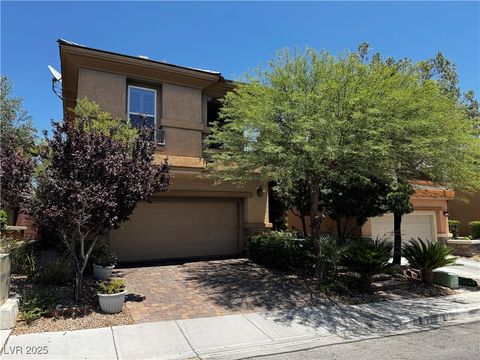
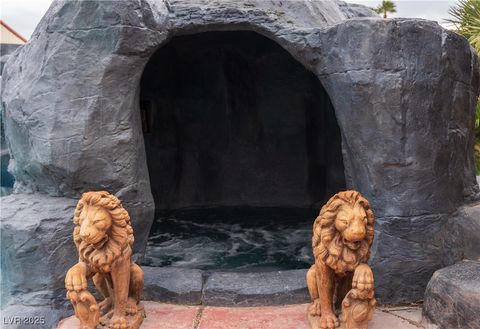
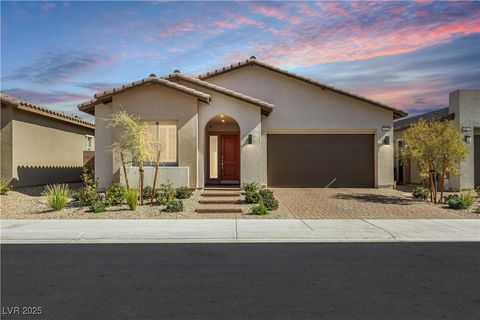
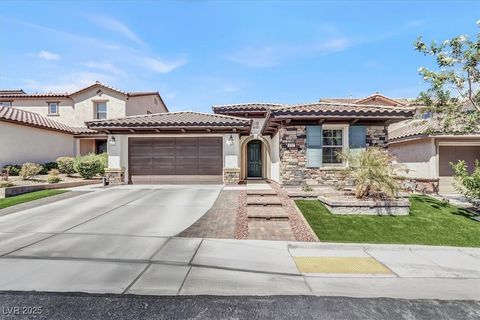
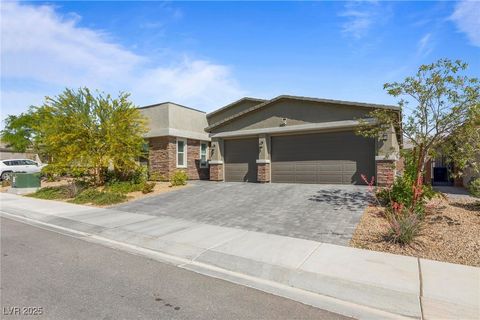
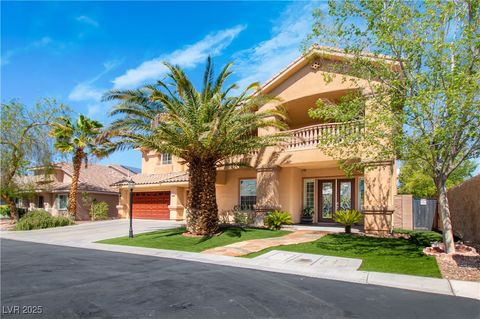
Active
$698,990
4
bds
|
3
ba
|
2,543
sqft
|
built
2007
10526 Harvest Wind Dr, Las Vegas, NV 89135
$-1,501
Cash flow
-11.2%
Cash-on-Cash Return
3.1%
Cap rate
0.4%
Rent to Value Ratio
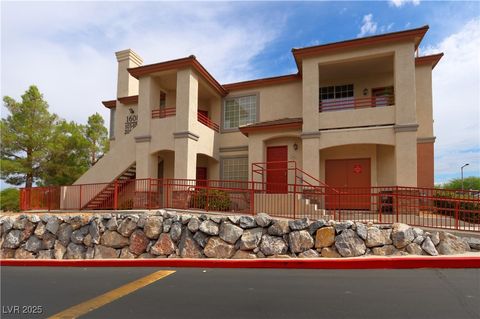
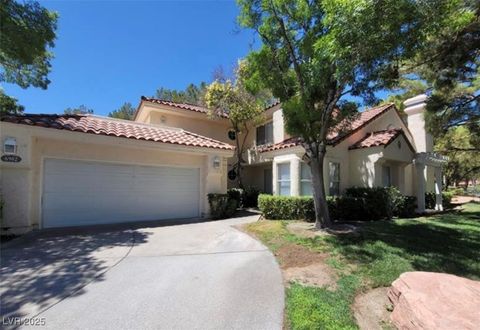
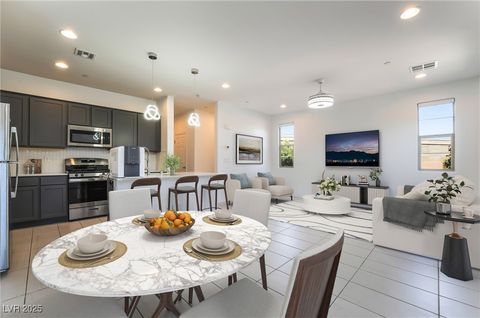
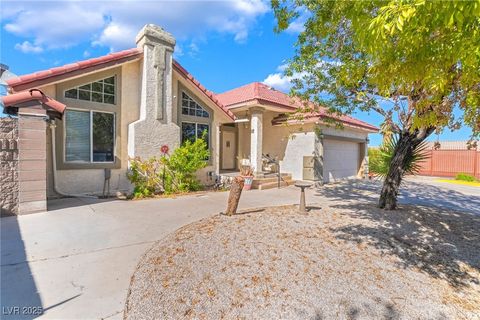
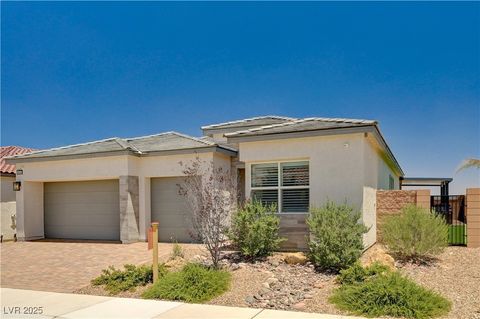
Active
$644,900
4
bds
|
3
ba
|
2,153
sqft
|
built
2022
10968 Tracy Stevens Ave, Las Vegas, NV 89166
$-1,775
Cash flow
-14.4%
Cash-on-Cash Return
2.4%
Cap rate
0.4%
Rent to Value Ratio
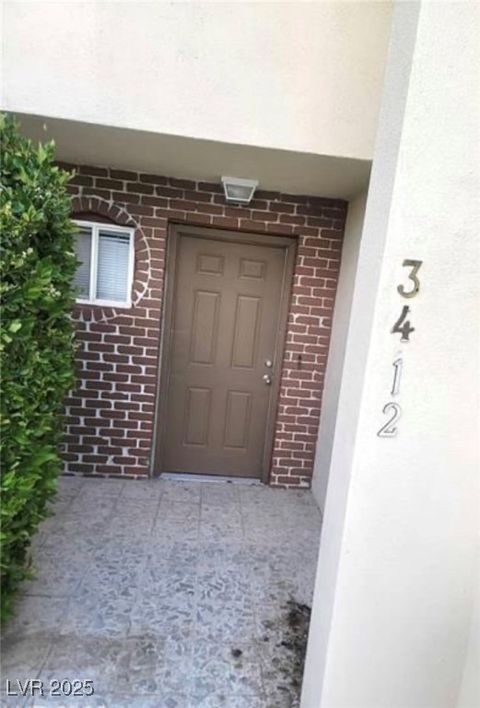
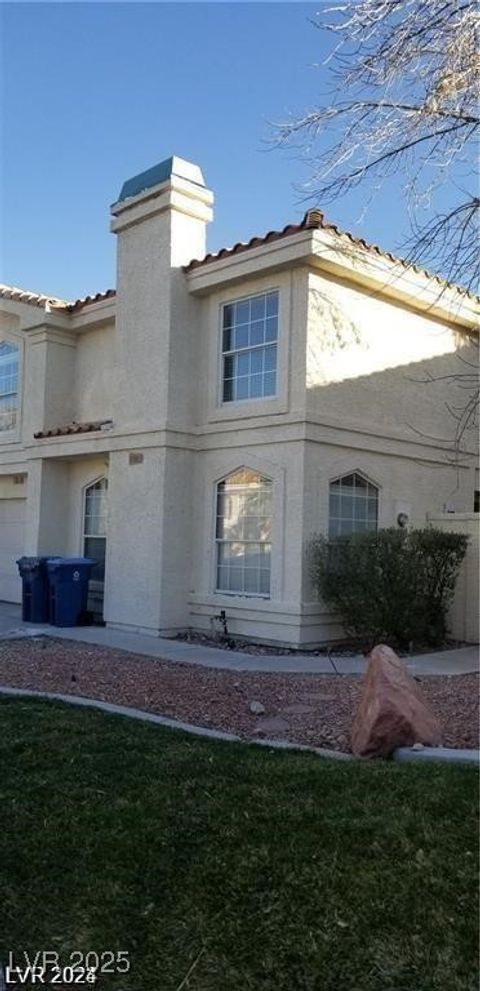
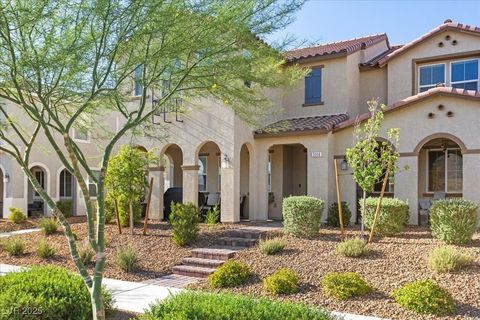
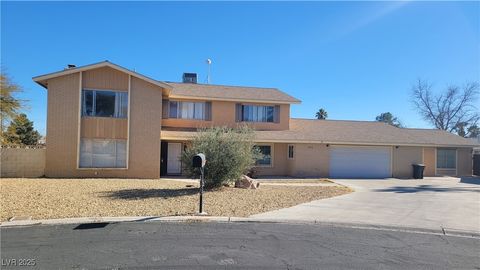
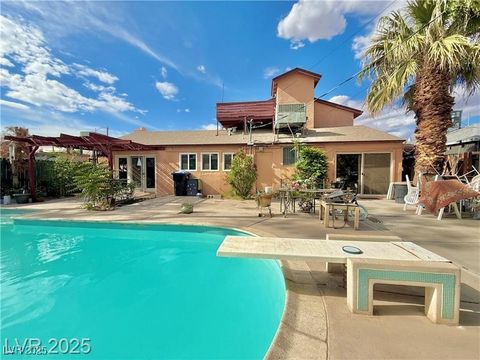
Active
$409,900
3
bds
|
3
ba
|
2,060
sqft
|
built
1972
3412 Townhouse Dr, Las Vegas, NV 89121
$-1,176
Cash flow
-15.0%
Cash-on-Cash Return
2.2%
Cap rate
0.3%
Rent to Value Ratio
Active
$2,899,999
4
bds
|
5
ba
|
4,445
sqft
|
built
2021
5231 Iron River Ct, Las Vegas, NV 89135
$-11,513
Cash flow
-20.7%
Cash-on-Cash Return
0.9%
Cap rate
0.2%
Rent to Value Ratio
Active
$499,900
3
bds
|
2
ba
|
1,602
sqft
|
built
2003
7667 Borealis St, Las Vegas, NV 89123
$-1,341
Cash flow
-14.0%
Cash-on-Cash Return
2.5%
Cap rate
0.4%
Rent to Value Ratio
Active
$438,000
3
bds
|
3
ba
|
1,779
sqft
|
built
1990
6208 Mandarin Dr, Las Vegas, NV 89108
$-820
Cash flow
-9.8%
Cash-on-Cash Return
3.4%
Cap rate
0.5%
Rent to Value Ratio
Active
$679,999
4
bds
|
2
ba
|
2,710
sqft
|
built
1989
4745 Gunlock Cir, North Las Vegas, NV 89031
$-1,552
Cash flow
-11.9%
Cash-on-Cash Return
2.9%
Cap rate
0.4%
Rent to Value Ratio
Active
$349,900
3
bds
|
2
ba
|
1,265
sqft
|
built
1998
1608 Sussex St, Las Vegas, NV 89144
$-863
Cash flow
-12.9%
Cash-on-Cash Return
2.7%
Cap rate
0.5%
Rent to Value Ratio
Active
$429,900
3
bds
|
3
ba
|
1,523
sqft
|
built
1996
7963 Laurena Ave, Las Vegas, NV 89147
$-1,144
Cash flow
-13.9%
Cash-on-Cash Return
2.5%
Cap rate
0.4%
Rent to Value Ratio
Active
$370,000
3
bds
|
2
ba
|
1,333
sqft
|
built
2005
1905 Eskam St, Las Vegas, NV 89156
$-657
Cash flow
-9.3%
Cash-on-Cash Return
3.5%
Cap rate
0.5%
Rent to Value Ratio
Active
$549,900
5
bds
|
3
ba
|
2,661
sqft
|
built
2007
10279 Montes Vascos Dr, Las Vegas, NV 89178
$-947
Cash flow
-9.0%
Cash-on-Cash Return
3.6%
Cap rate
0.5%
Rent to Value Ratio
Active
$995,000
4
bds
|
4
ba
|
2,386
sqft
|
built
2022
144 Sarabeth St, Las Vegas, NV 89138
$-2,988
Cash flow
-15.7%
Cash-on-Cash Return
2.1%
Cap rate
0.4%
Rent to Value Ratio
Active
$569,900
2
bds
|
3
ba
|
1,752
sqft
|
built
1987
6902 Emerald Springs Ln, Las Vegas, NV 89113
$-2,147
Cash flow
-19.7%
Cash-on-Cash Return
1.2%
Cap rate
0.4%
Rent to Value Ratio
Active
$572,000
4
bds
|
3
ba
|
2,406
sqft
|
built
2024
330 Spring Dove Ave, Henderson, NV 89011
$-1,421
Cash flow
-13.0%
Cash-on-Cash Return
2.7%
Cap rate
0.4%
Rent to Value Ratio
Active
$574,900
3
bds
|
3
ba
|
2,043
sqft
|
built
2016
835 Via Serenelia, Henderson, NV 89011
$-1,301
Cash flow
-11.8%
Cash-on-Cash Return
3.0%
Cap rate
0.5%
Rent to Value Ratio
Active
$355,000
3
bds
|
3
ba
|
1,712
sqft
|
built
2021
756 Sleeping City Ave, Henderson, NV 89015
$-708
Cash flow
-10.4%
Cash-on-Cash Return
3.3%
Cap rate
0.6%
Rent to Value Ratio
Active
$449,888
3
bds
|
3
ba
|
1,842
sqft
|
built
2020
3310 Palindrome Ave, Henderson, NV 89044
$-852
Cash flow
-9.9%
Cash-on-Cash Return
3.4%
Cap rate
0.5%
Rent to Value Ratio
Active
$485,000
3
bds
|
3
ba
|
1,783
sqft
|
built
2021
415 Carsin Wayne Ct, North Las Vegas, NV 89031
$-1,117
Cash flow
-12.0%
Cash-on-Cash Return
2.9%
Cap rate
0.5%
Rent to Value Ratio
Active
$499,999
6
bds
|
3
ba
|
2,072
sqft
|
built
2018
1317 Hopespring Loop Ave, North Las Vegas, NV 89084
$-889
Cash flow
-9.3%
Cash-on-Cash Return
3.5%
Cap rate
0.6%
Rent to Value Ratio
Active
$690,000
3
bds
|
2
ba
|
2,024
sqft
|
built
2018
40 Vicolo Della Luna, Henderson, NV 89011
$-1,725
Cash flow
-13.0%
Cash-on-Cash Return
2.7%
Cap rate
0.5%
Rent to Value Ratio
Active
$329,999
3
bds
|
3
ba
|
1,670
sqft
|
built
2004
6080 Golden Corral Trl, Henderson, NV 89011
$-539
Cash flow
-8.5%
Cash-on-Cash Return
3.7%
Cap rate
0.5%
Rent to Value Ratio
Active
$409,900
3
bds
|
2
ba
|
1,380
sqft
|
built
1964
3258 Glenhurst Dr, Las Vegas, NV 89121
$-765
Cash flow
-9.7%
Cash-on-Cash Return
3.4%
Cap rate
0.4%
Rent to Value Ratio
Active
$599,999
6
bds
|
3
ba
|
2,930
sqft
|
built
1974
3127 Aloha Ave, Las Vegas, NV 89121
$-1,135
Cash flow
-9.9%
Cash-on-Cash Return
3.4%
Cap rate
0.5%
Rent to Value Ratio
Active
$799,000
3
bds
|
3
ba
|
2,653
sqft
|
built
2021
6270 Lamont Hills Ave, Las Vegas, NV 89139
$-2,217
Cash flow
-14.5%
Cash-on-Cash Return
2.3%
Cap rate
0.4%
Rent to Value Ratio
Active
$850,000
10
bds
|
6
ba
|
3,644
sqft
|
built
1989
748 Stagecoach Ave, North Las Vegas, NV 89081
$-1,963
Cash flow
-12.0%
Cash-on-Cash Return
2.9%
Cap rate
0.4%
Rent to Value Ratio
Active
$929,000
9
bds
|
7
ba
|
3,971
sqft
|
built
1978
1695 Westwind Rd, Las Vegas, NV 89146
$-2,221
Cash flow
-12.5%
Cash-on-Cash Return
2.8%
Cap rate
0.4%
Rent to Value Ratio
Active
$454,000
3
bds
|
2
ba
|
2,104
sqft
|
built
1954
107 Elm St, Henderson, NV 89015
$-425
Cash flow
-4.9%
Cash-on-Cash Return
4.6%
Cap rate
0.6%
Rent to Value Ratio
Active
$799,999
4
bds
|
3
ba
|
2,156
sqft
|
built
2023
8934 Cassia Winds St, Las Vegas, NV 89166
$-2,513
Cash flow
-16.4%
Cash-on-Cash Return
1.9%
Cap rate
0.4%
Rent to Value Ratio
Active
$1,199,900
5
bds
|
3
ba
|
4,429
sqft
|
built
2003
10798 Tapestry Winds St, Las Vegas, NV 89141
$-2,448
Cash flow
-10.6%
Cash-on-Cash Return
3.2%
Cap rate
0.5%
Rent to Value Ratio
Active
$530,000
4
bds
|
4
ba
|
2,520
sqft
|
built
2023
4364 Contour Bend Ave, North Las Vegas, NV 89084
$-1,388
Cash flow
-13.7%
Cash-on-Cash Return
2.5%
Cap rate
0.5%
Rent to Value Ratio
Active
$600,000
4
bds
|
3
ba
|
2,027
sqft
|
built
1979
5905 Paseo Montana, Las Vegas, NV 89108
$-1,124
Cash flow
-9.8%
Cash-on-Cash Return
3.4%
Cap rate
0.5%
Rent to Value Ratio
Active
$229,900
2
bds
|
2
ba
|
1,128
sqft
|
built
1988
2451 N Rainbow Blvd, Las Vegas, NV 89108
$-483
Cash flow
-11.0%
Cash-on-Cash Return
3.2%
Cap rate
0.6%
Rent to Value Ratio
Active
$488,000
3
bds
|
3
ba
|
2,198
sqft
|
built
2009
5023 Tunnel Falls Dr, Las Vegas, NV 89141
$-965
Cash flow
-10.3%
Cash-on-Cash Return
3.3%
Cap rate
0.5%
Rent to Value Ratio
Active
$459,000
4
bds
|
3
ba
|
2,379
sqft
|
built
1990
5508 Big Sky Ln, Las Vegas, NV 89149
$-718
Cash flow
-8.2%
Cash-on-Cash Return
3.8%
Cap rate
0.5%
Rent to Value Ratio
Active
$525,000
4
bds
|
3
ba
|
2,805
sqft
|
built
2005
75 Archer Glen Ave, Henderson, NV 89002
$-806
Cash flow
-8.0%
Cash-on-Cash Return
3.8%
Cap rate
0.5%
Rent to Value Ratio
Active
$375,000
3
bds
|
3
ba
|
1,811
sqft
|
built
1986
1209 Shifting Sands Dr, Las Vegas, NV 89108
$-509
Cash flow
-7.1%
Cash-on-Cash Return
4.1%
Cap rate
0.5%
Rent to Value Ratio
Active
$435,000
3
bds
|
2
ba
|
1,894
sqft
|
built
2004
8916 El Diablo St, Las Vegas, NV 89131
$-991
Cash flow
-11.9%
Cash-on-Cash Return
2.9%
Cap rate
0.5%
Rent to Value Ratio