Oklahoma City, OK Investment Properties for Sale
Browse homes for sale and investment properties in Oklahoma City, OK. Refine your search by price, property type, or more.
Best cash flowing properties in Oklahoma City, OK
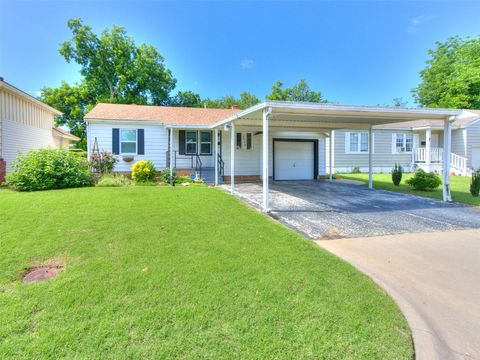
Active
$169,000
2
bds
|
1
ba
|
0
sqft
|
built
1948
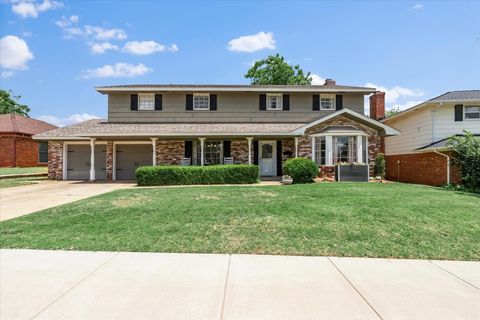
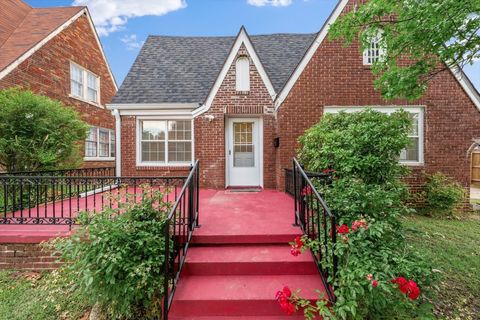
3208 NW 34th St, Oklahoma City, OK 73112
$180
Cash flow
5.6%
Cash-on-Cash Return
7.0%
Cap rate
0.9%
Rent to Value Ratio

Active
$115,000
3
bds
|
1
ba
|
0
sqft
|
built
1962
4209 NE 16th St, Oklahoma City, OK 73117
$110
Cash flow
5.0%
Cash-on-Cash Return
6.8%
Cap rate
1.0%
Rent to Value Ratio
954 out of 1,268 properties for sale in Oklahoma City, OK
Limited Results Shown
Create a free account, or log in to reveal all property listings and enjoy the complete experience.
Active
$600,000
3
bds
|
2
ba
|
0
sqft
|
built
1928
707 NE 18th St, Oklahoma City, OK 73105
$-1,634
Cash flow
-14.2%
Cash-on-Cash Return
2.4%
Cap rate
0.4%
Rent to Value Ratio

Active
$179,000
4
bds
|
2
ba
|
0
sqft
|
built
1965
6217 S Drexel Ave, Oklahoma City, OK 73159
$20
Cash flow
0.6%
Cash-on-Cash Return
5.8%
Cap rate
0.8%
Rent to Value Ratio

Active
$495,000
3
bds
|
3
ba
|
0
sqft
|
built
2022
1721 Oso Ave, Oklahoma City, OK 73108
$-1,466
Cash flow
-15.5%
Cash-on-Cash Return
2.1%
Cap rate
0.4%
Rent to Value Ratio
Active
$269,000
4
bds
|
3
ba
|
0
sqft
|
built
1977
5201 SE 53rd St, Oklahoma City, OK 73135
$-250
Cash flow
-4.8%
Cash-on-Cash Return
4.6%
Cap rate
0.7%
Rent to Value Ratio

Active
$360,000
3
bds
|
2
ba
|
0
sqft
|
built
1923
1408 NW 22nd St, Oklahoma City, OK 73106
$-606
Cash flow
-8.8%
Cash-on-Cash Return
3.7%
Cap rate
0.5%
Rent to Value Ratio

Active
$269,000
3
bds
|
2
ba
|
0
sqft
|
built
2017
8721 SW 39th St, Oklahoma City, OK 73179
$-292
Cash flow
-5.7%
Cash-on-Cash Return
4.4%
Cap rate
0.7%
Rent to Value Ratio

Active
$264,900
3
bds
|
2
ba
|
0
sqft
|
built
1941
1212 NW 48th St, Oklahoma City, OK 73118
$-306
Cash flow
-6.0%
Cash-on-Cash Return
4.3%
Cap rate
0.5%
Rent to Value Ratio

Active
$220,000
3
bds
|
2
ba
|
0
sqft
|
built
1951
3208 N Roff Ave, Oklahoma City, OK 73112
$-301
Cash flow
-7.1%
Cash-on-Cash Return
4.0%
Cap rate
0.5%
Rent to Value Ratio
Active
$330,000
3
bds
|
3
ba
|
0
sqft
|
built
2017
1305 NE 6th St, Oklahoma City, OK 73117
$-772
Cash flow
-12.2%
Cash-on-Cash Return
2.9%
Cap rate
0.5%
Rent to Value Ratio

Active
$160,333
3
bds
|
1
ba
|
0
sqft
|
built
1961
3333 SW 50th St, Oklahoma City, OK 73119
$-13
Cash flow
-0.4%
Cash-on-Cash Return
5.6%
Cap rate
0.7%
Rent to Value Ratio

Active
$330,000
3
bds
|
3
ba
|
0
sqft
|
built
2022
1313 NE 6th St, Oklahoma City, OK 73117
$-874
Cash flow
-13.8%
Cash-on-Cash Return
2.5%
Cap rate
0.4%
Rent to Value Ratio

Active
$250,000
3
bds
|
2
ba
|
0
sqft
|
built
2001
4921 SE 87th Ter, Oklahoma City, OK 73135
$-297
Cash flow
-6.2%
Cash-on-Cash Return
4.3%
Cap rate
0.6%
Rent to Value Ratio

Active
$499,000
4
bds
|
3
ba
|
0
sqft
|
built
1921
1616 NW 15th St, Oklahoma City, OK 73106
$-613
Cash flow
-6.4%
Cash-on-Cash Return
4.2%
Cap rate
0.6%
Rent to Value Ratio

Active
$289,000
3
bds
|
2
ba
|
0
sqft
|
built
1982
11921 Shady Trail Ln, Oklahoma City, OK 73120
$-461
Cash flow
-8.3%
Cash-on-Cash Return
3.8%
Cap rate
0.6%
Rent to Value Ratio

Active
$90,000
2
bds
|
2
ba
|
0
sqft
|
built
1979
846 Two Forty Pl, Oklahoma City, OK 73139
$27
Cash flow
1.6%
Cash-on-Cash Return
6.0%
Cap rate
1.6%
Rent to Value Ratio

Active
$320,000
4
bds
|
2
ba
|
0
sqft
|
built
1969
5108 NW 19th Ter, Oklahoma City, OK 73127
$-501
Cash flow
-8.2%
Cash-on-Cash Return
3.8%
Cap rate
0.6%
Rent to Value Ratio

Active
$539,000
3
bds
|
3
ba
|
0
sqft
|
built
2021
8416 NW 130th St, Oklahoma City, OK 73142
$-868
Cash flow
-8.4%
Cash-on-Cash Return
3.7%
Cap rate
0.5%
Rent to Value Ratio

Active
$249,000
3
bds
|
2
ba
|
0
sqft
|
built
1950
2901 Pine Ave, Oklahoma City, OK 73128
$-259
Cash flow
-5.4%
Cash-on-Cash Return
4.4%
Cap rate
0.6%
Rent to Value Ratio

Active
$965,000
3
bds
|
3
ba
|
0
sqft
|
built
2023
1904 Oso Ave, Oklahoma City, OK 73108
$-1,895
Cash flow
-10.2%
Cash-on-Cash Return
3.3%
Cap rate
0.6%
Rent to Value Ratio

Active
$204,900
2
bds
|
1
ba
|
0
sqft
|
built
1924
1604 NW 13th St, Oklahoma City, OK 73106
$-236
Cash flow
-6.0%
Cash-on-Cash Return
4.3%
Cap rate
0.5%
Rent to Value Ratio

Active
$524,900
5
bds
|
4
ba
|
0
sqft
|
built
1998
13024 Green Cedar Ter, Oklahoma City, OK 73131
$-1,014
Cash flow
-10.1%
Cash-on-Cash Return
3.4%
Cap rate
0.5%
Rent to Value Ratio
Active
$165,000
2
bds
|
1
ba
|
0
sqft
|
built
1933
327 SW Grand Blvd, Oklahoma City, OK 73109
$-84
Cash flow
-2.7%
Cash-on-Cash Return
5.1%
Cap rate
0.7%
Rent to Value Ratio

Active
$189,900
3
bds
|
2
ba
|
0
sqft
|
built
1964
2617 SW 69th St, Oklahoma City, OK 73159
$-235
Cash flow
-6.5%
Cash-on-Cash Return
4.2%
Cap rate
0.6%
Rent to Value Ratio

Active
$240,000
2
bds
|
1
ba
|
0
sqft
|
built
1920
1828 NW 38th St, Oklahoma City, OK 73118
$-362
Cash flow
-7.9%
Cash-on-Cash Return
3.9%
Cap rate
0.6%
Rent to Value Ratio

Active
$369,999
4
bds
|
3
ba
|
0
sqft
|
built
2019
13913 Pasaro Trl, Oklahoma City, OK 73170
$-587
Cash flow
-8.3%
Cash-on-Cash Return
3.8%
Cap rate
0.6%
Rent to Value Ratio
Active
$130,000
2
bds
|
1
ba
|
0
sqft
|
built
1949
1521 SW 45th St, Oklahoma City, OK 73119
$14
Cash flow
0.6%
Cash-on-Cash Return
5.8%
Cap rate
0.8%
Rent to Value Ratio

Active
$172,000
3
bds
|
1
ba
|
0
sqft
|
built
1949
724 SW 48th St, Oklahoma City, OK 73109
$-48
Cash flow
-1.5%
Cash-on-Cash Return
5.3%
Cap rate
0.7%
Rent to Value Ratio

Active
$650,000
3
bds
|
3
ba
|
0
sqft
|
built
1920
1218 NW 19th St, Oklahoma City, OK 73106
$-953
Cash flow
-7.6%
Cash-on-Cash Return
3.9%
Cap rate
0.6%
Rent to Value Ratio
Active
$220,000
3
bds
|
2
ba
|
0
sqft
|
built
2014
5805 Marblewood Dr, Oklahoma City, OK 73179
$-202
Cash flow
-4.8%
Cash-on-Cash Return
4.6%
Cap rate
0.7%
Rent to Value Ratio

Active
$249,900
3
bds
|
2
ba
|
0
sqft
|
built
1958
4328 NW 12th St, Oklahoma City, OK 73107
$-303
Cash flow
-6.3%
Cash-on-Cash Return
4.2%
Cap rate
0.6%
Rent to Value Ratio

Active
$198,000
3
bds
|
3
ba
|
0
sqft
|
built
1941
1117 SW 37th St, Oklahoma City, OK 73109
$-45
Cash flow
-1.2%
Cash-on-Cash Return
5.4%
Cap rate
0.8%
Rent to Value Ratio
Active
$229,000
3
bds
|
2
ba
|
0
sqft
|
built
1960
2117 SW 76th St, Oklahoma City, OK 73159
$-239
Cash flow
-5.4%
Cash-on-Cash Return
4.4%
Cap rate
0.6%
Rent to Value Ratio
Active
$327,808
5
bds
|
3
ba
|
0
sqft
|
built
1968
11604 N Victoria Dr, Oklahoma City, OK 73120
$-408
Cash flow
-6.5%
Cash-on-Cash Return
4.2%
Cap rate
0.6%
Rent to Value Ratio
Active
$1,650,000
4
bds
|
6
ba
|
0
sqft
|
built
2006
14908 Aurea Ln, Oklahoma City, OK 73142
$-7,662
Cash flow
-24.2%
Cash-on-Cash Return
0.1%
Cap rate
0.2%
Rent to Value Ratio

Active
$475,000
3
bds
|
2
ba
|
0
sqft
|
built
1928
2113 N Gatewood Ave, Oklahoma City, OK 73106
$-327
Cash flow
-3.6%
Cash-on-Cash Return
4.9%
Cap rate
0.7%
Rent to Value Ratio
Active
$280,000
3
bds
|
2
ba
|
0
sqft
|
built
1928
905 NE 21st St, Oklahoma City, OK 73105
$-252
Cash flow
-4.7%
Cash-on-Cash Return
4.6%
Cap rate
0.6%
Rent to Value Ratio

Active
$155,000
3
bds
|
2
ba
|
0
sqft
|
built
1979
6414 Galaxie Ter, Oklahoma City, OK 73132
$-278
Cash flow
-9.4%
Cash-on-Cash Return
3.5%
Cap rate
0.8%
Rent to Value Ratio
Active
$214,900
3
bds
|
2
ba
|
0
sqft
|
built
1962
5704 N Warren Ave, Oklahoma City, OK 73112
$-131
Cash flow
-3.2%
Cash-on-Cash Return
4.9%
Cap rate
0.7%
Rent to Value Ratio