Dallas County Investment Properties for Sale
Browse homes for sale and investment properties in Dallas County. Refine your search by price, property type, or more.
Best cash flowing properties in Dallas County
Active
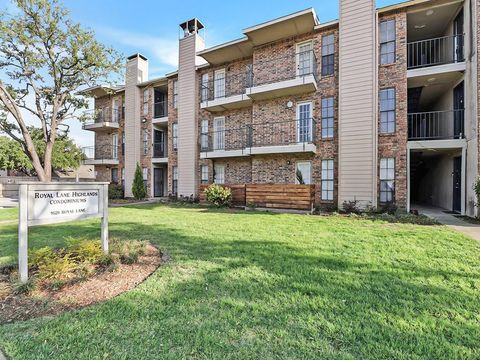
$65,000
1
bds
|
1
ba
|
592
sqft
|
built
1983
9520 Royal Ln, Dallas, TX 75243
$450
Cash flow
8.1%
Cash-on-Cash Return
8.3%
Cap rate
1.7%
Rent to Value Ratio
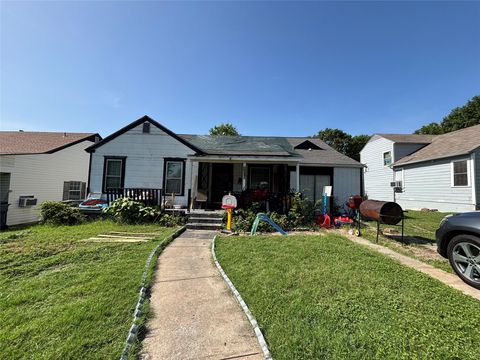
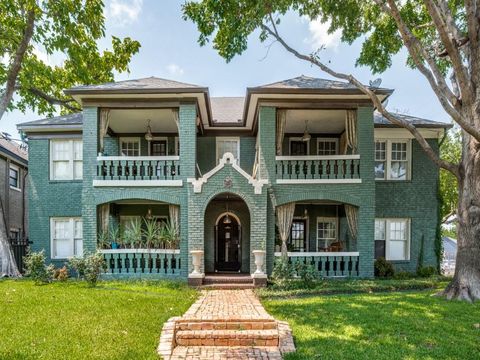
Active
$140,000
2
bds
|
1
ba
|
1,204
sqft
|
built
1941
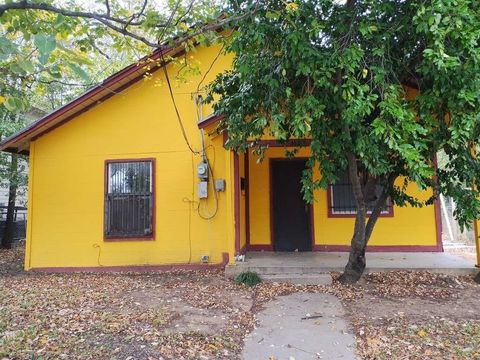
3520 Culver St, Dallas, TX 75223
$422
Cash flow
15.7%
Cash-on-Cash Return
9.3%
Cap rate
1.4%
Rent to Value Ratio
43 out of 4,044 properties for sale in Dallas County
Limited Results Shown
Create a free account, or log in to reveal all property listings and enjoy the complete experience.
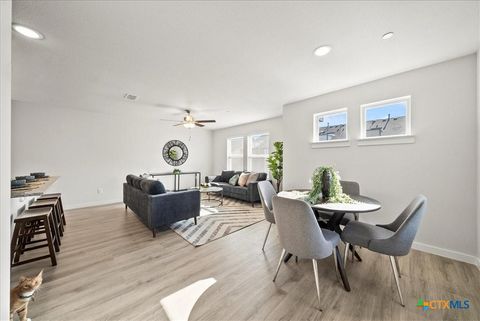
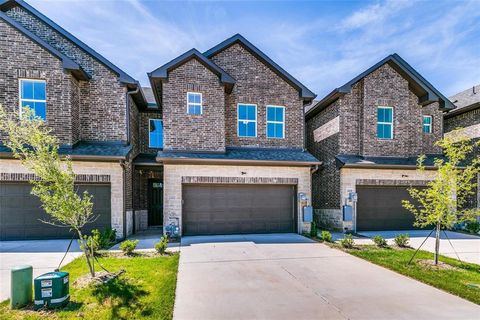
Active
$339,000
2
bds
|
2
ba
|
1,530
sqft
|
built
2023
3039 Tenor Way, Sachse, TX 75048
$-148
Cash flow
-2.3%
Cash-on-Cash Return
5.2%
Cap rate
0.7%
Rent to Value Ratio
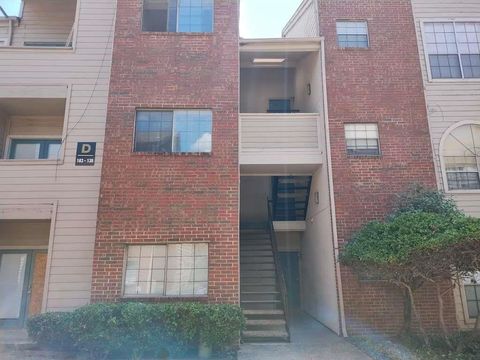
Active
$92,149
1
bds
|
1
ba
|
573
sqft
|
built
1982
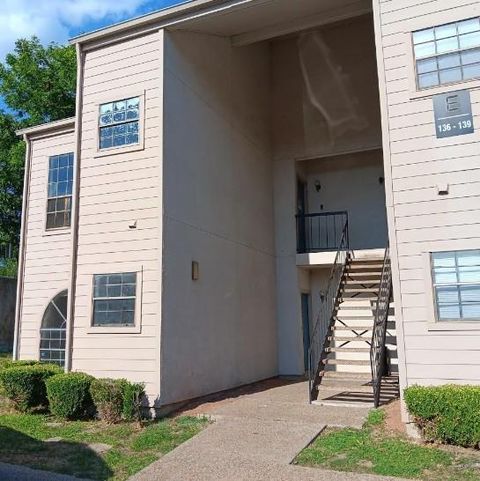
9747 Whitehurst Dr, Dallas, TX 75243
$112
Cash flow
6.3%
Cash-on-Cash Return
7.1%
Cap rate
1.1%
Rent to Value Ratio

Active
$3,190,000
9
bds
|
11
ba
|
10,198
sqft
|
built
2024
4206 Cabell Dr, Dallas, TX 75204
$-11,163
Cash flow
-18.3%
Cash-on-Cash Return
1.5%
Cap rate
0.2%
Rent to Value Ratio
Active
$3,050,000
5
bds
|
6
ba
|
5,404
sqft
|
built
2024
7538 Centenary Ave, Dallas, TX 75225
$-12,924
Cash flow
-22.1%
Cash-on-Cash Return
0.6%
Cap rate
0.2%
Rent to Value Ratio
Active
$649,000
4
bds
|
4
ba
|
2,414
sqft
|
built
2025
3102 Chicago St, Dallas, TX 75212
$-1,463
Cash flow
-11.8%
Cash-on-Cash Return
3.0%
Cap rate
0.6%
Rent to Value Ratio

Active
$510,000
4
bds
|
3
ba
|
2,261
sqft
|
built
2025
3708 Mc Broom St, Dallas, TX 75212
$-1,367
Cash flow
-14.0%
Cash-on-Cash Return
2.5%
Cap rate
0.4%
Rent to Value Ratio
Active
$555,000
5
bds
|
5
ba
|
1,908
sqft
|
built
2021
1901 Avenue E, Grand Prairie, TX 75051
$-832
Cash flow
-7.8%
Cash-on-Cash Return
3.9%
Cap rate
0.5%
Rent to Value Ratio
Active
$1,150,000
4
bds
|
6
ba
|
4,532
sqft
|
built
2022
1607 Pebble Beach Ln, Cedar Hill, TX 75104
$-2,104
Cash flow
-9.5%
Cash-on-Cash Return
3.5%
Cap rate
0.6%
Rent to Value Ratio
Active
$2,099,000
6
bds
|
7
ba
|
5,616
sqft
|
built
1955
11207 Dwarfs Cir, Dallas, TX 75229
$-9,074
Cash flow
-22.6%
Cash-on-Cash Return
0.5%
Cap rate
0.2%
Rent to Value Ratio
Active
$282,500
3
bds
|
2
ba
|
1,821
sqft
|
built
1986
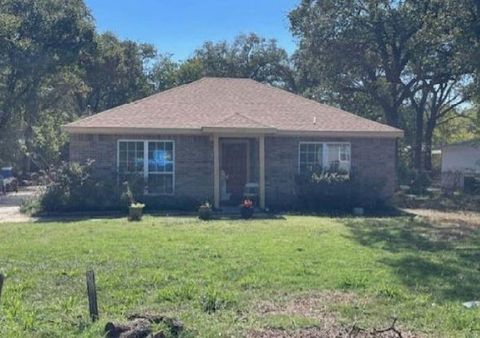
302 Mesa Wood Dr, Glenn Heights, TX 75154
$43
Cash flow
0.8%
Cash-on-Cash Return
5.9%
Cap rate
0.7%
Rent to Value Ratio
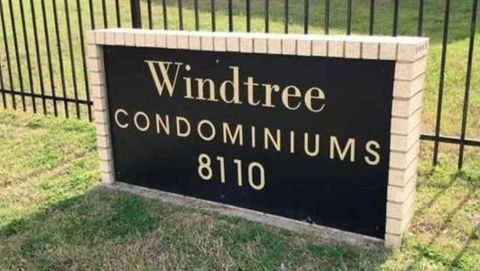
Active
$69,500
1
bds
|
1
ba
|
569
sqft
|
built
1980
8110 Skillman St, Dallas, TX 75231
$218
Cash flow
3.7%
Cash-on-Cash Return
3.8%
Cap rate
1.4%
Rent to Value Ratio
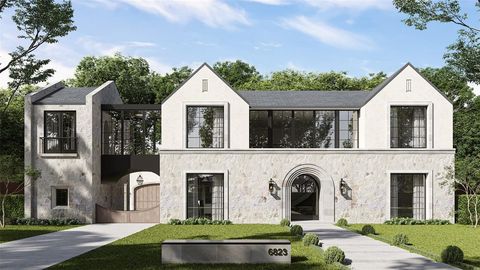
Active
$4,999,000
5
bds
|
7
ba
|
6,341
sqft
|
built
2025
6823 Norway Rd, Dallas, TX 75230
$-20,779
Cash flow
-21.7%
Cash-on-Cash Return
0.7%
Cap rate
0.1%
Rent to Value Ratio
Active
$240,000
1
bds
|
1
ba
|
991
sqft
|
built
1925
1122 Jackson St, Dallas, TX 75202
$-752
Cash flow
-16.3%
Cash-on-Cash Return
1.9%
Cap rate
0.8%
Rent to Value Ratio
Active
$2,199,000
4
bds
|
5
ba
|
4,393
sqft
|
built
2023
7702 Chatsworth Pl, Dallas, TX 75230
$-3,121
Cash flow
-7.4%
Cash-on-Cash Return
4.0%
Cap rate
0.5%
Rent to Value Ratio
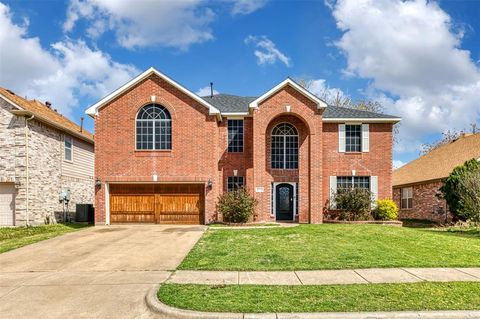
Active
$349,900
4
bds
|
3
ba
|
1,951
sqft
|
built
2005
3500 Roberts Ave, Dallas, TX 75215
$-188
Cash flow
-2.8%
Cash-on-Cash Return
5.0%
Cap rate
0.8%
Rent to Value Ratio
Active
$11,449,000
8
bds
|
10
ba
|
13,739
sqft
|
built
2019
2449 Mountain View Ct, Cedar Hill, TX 75104
$-57,158
Cash flow
-26.0%
Cash-on-Cash Return
-0.3%
Cap rate
0.1%
Rent to Value Ratio
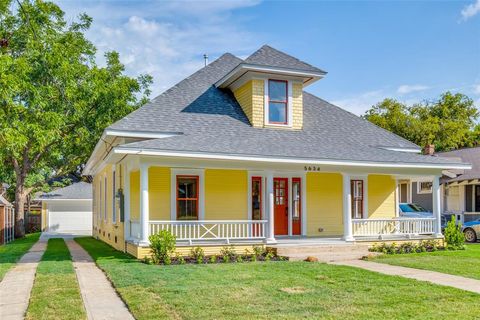
Active
$795,000
4
bds
|
4
ba
|
2,687
sqft
|
built
1910
5634 Tremont St, Dallas, TX 75214
$-2,465
Cash flow
-16.2%
Cash-on-Cash Return
2.0%
Cap rate
0.4%
Rent to Value Ratio
Active
$1,895,000
5
bds
|
6
ba
|
4,790
sqft
|
built
2025
5836 Kenwood Ave, Dallas, TX 75206
$-6,484
Cash flow
-17.9%
Cash-on-Cash Return
1.6%
Cap rate
0.2%
Rent to Value Ratio

Active
$399,000
4
bds
|
3
ba
|
2,018
sqft
|
built
2025
2818 Southland St, Dallas, TX 75215
$-1,198
Cash flow
-15.7%
Cash-on-Cash Return
2.1%
Cap rate
0.3%
Rent to Value Ratio
Active
$549,000
3
bds
|
5
ba
|
2,444
sqft
|
built
2016
1323 Arch Pl, Dallas, TX 75215
$-1,390
Cash flow
-13.2%
Cash-on-Cash Return
2.6%
Cap rate
0.6%
Rent to Value Ratio
Active
$550,000
5
bds
|
3
ba
|
2,795
sqft
|
built
1965
13460 Mill Grove Ln, Dallas, TX 75240
$-1,285
Cash flow
-12.2%
Cash-on-Cash Return
2.9%
Cap rate
0.6%
Rent to Value Ratio
Active
$87,149
1
bds
|
1
ba
|
573
sqft
|
built
1982
9747 Whitehurst Dr, Dallas, TX 75243
$136
Cash flow
8.1%
Cash-on-Cash Return
7.5%
Cap rate
1.1%
Rent to Value Ratio
Active
$149,499
1
bds
|
1
ba
|
576
sqft
|
built
1920
4103 Jamaica St, Dallas, TX 75210
$-117
Cash flow
-4.1%
Cash-on-Cash Return
4.7%
Cap rate
0.7%
Rent to Value Ratio
Active
$1,674,900
4
bds
|
5
ba
|
4,126
sqft
|
built
2025
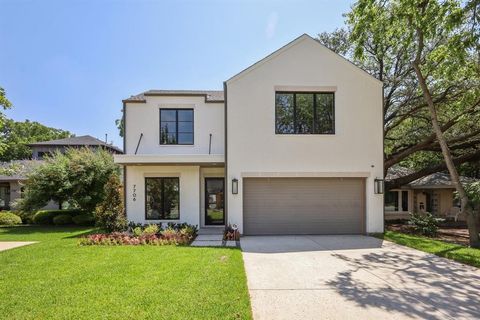
7706 Robin Rd, Dallas, TX 75209
$-7,357
Cash flow
-22.9%
Cash-on-Cash Return
0.4%
Cap rate
0.1%
Rent to Value Ratio
Active
$530,000
4
bds
|
3
ba
|
2,224
sqft
|
built
1964
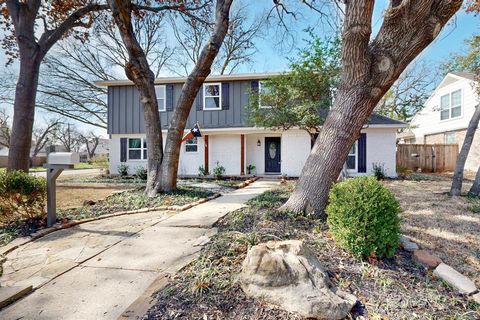
506 S Cottonwood Dr, Richardson, TX 75080
$-841
Cash flow
-8.3%
Cash-on-Cash Return
3.8%
Cap rate
0.7%
Rent to Value Ratio
Active
$1,295,000
bds
|
0
ba
|
0
sqft
|
built
1916
4425 Swiss Ave, Dallas, TX 75204
$-7,606
Cash flow
-30.6%
Cash-on-Cash Return
-1.4%
Cap rate
0.1%
Rent to Value Ratio

Active
$3,600,000
3
bds
|
5
ba
|
5,400
sqft
|
built
2018
2210 Boll St, Dallas, TX 75204
$-11,585
Cash flow
-16.8%
Cash-on-Cash Return
1.8%
Cap rate
0.2%
Rent to Value Ratio

Active
$1,649,999
4
bds
|
5
ba
|
5,141
sqft
|
built
2025
3306 Northaven Rd, Dallas, TX 75229
$-6,314
Cash flow
-20.0%
Cash-on-Cash Return
1.1%
Cap rate
0.2%
Rent to Value Ratio
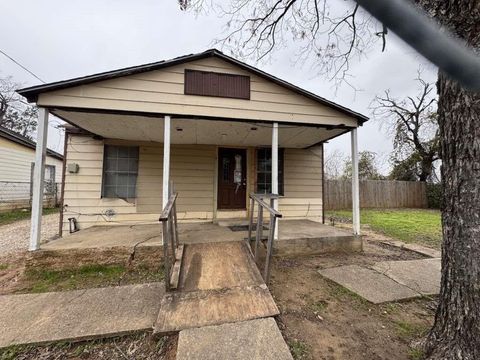
Active
$284,999
3
bds
|
1
ba
|
896
sqft
|
built
1948
3355 Brantley St, Dallas, TX 75212
$-553
Cash flow
-10.1%
Cash-on-Cash Return
3.4%
Cap rate
0.7%
Rent to Value Ratio
Active
$599,999
5
bds
|
4
ba
|
5,054
sqft
|
built
2002
5112 Showdown Ln, Grand Prairie, TX 75052
$-1,020
Cash flow
-8.9%
Cash-on-Cash Return
3.6%
Cap rate
0.7%
Rent to Value Ratio
Active
$339,950
3
bds
|
3
ba
|
1,671
sqft
|
built
2021
2418 Ash Ln, Sachse, TX 75048
$-835
Cash flow
-12.8%
Cash-on-Cash Return
2.7%
Cap rate
0.7%
Rent to Value Ratio
Active
$156,000
3
bds
|
2
ba
|
1,003
sqft
|
built
2008
11542 Elam Cir, Balch Springs, TX 75180
$-14
Cash flow
-0.5%
Cash-on-Cash Return
5.6%
Cap rate
1.0%
Rent to Value Ratio
Active
$460,000
5
bds
|
3
ba
|
2,651
sqft
|
built
1978
1814 Westshore Dr, Garland, TX 75043
$-845
Cash flow
-9.6%
Cash-on-Cash Return
3.5%
Cap rate
0.7%
Rent to Value Ratio

Active
$167,500
2
bds
|
1
ba
|
836
sqft
|
built
1982
5300 Keller Springs Rd, Dallas, TX 75248
$-479
Cash flow
-14.9%
Cash-on-Cash Return
2.2%
Cap rate
0.8%
Rent to Value Ratio
Active
$1,210,000
5
bds
|
5
ba
|
4,552
sqft
|
built
2024
477 Infinito Dr, Sunnyvale, TX 75182
$-1,981
Cash flow
-8.5%
Cash-on-Cash Return
3.7%
Cap rate
0.5%
Rent to Value Ratio
Active
$225,000
2
bds
|
2
ba
|
1,143
sqft
|
built
1985
10244 Ridge Oak St, Dallas, TX 75227
$-302
Cash flow
-7.0%
Cash-on-Cash Return
4.1%
Cap rate
0.7%
Rent to Value Ratio
Active
$1,349,000
5
bds
|
4
ba
|
3,388
sqft
|
built
1982
9603 Greensprint Dr, Dallas, TX 75238
$-3,555
Cash flow
-13.7%
Cash-on-Cash Return
2.5%
Cap rate
0.3%
Rent to Value Ratio
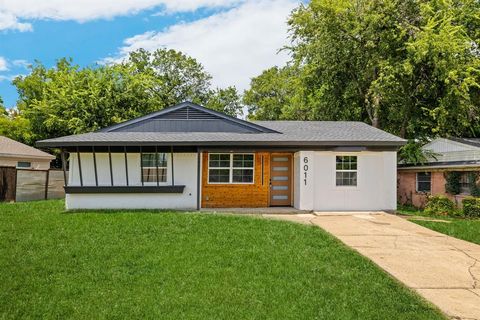
Active
$229,900
4
bds
|
2
ba
|
1,300
sqft
|
built
1961
6011 Park Manor Dr, Dallas, TX 75241
$-232
Cash flow
-5.3%
Cash-on-Cash Return
4.5%
Cap rate
0.8%
Rent to Value Ratio