Fort Bend County Investment Properties for Sale
Browse homes for sale and investment properties in Fort Bend County. Refine your search by price, property type, or more.
Best cash flowing properties in Fort Bend County

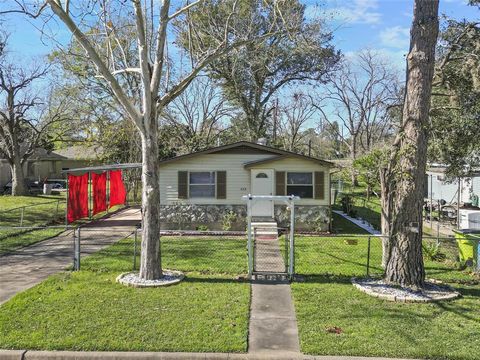
Active
$203,500
3
bds
|
1
ba
|
990
sqft
|
built
1963
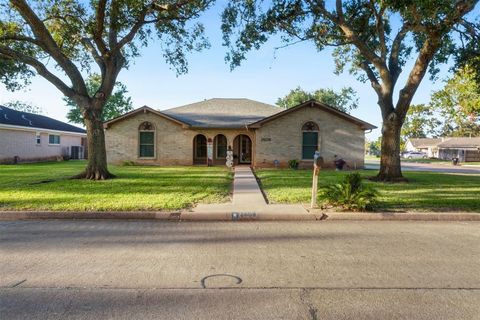
106 Avenue G, Sugar Land, TX 77498
$417
Cash flow
10.7%
Cash-on-Cash Return
8.1%
Cap rate
1.0%
Rent to Value Ratio
Active
$175,000
4
bds
|
2
ba
|
1,343
sqft
|
built
1995
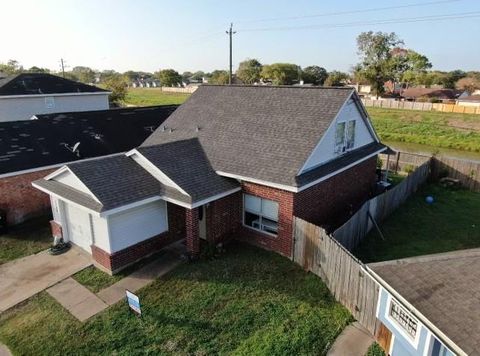
7704 Sign St, Missouri City, TX 77489
$-39
Cash flow
-1.2%
Cash-on-Cash Return
5.4%
Cap rate
0.9%
Rent to Value Ratio
1,455 out of 1,528 properties for sale in Fort Bend County
Limited Results Shown
Create a free account, or log in to reveal all property listings and enjoy the complete experience.
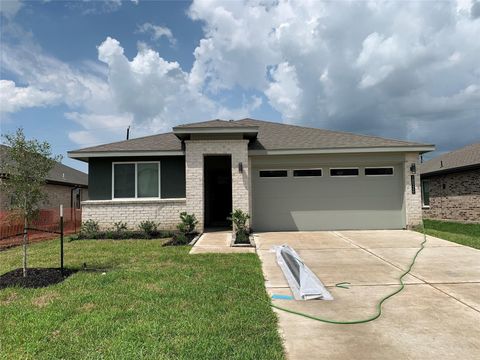
Active
$925,000
4
bds
|
4
ba
|
6,945
sqft
|
built
2011
3811 Westerdale Dr, Fulshear, TX 77441
$-1,752
Cash flow
-9.9%
Cash-on-Cash Return
3.4%
Cap rate
0.7%
Rent to Value Ratio
Active
$299,900
3
bds
|
2
ba
|
1,930
sqft
|
built
1978
2609 Parrott Ave, Rosenberg, TX 77471
$-72
Cash flow
-1.3%
Cash-on-Cash Return
5.4%
Cap rate
0.8%
Rent to Value Ratio
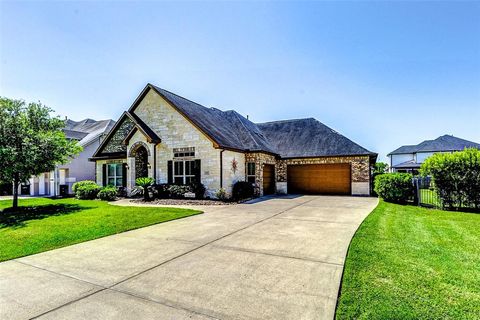
Active
$995,000
5
bds
|
5
ba
|
4,687
sqft
|
built
2000
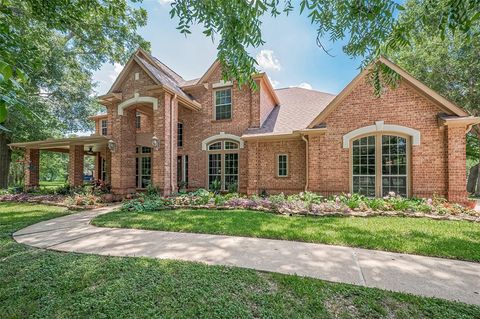
7114 N Bridlewood Ct, Richmond, TX 77469
$-2,628
Cash flow
-13.8%
Cash-on-Cash Return
2.5%
Cap rate
0.4%
Rent to Value Ratio

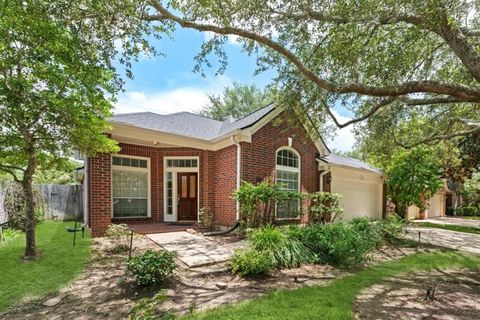
Active
$375,000
3
bds
|
3
ba
|
2,304
sqft
|
built
2001
7218 Welshwood Ln, Sugar Land, TX 77479
$-737
Cash flow
-10.3%
Cash-on-Cash Return
3.3%
Cap rate
0.7%
Rent to Value Ratio

Active
$450,000
4
bds
|
4
ba
|
3,289
sqft
|
built
2011
21702 Masonwood Ln, Richmond, TX 77469
$-1,286
Cash flow
-14.9%
Cash-on-Cash Return
2.3%
Cap rate
0.6%
Rent to Value Ratio
Active
$735,000
4
bds
|
4
ba
|
4,371
sqft
|
built
1988
32810 Waltham Xing, Fulshear, TX 77441
$-1,152
Cash flow
-8.2%
Cash-on-Cash Return
3.8%
Cap rate
0.7%
Rent to Value Ratio
Active
$490,000
4
bds
|
3
ba
|
2,879
sqft
|
built
2011
17315 Fechser Ln, Richmond, TX 77407
$-1,287
Cash flow
-13.7%
Cash-on-Cash Return
2.5%
Cap rate
0.6%
Rent to Value Ratio

Active
$515,000
5
bds
|
3
ba
|
3,682
sqft
|
built
2000
11327 Ashford Pt, Sugar Land, TX 77478
$-1,172
Cash flow
-11.9%
Cash-on-Cash Return
2.9%
Cap rate
0.5%
Rent to Value Ratio
Active
$395,000
3
bds
|
3
ba
|
3,128
sqft
|
built
2001
5714 Ames Xing, Sugar Land, TX 77479
$-716
Cash flow
-9.5%
Cash-on-Cash Return
3.5%
Cap rate
0.7%
Rent to Value Ratio
Active
$565,000
4
bds
|
4
ba
|
3,241
sqft
|
built
2023
31207 Hastings Creek Ln, Fulshear, TX 77441
$-1,243
Cash flow
-11.5%
Cash-on-Cash Return
3.0%
Cap rate
0.7%
Rent to Value Ratio
Active
$350,000
3
bds
|
2
ba
|
1,996
sqft
|
built
2022
3612 Richmont Ct, Rosenberg, TX 77469
$-726
Cash flow
-10.8%
Cash-on-Cash Return
3.2%
Cap rate
0.7%
Rent to Value Ratio
Active
$475,000
5
bds
|
4
ba
|
2,758
sqft
|
built
2023
31415 Beacon Cove Trl, Fulshear, TX 77441
$-222
Cash flow
-2.4%
Cash-on-Cash Return
5.1%
Cap rate
0.7%
Rent to Value Ratio

Active
$450,000
4
bds
|
3
ba
|
2,778
sqft
|
built
2007
2401 Harbor Chase Dr, Pearland, TX 77584
$-915
Cash flow
-10.6%
Cash-on-Cash Return
3.2%
Cap rate
0.7%
Rent to Value Ratio

Active
$604,000
5
bds
|
4
ba
|
3,253
sqft
|
built
2004
7206 Fiesta Flower, Katy, TX 77494
$-1,296
Cash flow
-11.2%
Cash-on-Cash Return
3.1%
Cap rate
0.6%
Rent to Value Ratio
Active
$480,000
5
bds
|
5
ba
|
3,491
sqft
|
built
2010
26914 Harmony Shores Dr, Katy, TX 77494
$-981
Cash flow
-10.7%
Cash-on-Cash Return
3.2%
Cap rate
0.6%
Rent to Value Ratio
Active
$325,800
4
bds
|
3
ba
|
2,473
sqft
|
built
1995
17823 Scenic Oaks Dr, Richmond, TX 77407
$-388
Cash flow
-6.2%
Cash-on-Cash Return
4.3%
Cap rate
0.8%
Rent to Value Ratio

Active
$350,000
5
bds
|
3
ba
|
2,734
sqft
|
built
2019
1219 Governor Dr, Rosenberg, TX 77469
$-706
Cash flow
-10.5%
Cash-on-Cash Return
3.3%
Cap rate
0.7%
Rent to Value Ratio
Active
$329,900
3
bds
|
2
ba
|
1,780
sqft
|
built
2016
18950 Barrington Grove Trce, Richmond, TX 77407
$-122
Cash flow
-1.9%
Cash-on-Cash Return
5.2%
Cap rate
0.7%
Rent to Value Ratio
Active
$439,900
4
bds
|
3
ba
|
2,888
sqft
|
built
2018
8614 Oakdale Bluff Ct, Richmond, TX 77407
$-753
Cash flow
-8.9%
Cash-on-Cash Return
3.6%
Cap rate
0.7%
Rent to Value Ratio

Active
$1,188,000
7
bds
|
8
ba
|
6,076
sqft
|
built
2019
26407 Katy Springs Ln, Katy, TX 77494
$-3,728
Cash flow
-16.4%
Cash-on-Cash Return
1.9%
Cap rate
0.5%
Rent to Value Ratio
Active
$300,000
4
bds
|
2
ba
|
1,833
sqft
|
built
2019
8207 Amaryllis Ct, Rosharon, TX 77583
$-606
Cash flow
-10.5%
Cash-on-Cash Return
3.3%
Cap rate
0.7%
Rent to Value Ratio

Active
$425,900
4
bds
|
3
ba
|
2,784
sqft
|
built
2019
1318 Bellingham Park Dr, Missouri City, TX 77459
$-1,075
Cash flow
-13.2%
Cash-on-Cash Return
2.6%
Cap rate
0.7%
Rent to Value Ratio
Active
$565,000
4
bds
|
3
ba
|
2,629
sqft
|
built
2021
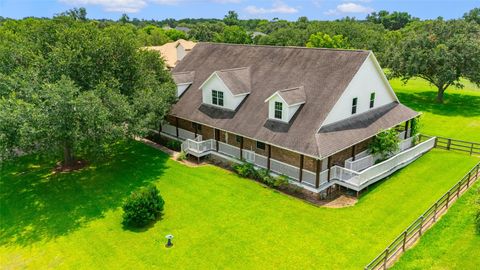
11215 Fannin Trail Ct, Needville, TX 77461
$-1,311
Cash flow
-12.1%
Cash-on-Cash Return
2.9%
Cap rate
0.6%
Rent to Value Ratio

Active
$473,000
4
bds
|
3
ba
|
2,562
sqft
|
built
2020
28403 Hannahs Harbor Ln, Katy, TX 77494
$-1,405
Cash flow
-15.5%
Cash-on-Cash Return
2.1%
Cap rate
0.6%
Rent to Value Ratio
Active
$336,000
4
bds
|
3
ba
|
1,903
sqft
|
built
2021
18926 Wedgewood Meadow Way, Richmond, TX 77407
$-740
Cash flow
-11.5%
Cash-on-Cash Return
3.0%
Cap rate
0.7%
Rent to Value Ratio

Active
$460,000
4
bds
|
3
ba
|
2,717
sqft
|
built
1999
5506 Poundstone Ct, Sugar Land, TX 77479
$-897
Cash flow
-10.2%
Cash-on-Cash Return
3.3%
Cap rate
0.7%
Rent to Value Ratio

Active
$599,990
5
bds
|
5
ba
|
3,976
sqft
|
built
2003
2102 Ivy Cv, Katy, TX 77494
$-1,115
Cash flow
-9.7%
Cash-on-Cash Return
3.4%
Cap rate
0.7%
Rent to Value Ratio

Active
$390,000
4
bds
|
3
ba
|
2,547
sqft
|
built
2006
11002 Leah Elizabeth Dr, Needville, TX 77461
$-494
Cash flow
-6.6%
Cash-on-Cash Return
4.2%
Cap rate
0.7%
Rent to Value Ratio
Active
$875,000
4
bds
|
4
ba
|
3,835
sqft
|
built
2015
32811 Warbler Ct, Fulshear, TX 77441
$-2,425
Cash flow
-14.5%
Cash-on-Cash Return
2.4%
Cap rate
0.5%
Rent to Value Ratio

Active
$372,500
4
bds
|
3
ba
|
2,562
sqft
|
built
2015
3822 Daintree Park Dr, Katy, TX 77494
$-708
Cash flow
-9.9%
Cash-on-Cash Return
3.4%
Cap rate
0.8%
Rent to Value Ratio

Active
$364,990
4
bds
|
3
ba
|
2,008
sqft
|
built
2017
1946 Mayweather Ln, Richmond, TX 77406
$-809
Cash flow
-11.6%
Cash-on-Cash Return
3.0%
Cap rate
0.6%
Rent to Value Ratio

Active
$549,000
4
bds
|
4
ba
|
3,582
sqft
|
built
2009
17022 Huttons Court Ln, Richmond, TX 77407
$-540
Cash flow
-5.1%
Cash-on-Cash Return
4.5%
Cap rate
0.8%
Rent to Value Ratio
Active
$339,000
3
bds
|
2
ba
|
2,070
sqft
|
built
1998
3406 Mc Mahon Way, Missouri City, TX 77459
$-459
Cash flow
-7.1%
Cash-on-Cash Return
4.1%
Cap rate
0.8%
Rent to Value Ratio
Active
$214,990
3
bds
|
1
ba
|
1,056
sqft
|
built
1968
428 West St, Rosenberg, TX 77471
$-178
Cash flow
-4.3%
Cash-on-Cash Return
4.7%
Cap rate
0.7%
Rent to Value Ratio

Active
$574,880
4
bds
|
3
ba
|
2,998
sqft
|
built
1982
214 Caleta Cir, Richmond, TX 77406
$-1,048
Cash flow
-9.5%
Cash-on-Cash Return
3.5%
Cap rate
0.6%
Rent to Value Ratio

Active
$649,999
5
bds
|
6
ba
|
4,822
sqft
|
built
1997
3815 Griffin Ln, Missouri City, TX 77459
$-1,030
Cash flow
-8.3%
Cash-on-Cash Return
3.8%
Cap rate
0.7%
Rent to Value Ratio
Active
$705,000
5
bds
|
4
ba
|
4,140
sqft
|
built
2008
4303 Pensacola Oaks Ln, Sugar Land, TX 77479
$-1,872
Cash flow
-13.9%
Cash-on-Cash Return
2.5%
Cap rate
0.5%
Rent to Value Ratio
Active
$420,000
5
bds
|
4
ba
|
2,851
sqft
|
built
2023
32523 Dew Crest St, Fulshear, TX 77423
$-1,111
Cash flow
-13.8%
Cash-on-Cash Return
2.5%
Cap rate
0.7%
Rent to Value Ratio