Fort Bend County Investment Properties for Sale
Browse homes for sale and investment properties in Fort Bend County. Refine your search by price, property type, or more.
Best cash flowing properties in Fort Bend County
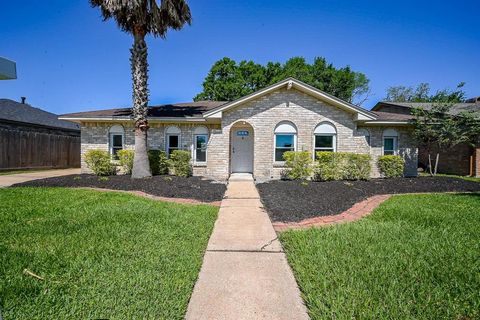
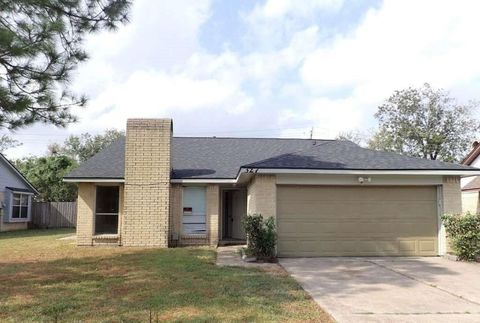
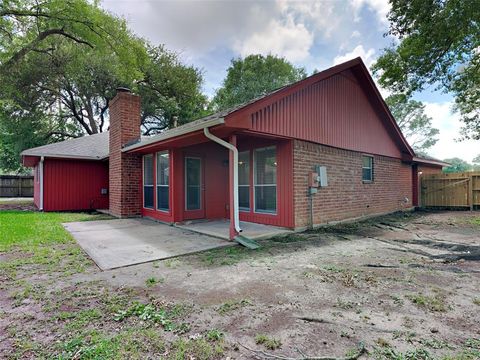
Active
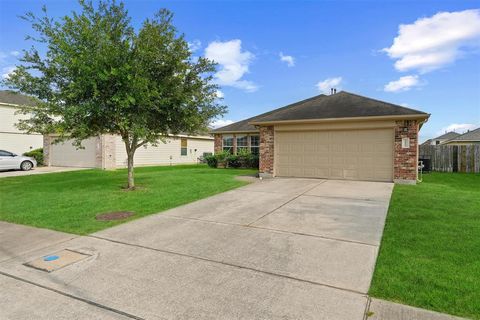
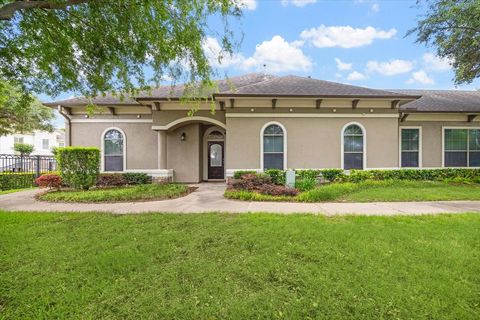
$125,000
3
bds
|
4
ba
|
1,728
sqft
|
built
1974
6989 Chasewood Dr, Missouri City, TX 77489
$171
Cash flow
7.1%
Cash-on-Cash Return
7.3%
Cap rate
1.4%
Rent to Value Ratio
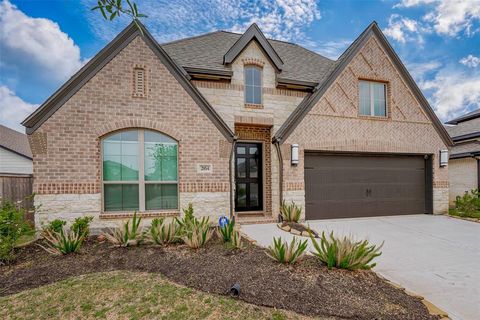
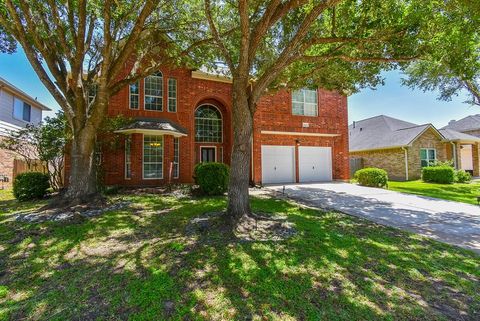
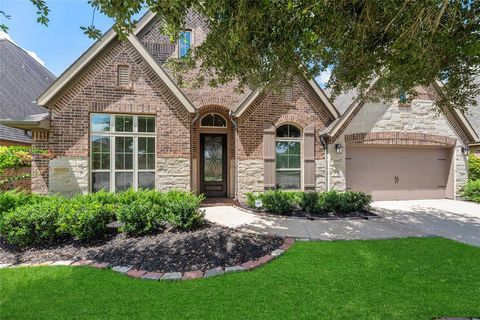
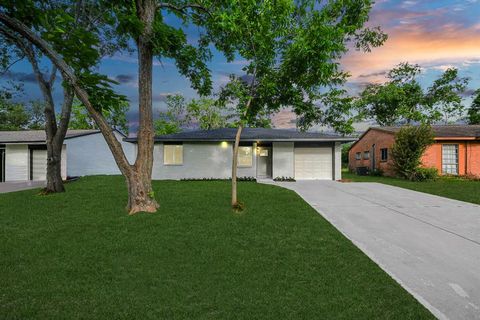
Active
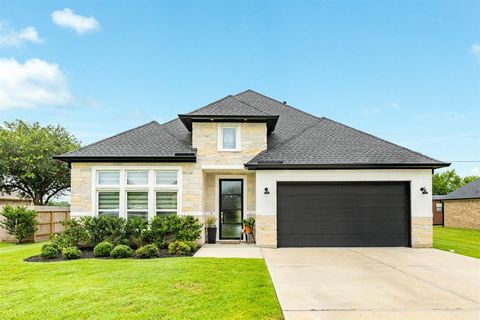
$279,500
4
bds
|
2
ba
|
1,740
sqft
|
built
2014
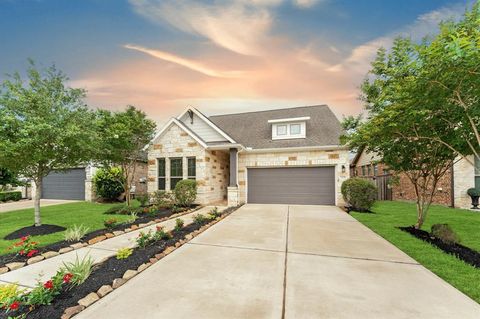
2611 Verano Dr, Richmond, TX 77406
$17
Cash flow
0.3%
Cash-on-Cash Return
5.8%
Cap rate
0.7%
Rent to Value Ratio
1,605 out of 1,684 properties for sale in Fort Bend County
Limited Results Shown
Create a free account, or log in to reveal all property listings and enjoy the complete experience.
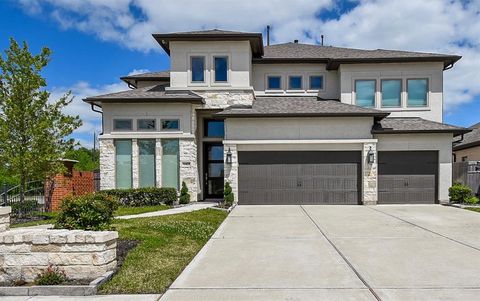
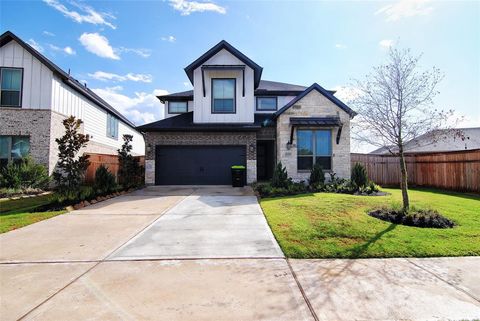
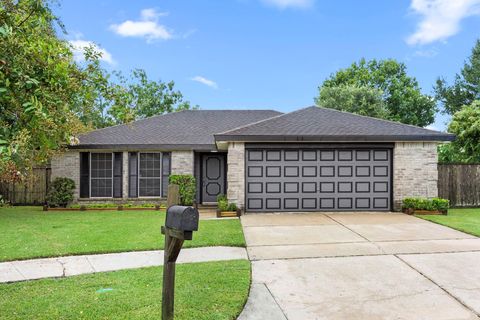
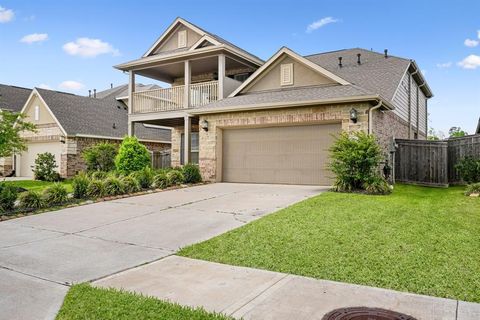
Active
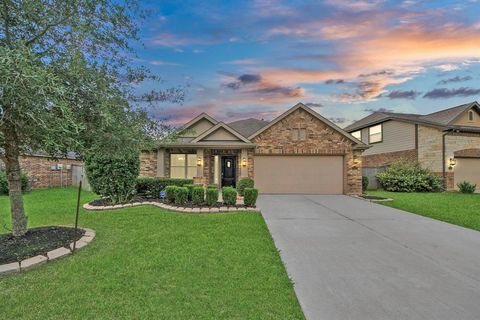
$499,000
4
bds
|
3
ba
|
2,571
sqft
|
built
2022
2854 Acacia Grove Dr, Fulshear, TX 77494
$-1,148
Cash flow
-12.0%
Cash-on-Cash Return
2.9%
Cap rate
0.7%
Rent to Value Ratio
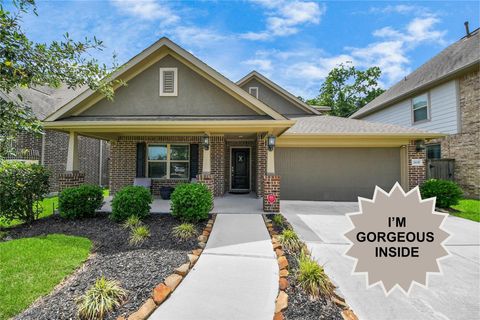
Active
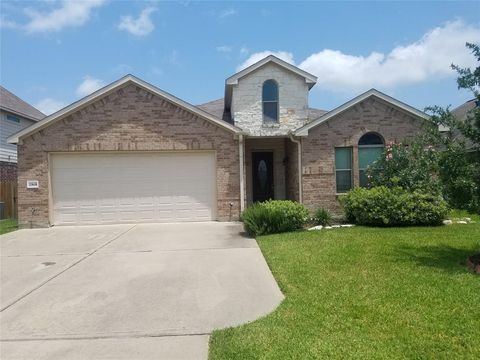
$739,000
4
bds
|
4
ba
|
3,330
sqft
|
built
2022
9403 Orchard Trl, Missouri City, TX 77459
$-1,796
Cash flow
-12.7%
Cash-on-Cash Return
2.8%
Cap rate
0.6%
Rent to Value Ratio
Active
$465,000
5
bds
|
3
ba
|
2,618
sqft
|
built
2022
31447 Golden Cliffs Ln, Fulshear, TX 77441
$-1,175
Cash flow
-13.2%
Cash-on-Cash Return
2.6%
Cap rate
0.7%
Rent to Value Ratio
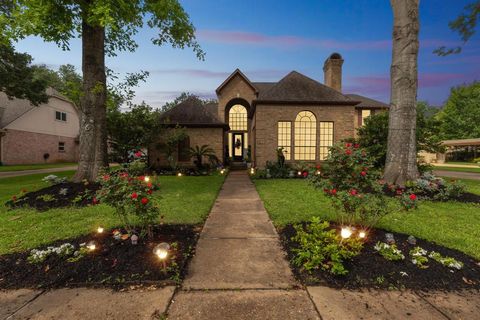
Active
$469,000
4
bds
|
4
ba
|
3,393
sqft
|
built
1985
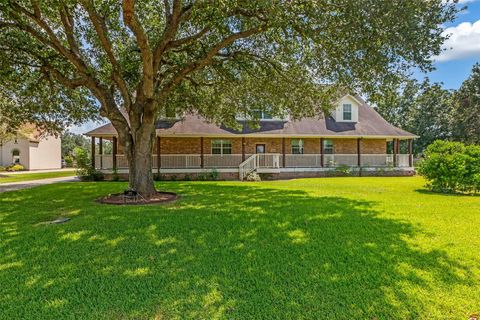
1811 Copperwood Ln, Richmond, TX 77406
$-810
Cash flow
-9.0%
Cash-on-Cash Return
3.6%
Cap rate
0.7%
Rent to Value Ratio

Active
$353,000
3
bds
|
3
ba
|
2,770
sqft
|
built
2019
14204 Carlisle Hollow Ln Trl, Pearland, TX 77584
$-624
Cash flow
-9.2%
Cash-on-Cash Return
3.6%
Cap rate
0.8%
Rent to Value Ratio
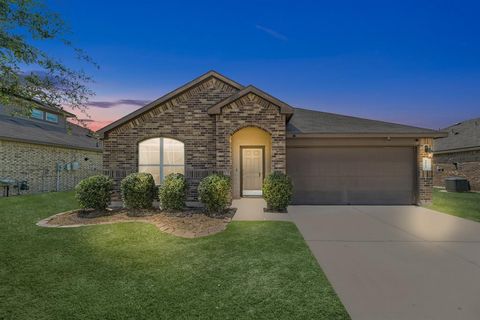
Active
$275,000
4
bds
|
2
ba
|
1,540
sqft
|
built
2019
1822 Brady Shores Dr, Rosenberg, TX 77469
$-475
Cash flow
-9.0%
Cash-on-Cash Return
3.6%
Cap rate
0.8%
Rent to Value Ratio
Active
$499,900
4
bds
|
4
ba
|
3,013
sqft
|
built
2019
28111 Middlewater View Ln, Katy, TX 77494
$-878
Cash flow
-9.2%
Cash-on-Cash Return
3.6%
Cap rate
0.8%
Rent to Value Ratio
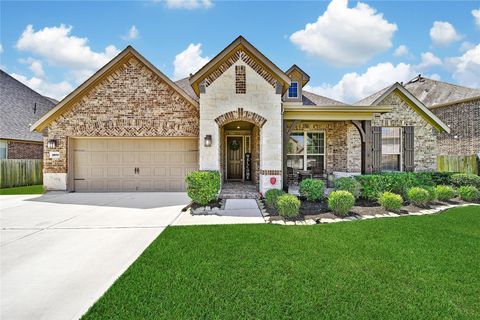
Active
$320,000
3
bds
|
2
ba
|
1,823
sqft
|
built
2019
9415 Spring Fawn Dr, Richmond, TX 77406
$-74
Cash flow
-1.2%
Cash-on-Cash Return
5.4%
Cap rate
0.7%
Rent to Value Ratio
Active
$415,000
4
bds
|
4
ba
|
3,197
sqft
|
built
2018
1503 Wheatley Hill Ln, Katy, TX 77494
$-819
Cash flow
-10.3%
Cash-on-Cash Return
3.3%
Cap rate
0.7%
Rent to Value Ratio
Active
$625,000
4
bds
|
4
ba
|
3,567
sqft
|
built
1999
24311 Bay Hill Blvd, Katy, TX 77494
$-1,538
Cash flow
-12.8%
Cash-on-Cash Return
2.7%
Cap rate
0.6%
Rent to Value Ratio
Active
$395,000
4
bds
|
3
ba
|
2,726
sqft
|
built
2004
1523 Rocky Bar Ln, Richmond, TX 77469
$-464
Cash flow
-6.1%
Cash-on-Cash Return
4.3%
Cap rate
0.6%
Rent to Value Ratio
Active
$849,000
4
bds
|
4
ba
|
3,987
sqft
|
built
2011
5114 Red Burr Oak Trl, Katy, TX 77494
$-933
Cash flow
-5.7%
Cash-on-Cash Return
4.4%
Cap rate
0.7%
Rent to Value Ratio
Active
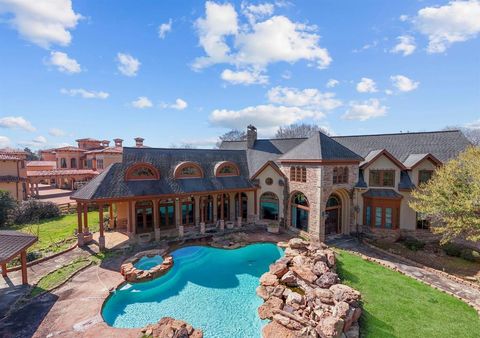
$3,639,000
5
bds
|
8
ba
|
7,482
sqft
|
built
1997
326 W Alkire Lake Dr, Sugar Land, TX 77478
$-12,253
Cash flow
-17.6%
Cash-on-Cash Return
1.6%
Cap rate
0.2%
Rent to Value Ratio
Active
$278,000
3
bds
|
2
ba
|
1,875
sqft
|
built
1974
13722 Woodchester Dr, Sugar Land, TX 77498
$-391
Cash flow
-7.3%
Cash-on-Cash Return
4.0%
Cap rate
0.7%
Rent to Value Ratio
Active
$399,000
4
bds
|
4
ba
|
3,473
sqft
|
built
2001
22107 Skyridge Ln, Richmond, TX 77469
$-855
Cash flow
-11.2%
Cash-on-Cash Return
3.1%
Cap rate
0.7%
Rent to Value Ratio
Active
$420,000
4
bds
|
4
ba
|
2,866
sqft
|
built
1991
4830 Plantation Colony Dr, Sugar Land, TX 77478
$-774
Cash flow
-9.6%
Cash-on-Cash Return
3.5%
Cap rate
0.7%
Rent to Value Ratio
Active
$404,900
4
bds
|
3
ba
|
2,685
sqft
|
built
2011
13501 Wild Lilac Ct, Pearland, TX 77584
$-885
Cash flow
-11.4%
Cash-on-Cash Return
3.1%
Cap rate
0.7%
Rent to Value Ratio
Active
$1,190,000
5
bds
|
6
ba
|
5,820
sqft
|
built
1982
6611 Riva Ridge Dr, Richmond, TX 77406
$-3,576
Cash flow
-15.7%
Cash-on-Cash Return
2.1%
Cap rate
0.4%
Rent to Value Ratio
Active
$165,000
2
bds
|
1
ba
|
1,048
sqft
|
built
1982
5404 Ridgemont Pl, Houston, TX 77053
$-113
Cash flow
-3.6%
Cash-on-Cash Return
4.9%
Cap rate
0.8%
Rent to Value Ratio
Active
$375,000
2
bds
|
2
ba
|
2,059
sqft
|
built
2004
4337 Lake Run Dr, Missouri City, TX 77459
$-806
Cash flow
-11.2%
Cash-on-Cash Return
3.1%
Cap rate
0.7%
Rent to Value Ratio
Active
$395,000
3
bds
|
3
ba
|
2,090
sqft
|
built
2021
9715 Highland Pointe Dr, Needville, TX 77461
$-639
Cash flow
-8.4%
Cash-on-Cash Return
3.7%
Cap rate
0.7%
Rent to Value Ratio
Active
$355,000
3
bds
|
2
ba
|
2,032
sqft
|
built
2018
23311 Bingum Pass Dr, Richmond, TX 77469
$-781
Cash flow
-11.5%
Cash-on-Cash Return
3.0%
Cap rate
0.7%
Rent to Value Ratio
Active
$315,900
3
bds
|
3
ba
|
2,130
sqft
|
built
2011
23618 Starbridge Lake Ln, Richmond, TX 77407
$13
Cash flow
0.2%
Cash-on-Cash Return
5.7%
Cap rate
0.7%
Rent to Value Ratio
Active
$1,145,000
4
bds
|
4
ba
|
6,945
sqft
|
built
2011
3811 Westerdale Dr, Fulshear, TX 77441
$-2,793
Cash flow
-12.7%
Cash-on-Cash Return
2.8%
Cap rate
0.5%
Rent to Value Ratio
Active
$339,000
3
bds
|
2
ba
|
1,771
sqft
|
built
2018
2535 Amethyst Isle Ln, Missouri City, TX 77459
$-761
Cash flow
-11.7%
Cash-on-Cash Return
3.0%
Cap rate
0.7%
Rent to Value Ratio
Active
$459,000
3
bds
|
4
ba
|
2,615
sqft
|
built
2020
8703 Red Heron Ln, Missouri City, TX 77459
$-1,198
Cash flow
-13.6%
Cash-on-Cash Return
2.5%
Cap rate
0.7%
Rent to Value Ratio
Active
$599,000
4
bds
|
4
ba
|
3,546
sqft
|
built
2021
26314 Polaris Rise Ln, Richmond, TX 77406
$-138
Cash flow
-1.2%
Cash-on-Cash Return
5.4%
Cap rate
0.7%
Rent to Value Ratio
Active
$242,499
3
bds
|
2
ba
|
1,452
sqft
|
built
1979
327 Oakdale Dr, Stafford, TX 77477
$-81
Cash flow
-1.7%
Cash-on-Cash Return
5.3%
Cap rate
0.8%
Rent to Value Ratio
Active
$459,900
4
bds
|
3
ba
|
3,363
sqft
|
built
2015
6302 Milam Branch Ln, Rosenberg, TX 77471
$-1,138
Cash flow
-12.9%
Cash-on-Cash Return
2.7%
Cap rate
0.6%
Rent to Value Ratio
Active
$250,000
3
bds
|
2
ba
|
1,171
sqft
|
built
1981
10327 Hollow Canyon Ct, Sugar Land, TX 77498
$-358
Cash flow
-7.5%
Cash-on-Cash Return
4.0%
Cap rate
0.7%
Rent to Value Ratio
Active
$435,000
4
bds
|
4
ba
|
2,395
sqft
|
built
2018
2635 Parker Oak Pass, Missouri City, TX 77459
$-808
Cash flow
-9.7%
Cash-on-Cash Return
3.5%
Cap rate
0.7%
Rent to Value Ratio
Active
$250,000
3
bds
|
2
ba
|
1,838
sqft
|
built
1977
1402 Cherry Springs Ct, Missouri City, TX 77459
$-262
Cash flow
-5.5%
Cash-on-Cash Return
4.4%
Cap rate
0.8%
Rent to Value Ratio
Active
$250,000
3
bds
|
2
ba
|
1,026
sqft
|
built
1976
15318 Corsair Rd, Houston, TX 77053
$-568
Cash flow
-11.9%
Cash-on-Cash Return
3.0%
Cap rate
0.5%
Rent to Value Ratio
Active
$425,000
4
bds
|
4
ba
|
2,783
sqft
|
built
2021
1706 Country Air Ln, Missouri City, TX 77459
$-1,187
Cash flow
-14.6%
Cash-on-Cash Return
2.3%
Cap rate
0.7%
Rent to Value Ratio
Active
$599,900
3
bds
|
3
ba
|
2,335
sqft
|
built
2018
4827 Bellwood Springs Ln, Sugar Land, TX 77479
$-1,607
Cash flow
-14.0%
Cash-on-Cash Return
2.5%
Cap rate
0.5%
Rent to Value Ratio
Active
$650,000
4
bds
|
5
ba
|
3,852
sqft
|
built
2016
4414 Tilbury Trl, Richmond, TX 77407
$-1,823
Cash flow
-14.6%
Cash-on-Cash Return
2.3%
Cap rate
0.5%
Rent to Value Ratio
Active
$925,000
4
bds
|
4
ba
|
4,504
sqft
|
built
2015
27415 Ashford Sky Ln, Katy, TX 77494
$-2,940
Cash flow
-16.6%
Cash-on-Cash Return
1.9%
Cap rate
0.6%
Rent to Value Ratio
Active
$289,000
3
bds
|
2
ba
|
1,371
sqft
|
built
1983
4007 Issacks Way, Sugar Land, TX 77479
$-441
Cash flow
-8.0%
Cash-on-Cash Return
3.8%
Cap rate
0.7%
Rent to Value Ratio