Harris County Investment Properties for Sale
Browse homes for sale and investment properties in Harris County. Refine your search by price, property type, or more.
Best cash flowing properties in Harris County
Active
$65,000
2
bds
|
1
ba
|
834
sqft
|
built
1978
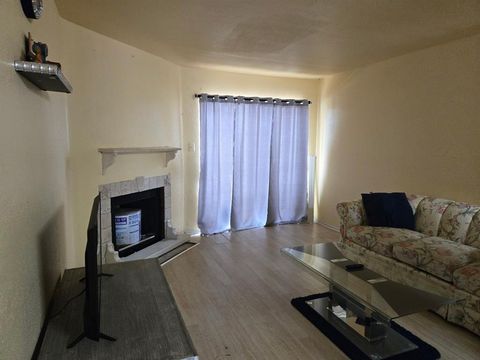
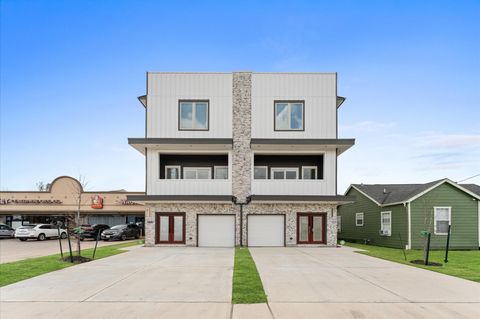
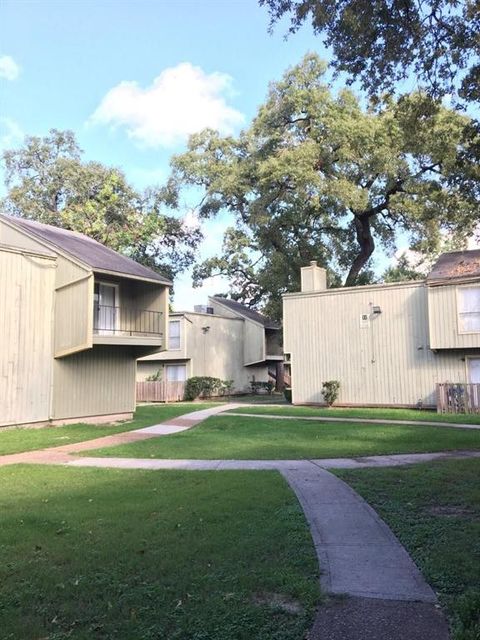
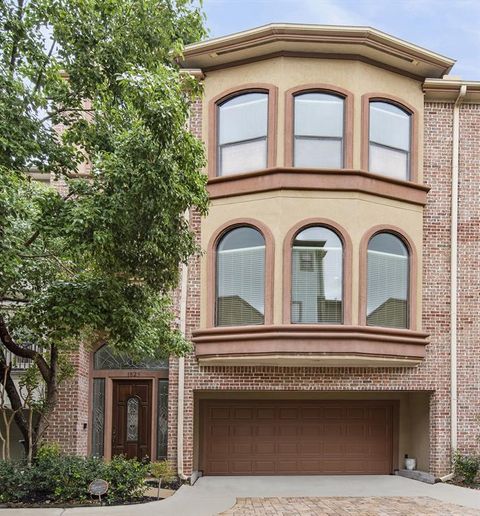
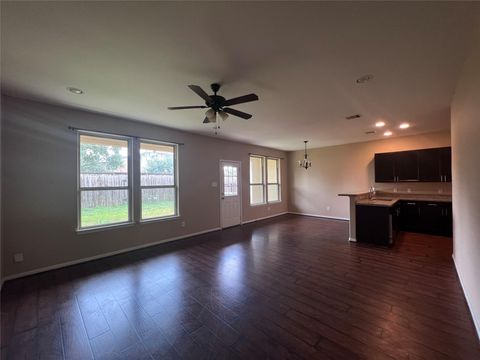
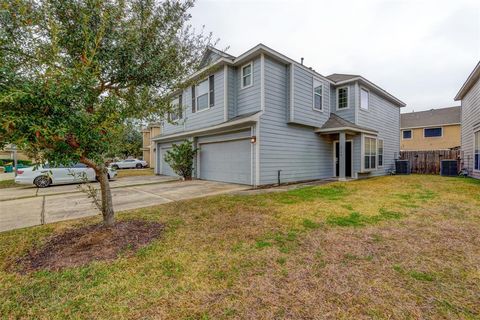
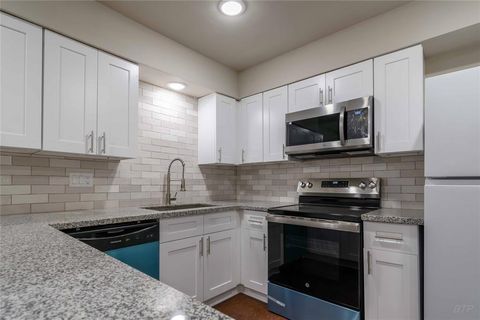
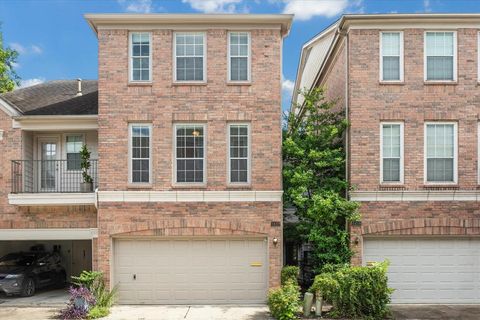
8405 Wilcrest Dr, Houston, TX 77072
$259
Cash flow
4.6%
Cash-on-Cash Return
4.8%
Cap rate
1.5%
Rent to Value Ratio
Active
$62,000
1
bds
|
2
ba
|
1,029
sqft
|
built
1981
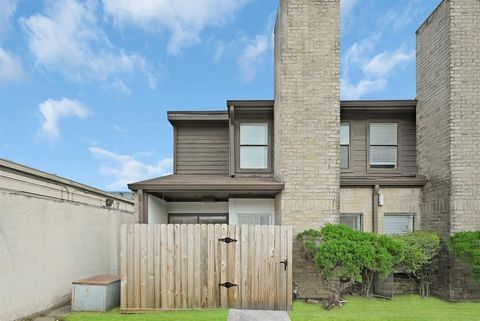
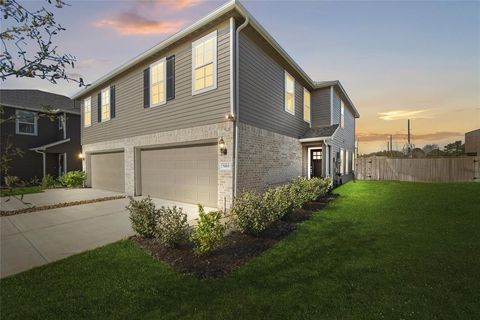
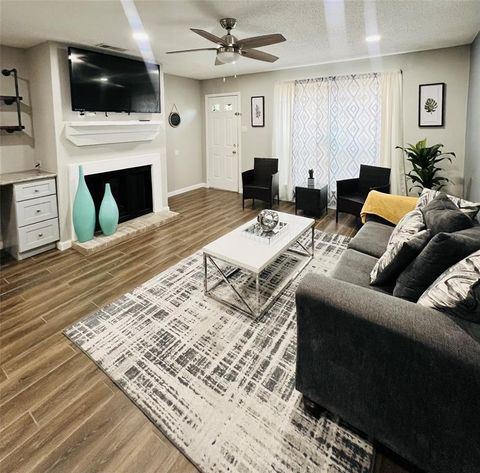
6633 W Airport Blvd, Houston, TX 77035
$256
Cash flow
4.8%
Cash-on-Cash Return
5.0%
Cap rate
1.8%
Rent to Value Ratio
543 out of 1,003 properties for sale in Harris County
Limited Results Shown
Create a free account, or log in to reveal all property listings and enjoy the complete experience.
Active
$155,000
2
bds
|
3
ba
|
1,664
sqft
|
built
1963
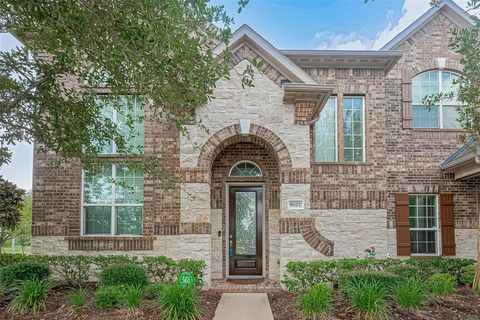
3300 Yorktown St, Houston, TX 77056
$-1,068
Cash flow
-35.9%
Cash-on-Cash Return
-2.6%
Cap rate
1.3%
Rent to Value Ratio
Active
$181,500
2
bds
|
3
ba
|
1,728
sqft
|
built
1973
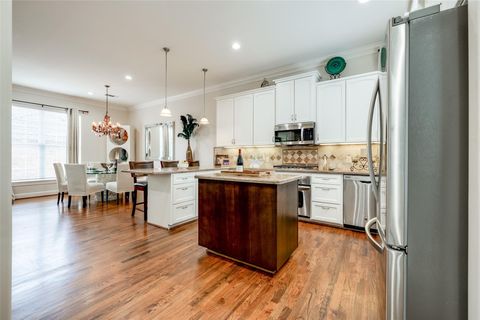
10631 Sandpiper Dr, Houston, TX 77096
$230
Cash flow
6.6%
Cash-on-Cash Return
7.2%
Cap rate
1.1%
Rent to Value Ratio
Active
$344,000
3
bds
|
3
ba
|
1,876
sqft
|
built
2022
9408 Caddo Ridge Ln, Cypress, TX 77433
$-656
Cash flow
-9.9%
Cash-on-Cash Return
3.4%
Cap rate
0.8%
Rent to Value Ratio
Active
$185,000
3
bds
|
2
ba
|
1,307
sqft
|
built
1978
2445 Briarwest Blvd, Houston, TX 77077
$-307
Cash flow
-8.7%
Cash-on-Cash Return
3.7%
Cap rate
0.9%
Rent to Value Ratio

Active
$170,000
2
bds
|
3
ba
|
1,600
sqft
|
built
1984
3254 Holly Hall St, Houston, TX 77054
$-644
Cash flow
-19.8%
Cash-on-Cash Return
1.1%
Cap rate
1.1%
Rent to Value Ratio
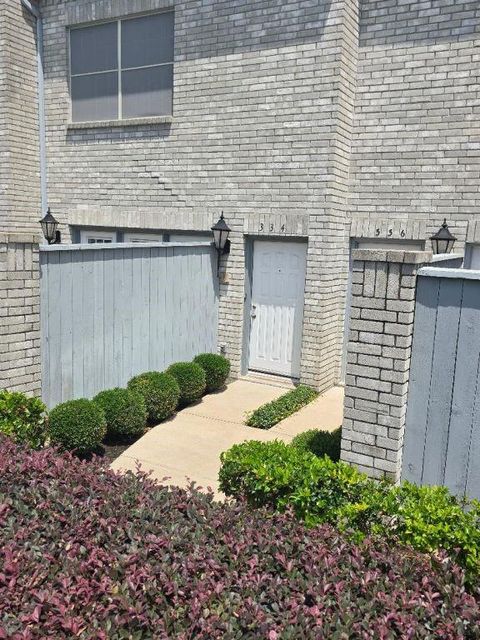
Active
$204,000
2
bds
|
3
ba
|
1,740
sqft
|
built
1983
334 Wilcrest Dr, Houston, TX 77042
$-662
Cash flow
-16.9%
Cash-on-Cash Return
1.8%
Cap rate
0.9%
Rent to Value Ratio
Active
$332,000
2
bds
|
3
ba
|
2,173
sqft
|
built
2002
12620 Briar Patch Rd, Houston, TX 77077
$-920
Cash flow
-14.5%
Cash-on-Cash Return
2.4%
Cap rate
0.7%
Rent to Value Ratio
Active
$495,500
4
bds
|
4
ba
|
3,149
sqft
|
built
2019
1908 Dismuke St, Houston, TX 77023
$-917
Cash flow
-9.7%
Cash-on-Cash Return
3.5%
Cap rate
0.6%
Rent to Value Ratio
Active
$275,000
3
bds
|
3
ba
|
1,706
sqft
|
built
2023
5263 Shallowhurst Ln, Katy, TX 77449
$-273
Cash flow
-5.2%
Cash-on-Cash Return
4.5%
Cap rate
0.8%
Rent to Value Ratio
Active
$131,000
3
bds
|
2
ba
|
1,672
sqft
|
built
1978
9501 Windswept Ln, Houston, TX 77063
$-314
Cash flow
-12.5%
Cash-on-Cash Return
2.8%
Cap rate
1.3%
Rent to Value Ratio
Active
$282,000
2
bds
|
3
ba
|
1,490
sqft
|
built
1977
152 Litchfield Ln, Houston, TX 77024
$-950
Cash flow
-17.6%
Cash-on-Cash Return
1.6%
Cap rate
0.8%
Rent to Value Ratio
Active
$49,500
2
bds
|
3
ba
|
1,254
sqft
|
built
1972
5625 Antoine Dr, Houston, TX 77091
$172
Cash flow
4.0%
Cash-on-Cash Return
4.2%
Cap rate
2.2%
Rent to Value Ratio
Active
$155,000
2
bds
|
3
ba
|
1,564
sqft
|
built
1981
2112 Greenbriar Colony Dr, Houston, TX 77032
$-33
Cash flow
-1.1%
Cash-on-Cash Return
5.4%
Cap rate
1.0%
Rent to Value Ratio
Active
$349,000
3
bds
|
3
ba
|
2,417
sqft
|
built
2012
9107 Solvista Pass Ln, Houston, TX 77070
$-951
Cash flow
-14.2%
Cash-on-Cash Return
2.4%
Cap rate
0.7%
Rent to Value Ratio
Active
$521,000
3
bds
|
4
ba
|
2,224
sqft
|
built
2005
5306 Nolda St, Houston, TX 77007
$-1,184
Cash flow
-11.9%
Cash-on-Cash Return
3.0%
Cap rate
0.6%
Rent to Value Ratio
Active
$555,000
3
bds
|
4
ba
|
2,712
sqft
|
built
2002
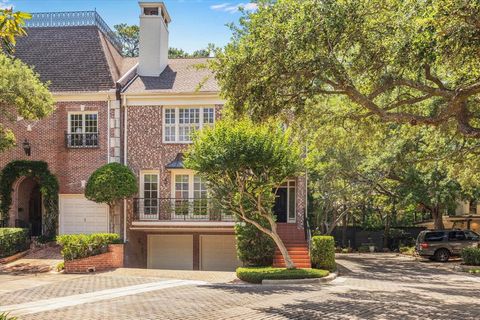
1825 Stanford St, Houston, TX 77006
$-1,092
Cash flow
-10.3%
Cash-on-Cash Return
3.3%
Cap rate
0.6%
Rent to Value Ratio
Active
$389,999
3
bds
|
3
ba
|
1,774
sqft
|
built
2023
11250 Buchanan Coves Ln, Cypress, TX 77433
$-801
Cash flow
-10.7%
Cash-on-Cash Return
3.2%
Cap rate
0.8%
Rent to Value Ratio
Active
$134,900
2
bds
|
3
ba
|
1,028
sqft
|
built
1978
9321 Pagewood Ln, Houston, TX 77063
$-86
Cash flow
-3.3%
Cash-on-Cash Return
4.9%
Cap rate
1.2%
Rent to Value Ratio
Active
$205,000
3
bds
|
3
ba
|
1,691
sqft
|
built
2002
20210 Arbolada Green Ct, Humble, TX 77346
$-141
Cash flow
-3.6%
Cash-on-Cash Return
4.9%
Cap rate
0.9%
Rent to Value Ratio
Active
$315,000
4
bds
|
3
ba
|
2,356
sqft
|
built
1983
15326 Gorham Dr, Houston, TX 77084
$-5
Cash flow
-0.1%
Cash-on-Cash Return
5.7%
Cap rate
0.7%
Rent to Value Ratio
Active
$599,000
3
bds
|
4
ba
|
2,806
sqft
|
built
2006
4915 Chenevert St, Houston, TX 77004
$-1,326
Cash flow
-11.5%
Cash-on-Cash Return
3.0%
Cap rate
0.7%
Rent to Value Ratio

Active
$205,000
2
bds
|
2
ba
|
1,284
sqft
|
built
2004
9735 Coyote Creek Dr, Houston, TX 77095
$169
Cash flow
4.3%
Cash-on-Cash Return
6.7%
Cap rate
0.9%
Rent to Value Ratio
Active
$495,000
3
bds
|
2
ba
|
2,284
sqft
|
built
1967
4053 Breakwood Dr, Houston, TX 77025
$-658
Cash flow
-6.9%
Cash-on-Cash Return
4.1%
Cap rate
0.7%
Rent to Value Ratio

Active
$309,995
2
bds
|
3
ba
|
1,520
sqft
|
built
1967
425 Bendwood Dr, Houston, TX 77024
$-926
Cash flow
-15.6%
Cash-on-Cash Return
2.1%
Cap rate
0.7%
Rent to Value Ratio
Active
$290,000
3
bds
|
3
ba
|
1,842
sqft
|
built
2021
5530 Evanston Ln, Pasadena, TX 77505
$-459
Cash flow
-8.3%
Cash-on-Cash Return
3.8%
Cap rate
0.8%
Rent to Value Ratio

Active
$134,995
2
bds
|
2
ba
|
1,272
sqft
|
built
1983
2079 Country Village Blvd, Humble, TX 77338
$-317
Cash flow
-12.3%
Cash-on-Cash Return
2.9%
Cap rate
1.0%
Rent to Value Ratio
Active
$240,000
3
bds
|
3
ba
|
1,939
sqft
|
built
2016
17035 Wilthorne Gardens Ct, Houston, TX 77084
$-491
Cash flow
-10.7%
Cash-on-Cash Return
3.2%
Cap rate
0.8%
Rent to Value Ratio

Active
$224,899
3
bds
|
2
ba
|
1,344
sqft
|
built
2019
18841 Elegance Ave, Spring, TX 77379
$-229
Cash flow
-5.3%
Cash-on-Cash Return
4.5%
Cap rate
0.9%
Rent to Value Ratio
Active
$208,500
3
bds
|
3
ba
|
1,696
sqft
|
built
2007
6106 Yorkglen Manor Ln, Houston, TX 77084
$55
Cash flow
1.4%
Cash-on-Cash Return
6.0%
Cap rate
0.9%
Rent to Value Ratio

Active
$315,000
3
bds
|
3
ba
|
1,813
sqft
|
built
2021
19638 San Angelo Park Dr, Cypress, TX 77433
$-834
Cash flow
-13.8%
Cash-on-Cash Return
2.5%
Cap rate
0.8%
Rent to Value Ratio

Active
$799,900
3
bds
|
3
ba
|
2,745
sqft
|
built
1973
6 River Hollow Ln, Houston, TX 77027
$-1,777
Cash flow
-11.6%
Cash-on-Cash Return
3.0%
Cap rate
0.7%
Rent to Value Ratio
Active
$1,162,000
3
bds
|
5
ba
|
3,880
sqft
|
built
1982
17 Pine Briar Cir, Houston, TX 77056
$-3,305
Cash flow
-14.8%
Cash-on-Cash Return
2.3%
Cap rate
0.5%
Rent to Value Ratio

Active
$240,000
3
bds
|
3
ba
|
1,687
sqft
|
built
2009
2726 Maybrook Hollow Ln, Houston, TX 77047
$-321
Cash flow
-7.0%
Cash-on-Cash Return
4.1%
Cap rate
0.8%
Rent to Value Ratio
Active
$565,000
4
bds
|
5
ba
|
2,983
sqft
|
built
2015
5101 Allen St, Houston, TX 77007
$86
Cash flow
0.8%
Cash-on-Cash Return
5.9%
Cap rate
0.7%
Rent to Value Ratio
Active
$160,000
2
bds
|
2
ba
|
1,184
sqft
|
built
1970
12046 Beechnut St, Houston, TX 77072
$-281
Cash flow
-9.2%
Cash-on-Cash Return
3.6%
Cap rate
0.6%
Rent to Value Ratio

Active
$500,000
3
bds
|
4
ba
|
2,348
sqft
|
built
2005
234 Detering St, Houston, TX 77007
$-338
Cash flow
-3.5%
Cash-on-Cash Return
4.9%
Cap rate
0.6%
Rent to Value Ratio
Active
$549,000
3
bds
|
4
ba
|
3,121
sqft
|
built
1996
4422 Castle Court Pl, Houston, TX 77006
$-880
Cash flow
-8.4%
Cash-on-Cash Return
3.8%
Cap rate
0.8%
Rent to Value Ratio

Active
$146,900
2
bds
|
2
ba
|
956
sqft
|
built
1976
13023 High Star Dr, Houston, TX 77072
$-152
Cash flow
-5.4%
Cash-on-Cash Return
4.4%
Cap rate
1.0%
Rent to Value Ratio