Harris County Investment Properties for Sale
Browse homes for sale and investment properties in Harris County. Refine your search by price, property type, or more.
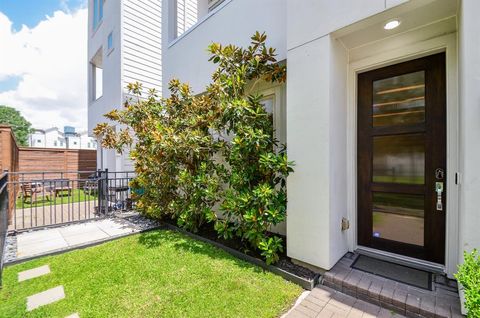
Best cash flowing properties in Harris County
Active
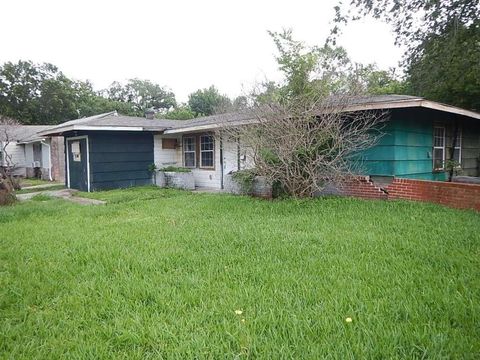
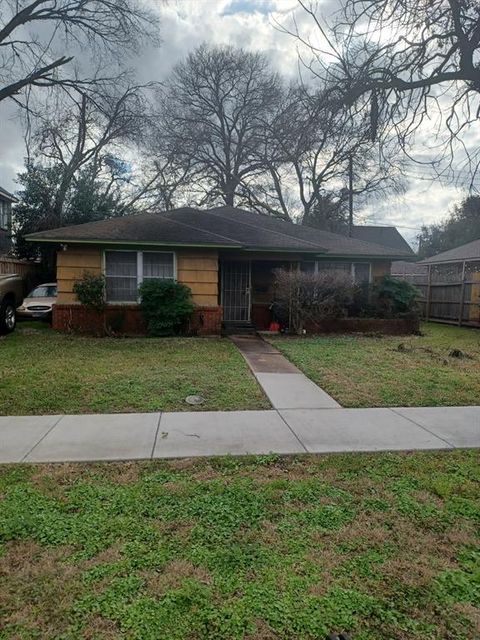
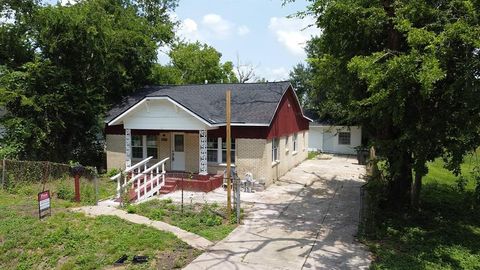
$189,999
3
bds
|
1
ba
|
1,625
sqft
|
built
1951
5251 Perry St, Houston, TX 77021
$90
Cash flow
2.5%
Cash-on-Cash Return
6.2%
Cap rate
0.9%
Rent to Value Ratio
Active
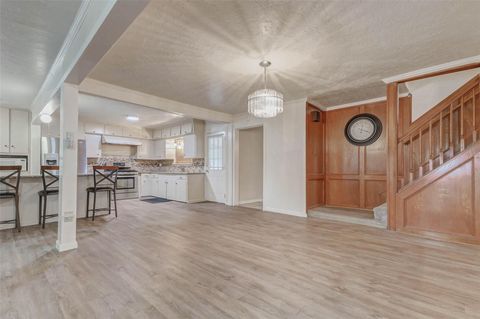
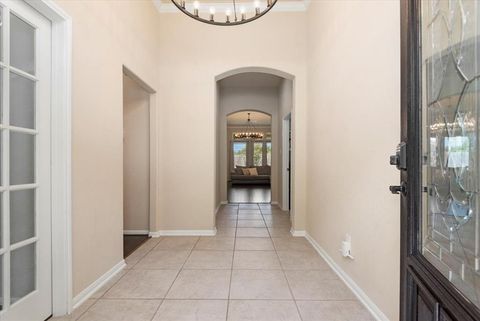
$310,000
5
bds
|
4
ba
|
2,571
sqft
|
built
1952
315 Avenue A, South Houston, TX 77587
$-132
Cash flow
-2.2%
Cash-on-Cash Return
5.2%
Cap rate
0.8%
Rent to Value Ratio
10,000 out of 11,844 properties for sale in Harris County
Limited Results Shown
Create a free account, or log in to reveal all property listings and enjoy the complete experience.
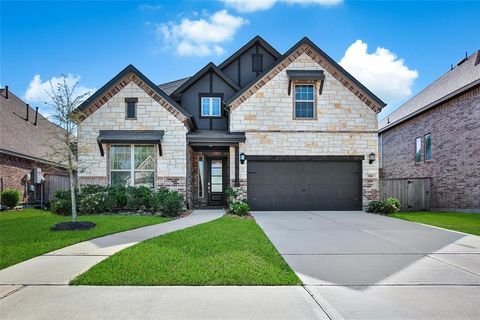
Active
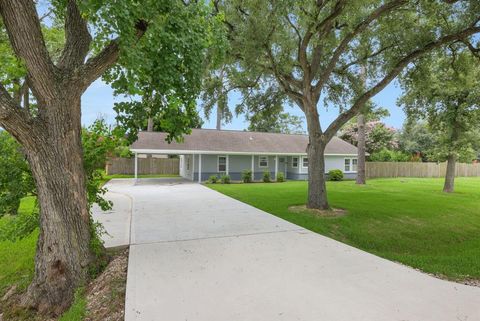
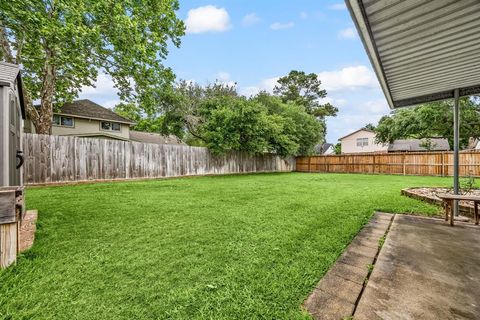
$395,000
4
bds
|
2
ba
|
1,929
sqft
|
built
1959
519 N Shady Ln, La Porte, TX 77571
$-927
Cash flow
-12.2%
Cash-on-Cash Return
2.9%
Cap rate
0.5%
Rent to Value Ratio

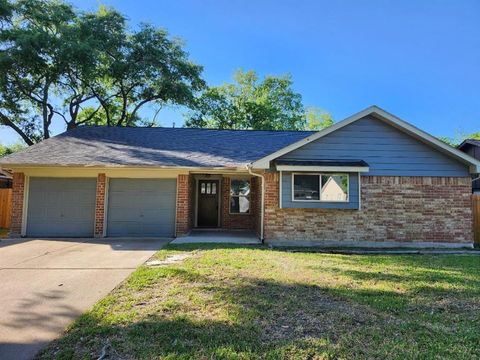
Active
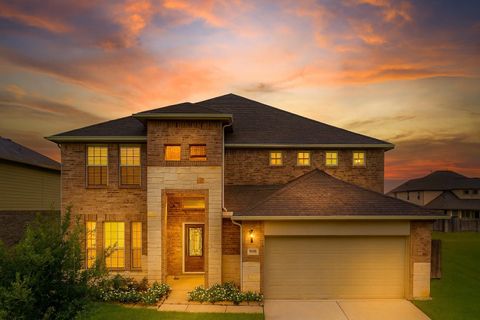
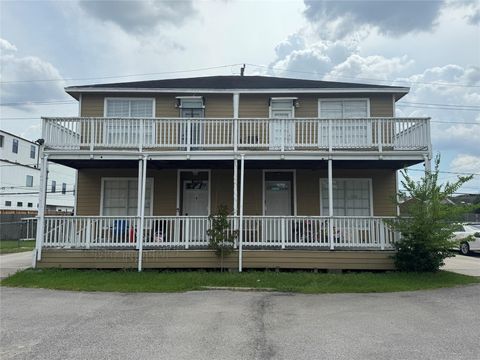
$345,000
4
bds
|
4
ba
|
3,490
sqft
|
built
1967
118 Crestway Dr, Baytown, TX 77520
$-328
Cash flow
-5.0%
Cash-on-Cash Return
4.5%
Cap rate
0.9%
Rent to Value Ratio

Active
$213,000
3
bds
|
2
ba
|
1,580
sqft
|
built
1957
117 Pecan Dr, Baytown, TX 77520
$-190
Cash flow
-4.7%
Cash-on-Cash Return
4.6%
Cap rate
0.9%
Rent to Value Ratio

Active
$320,000
4
bds
|
2
ba
|
2,027
sqft
|
built
1966
431 Shadow Creek Dr, El Lago, TX 77586
$-296
Cash flow
-4.8%
Cash-on-Cash Return
4.6%
Cap rate
0.8%
Rent to Value Ratio
Active
$490,000
5
bds
|
4
ba
|
4,171
sqft
|
built
2020
31315 Kailua Dr, Hockley, TX 77447
$-1,356
Cash flow
-14.4%
Cash-on-Cash Return
2.4%
Cap rate
0.7%
Rent to Value Ratio
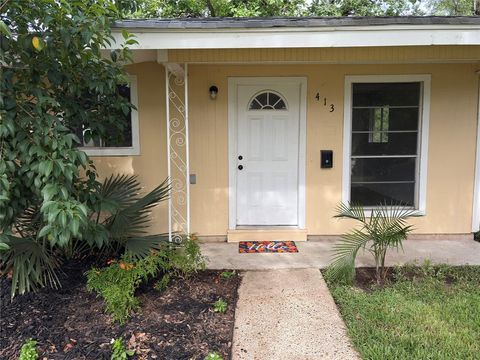
Active
$217,500
4
bds
|
2
ba
|
1,224
sqft
|
built
1960
413 Betty Rd, South Houston, TX 77587
$-228
Cash flow
-5.5%
Cash-on-Cash Return
4.4%
Cap rate
0.8%
Rent to Value Ratio
Active
$370,000
4
bds
|
3
ba
|
2,418
sqft
|
built
1962
303 Bayou View Dr, El Lago, TX 77586
$-633
Cash flow
-8.9%
Cash-on-Cash Return
3.6%
Cap rate
0.7%
Rent to Value Ratio
Active
$309,500
5
bds
|
3
ba
|
2,667
sqft
|
built
2011
26902 Springflight Ln, Hockley, TX 77447
$-772
Cash flow
-13.0%
Cash-on-Cash Return
2.7%
Cap rate
0.7%
Rent to Value Ratio
Active
$535,000
4
bds
|
3
ba
|
2,531
sqft
|
built
1992
21815 Fearless Dr, Hockley, TX 77447
$-1,226
Cash flow
-12.0%
Cash-on-Cash Return
2.9%
Cap rate
0.5%
Rent to Value Ratio
Active
$279,000
3
bds
|
3
ba
|
1,725
sqft
|
built
2013
26911 Jade Feather Ln, Hockley, TX 77447
$-641
Cash flow
-12.0%
Cash-on-Cash Return
2.9%
Cap rate
0.7%
Rent to Value Ratio
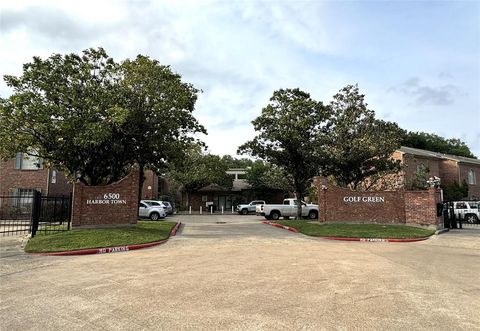
Active
$120,000
2
bds
|
2
ba
|
1,108
sqft
|
built
1984
6500 Harbor Town Dr, Houston, TX 77036
$-216
Cash flow
-9.4%
Cash-on-Cash Return
3.5%
Cap rate
1.2%
Rent to Value Ratio
Active
$275,000
3
bds
|
2
ba
|
1,786
sqft
|
built
1979
5427 Cairnleigh Dr, Houston, TX 77084
$-252
Cash flow
-4.8%
Cash-on-Cash Return
4.6%
Cap rate
0.8%
Rent to Value Ratio
Active
$349,999
4
bds
|
3
ba
|
3,373
sqft
|
built
1969
1102 Glouchester Ln, Houston, TX 77073
$-506
Cash flow
-7.5%
Cash-on-Cash Return
3.9%
Cap rate
0.7%
Rent to Value Ratio
Active
$200,000
2
bds
|
1
ba
|
1,429
sqft
|
built
1950
3010 Wentworth St, Houston, TX 77004
$-413
Cash flow
-10.8%
Cash-on-Cash Return
3.2%
Cap rate
0.7%
Rent to Value Ratio
Active
$998,000
5
bds
|
6
ba
|
4,274
sqft
|
built
1955
8818 Brae Acres Rd, Houston, TX 77074
$-3,165
Cash flow
-16.5%
Cash-on-Cash Return
1.9%
Cap rate
0.4%
Rent to Value Ratio
Active
$489,900
5
bds
|
5
ba
|
3,157
sqft
|
built
2021
3310 Bellwick Chase Ln, Porter, TX 77365
$-1,104
Cash flow
-11.8%
Cash-on-Cash Return
3.0%
Cap rate
0.7%
Rent to Value Ratio
Active
$324,990
4
bds
|
2
ba
|
1,730
sqft
|
built
1969
12334 Brandywyne Dr, Houston, TX 77077
$-699
Cash flow
-11.2%
Cash-on-Cash Return
3.1%
Cap rate
0.7%
Rent to Value Ratio
Active
$559,000
3
bds
|
3
ba
|
2,621
sqft
|
built
1995
13826 Aspen Cove Dr, Houston, TX 77077
$-1,497
Cash flow
-14.0%
Cash-on-Cash Return
2.5%
Cap rate
0.6%
Rent to Value Ratio
Active
$499,900
4
bds
|
3
ba
|
3,464
sqft
|
built
1991
2119 Country Club Dr, Pearland, TX 77581
$-752
Cash flow
-7.8%
Cash-on-Cash Return
3.9%
Cap rate
0.8%
Rent to Value Ratio
Active
$675,000
5
bds
|
5
ba
|
2,726
sqft
|
built
1976
15123 Lindstrom Rd, Crosby, TX 77532
$-1,759
Cash flow
-13.6%
Cash-on-Cash Return
2.6%
Cap rate
0.4%
Rent to Value Ratio
Active
$625,000
4
bds
|
5
ba
|
4,240
sqft
|
built
2000
14015 Halprin Creek Dr, Cypress, TX 77429
$-1,631
Cash flow
-13.6%
Cash-on-Cash Return
2.5%
Cap rate
0.6%
Rent to Value Ratio
Active
$350,000
3
bds
|
2
ba
|
2,119
sqft
|
built
2016
7423 Cypress Pin Oak Dr, Cypress, TX 77433
$-453
Cash flow
-6.8%
Cash-on-Cash Return
4.1%
Cap rate
0.7%
Rent to Value Ratio
Active
$599,900
5
bds
|
5
ba
|
3,740
sqft
|
built
2019
18727 Evanhale Bend Dr, Cypress, TX 77429
$-1,678
Cash flow
-14.6%
Cash-on-Cash Return
2.3%
Cap rate
0.6%
Rent to Value Ratio
Active
$430,000
3
bds
|
4
ba
|
2,244
sqft
|
built
2008
2106 Holman St, Houston, TX 77004
$-830
Cash flow
-10.1%
Cash-on-Cash Return
3.4%
Cap rate
0.7%
Rent to Value Ratio
Active
$675,000
4
bds
|
3
ba
|
2,861
sqft
|
built
1957
4414 Lemac Dr, Houston, TX 77096
$-1,033
Cash flow
-8.0%
Cash-on-Cash Return
3.8%
Cap rate
0.6%
Rent to Value Ratio
Active
$249,000
3
bds
|
3
ba
|
1,669
sqft
|
built
1981
2379 Briarwest Blvd, Houston, TX 77077
$-625
Cash flow
-13.1%
Cash-on-Cash Return
2.7%
Cap rate
0.7%
Rent to Value Ratio
Active
$375,000
3
bds
|
4
ba
|
2,138
sqft
|
built
2014
1017 Roberts St, Houston, TX 77003
$-631
Cash flow
-8.8%
Cash-on-Cash Return
3.7%
Cap rate
0.7%
Rent to Value Ratio
Active
$615,000
2
bds
|
4
ba
|
4,075
sqft
|
built
1978
7914 Woodway Dr, Houston, TX 77063
$-1,677
Cash flow
-14.2%
Cash-on-Cash Return
2.4%
Cap rate
0.6%
Rent to Value Ratio
Active
$370,000
4
bds
|
3
ba
|
2,536
sqft
|
built
2007
11526 Astoria Blvd, Houston, TX 77089
$-734
Cash flow
-10.4%
Cash-on-Cash Return
3.3%
Cap rate
0.6%
Rent to Value Ratio

Active
$310,000
3
bds
|
3
ba
|
1,867
sqft
|
built
1983
7671 Ameswood Rd, Houston, TX 77095
$-412
Cash flow
-6.9%
Cash-on-Cash Return
4.1%
Cap rate
0.6%
Rent to Value Ratio
Active
$278,685
4
bds
|
3
ba
|
1,689
sqft
|
built
1950
9611 E Avenue J, Houston, TX 77012
$-566
Cash flow
-10.6%
Cash-on-Cash Return
3.2%
Cap rate
0.5%
Rent to Value Ratio
Active
$405,000
4
bds
|
2
ba
|
2,285
sqft
|
built
2013
4222 Tranquil View Dr, Houston, TX 77084
$-952
Cash flow
-12.3%
Cash-on-Cash Return
2.9%
Cap rate
0.6%
Rent to Value Ratio
Active
$268,000
3
bds
|
2
ba
|
1,558
sqft
|
built
1975
19302 Peach Valley Cir, Houston, TX 77084
$-332
Cash flow
-6.5%
Cash-on-Cash Return
4.2%
Cap rate
0.7%
Rent to Value Ratio
Active
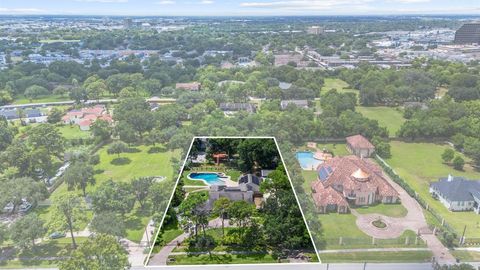
$2,300,000
3
bds
|
3
ba
|
15,349
sqft
|
built
1970
5621 Val Verde St, Houston, TX 77057
$-12,030
Cash flow
-27.3%
Cash-on-Cash Return
-0.6%
Cap rate
0.1%
Rent to Value Ratio
Active
$407,500
3
bds
|
4
ba
|
2,037
sqft
|
built
2014
1310 Delano St, Houston, TX 77003
$-740
Cash flow
-9.5%
Cash-on-Cash Return
3.5%
Cap rate
0.7%
Rent to Value Ratio
Active
$340,000
4
bds
|
2
ba
|
2,300
sqft
|
built
1978
12630 Oak Plaza Dr, Cypress, TX 77429
$-426
Cash flow
-6.5%
Cash-on-Cash Return
4.2%
Cap rate
0.7%
Rent to Value Ratio
Active
$415,000
3
bds
|
3
ba
|
1,714
sqft
|
built
2018
3801 Oxford St, Houston, TX 77022
$-559
Cash flow
-7.0%
Cash-on-Cash Return
4.1%
Cap rate
0.7%
Rent to Value Ratio
Active
$205,000
2
bds
|
3
ba
|
1,095
sqft
|
built
1985
3525 Sage Rd, Houston, TX 77056
$-1,132
Cash flow
-28.8%
Cash-on-Cash Return
-0.9%
Cap rate
0.9%
Rent to Value Ratio