Harris County Investment Properties for Sale
Browse homes for sale and investment properties in Harris County. Refine your search by price, property type, or more.
Best cash flowing properties in Harris County
Active
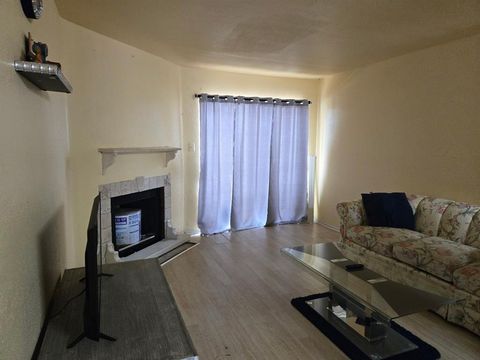
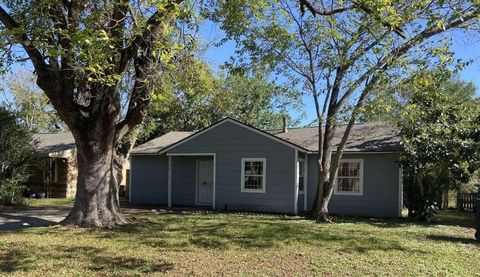
$65,000
2
bds
|
1
ba
|
834
sqft
|
built
1978
8405 Wilcrest Dr, Houston, TX 77072
$259
Cash flow
4.6%
Cash-on-Cash Return
4.8%
Cap rate
1.5%
Rent to Value Ratio
Active
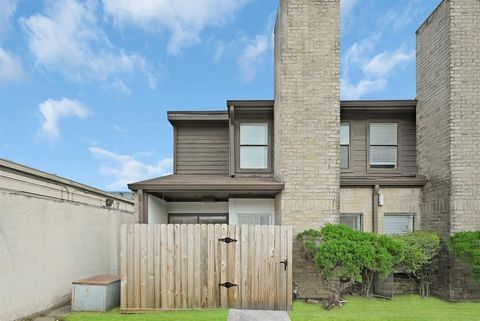
$62,000
1
bds
|
2
ba
|
1,029
sqft
|
built
1981
6633 W Airport Blvd, Houston, TX 77035
$256
Cash flow
4.8%
Cash-on-Cash Return
5.0%
Cap rate
1.8%
Rent to Value Ratio
7,390 out of 7,971 properties for sale in Harris County
Limited Results Shown
Create a free account, or log in to reveal all property listings and enjoy the complete experience.
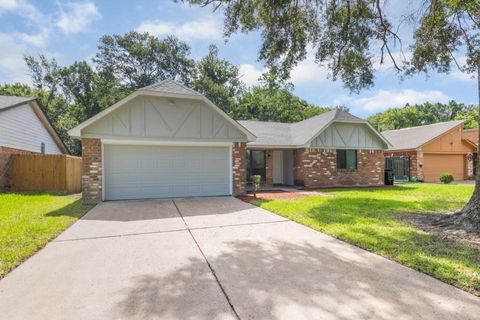
Active
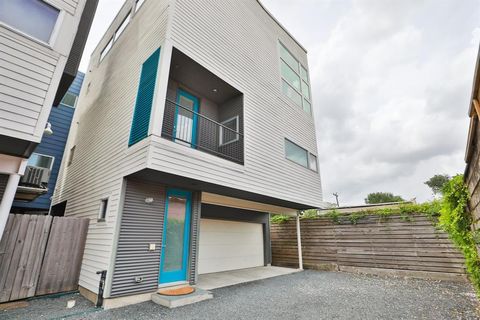
$445,000
3
bds
|
3
ba
|
2,142
sqft
|
built
2007
1909 Oakdale St, Houston, TX 77004
$-758
Cash flow
-8.9%
Cash-on-Cash Return
3.6%
Cap rate
0.7%
Rent to Value Ratio
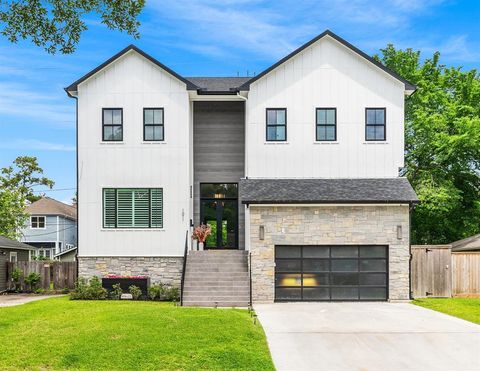
Active
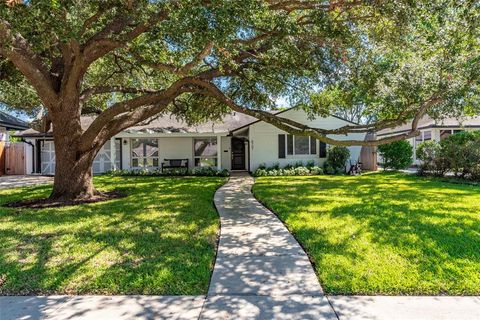
$750,000
4
bds
|
3
ba
|
2,708
sqft
|
built
1952
8707 Linkmeadow Ln, Houston, TX 77025
$-1,758
Cash flow
-12.2%
Cash-on-Cash Return
2.9%
Cap rate
0.5%
Rent to Value Ratio
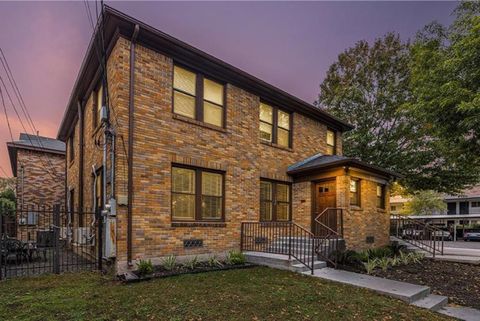
Active
$469,999
3
bds
|
4
ba
|
2,604
sqft
|
built
2010
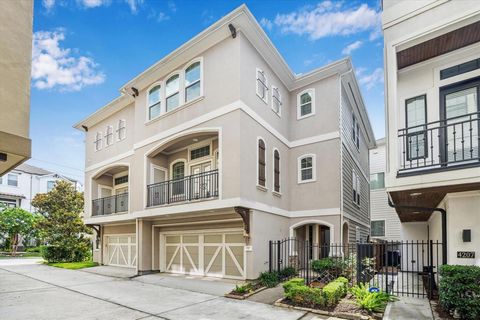
4205 Dickson St, Houston, TX 77007
$-878
Cash flow
-9.7%
Cash-on-Cash Return
3.4%
Cap rate
0.7%
Rent to Value Ratio
Active
$485,000
5
bds
|
3
ba
|
2,790
sqft
|
built
1974
15102 Torry Pines Rd, Houston, TX 77062
$-1,500
Cash flow
-16.1%
Cash-on-Cash Return
2.0%
Cap rate
0.5%
Rent to Value Ratio
Active
$315,000
4
bds
|
4
ba
|
1,550
sqft
|
built
1938
3229 Holman St, Houston, TX 77004
$-1,461
Cash flow
-24.2%
Cash-on-Cash Return
0.1%
Cap rate
0.2%
Rent to Value Ratio
Active
$1,828,000
4
bds
|
5
ba
|
4,788
sqft
|
built
2020
4019 Drummond St, Houston, TX 77025
$-6,044
Cash flow
-17.3%
Cash-on-Cash Return
1.7%
Cap rate
0.4%
Rent to Value Ratio
Active
$399,900
3
bds
|
2
ba
|
2,300
sqft
|
built
2020
5911 Westover St, Houston, TX 77033
$-1,206
Cash flow
-15.7%
Cash-on-Cash Return
2.1%
Cap rate
0.5%
Rent to Value Ratio
Active
$92,000
2
bds
|
2
ba
|
796
sqft
|
built
1984
2750 Holly Hall St, Houston, TX 77054
$31
Cash flow
1.8%
Cash-on-Cash Return
6.1%
Cap rate
1.3%
Rent to Value Ratio

Active
$330,000
3
bds
|
3
ba
|
2,115
sqft
|
built
1980
661 Bering Dr, Houston, TX 77057
$-2,375
Cash flow
-37.5%
Cash-on-Cash Return
-3.0%
Cap rate
0.7%
Rent to Value Ratio
Active
$108,500
2
bds
|
2
ba
|
1,152
sqft
|
built
1983
3770 Lovers Wood Ln, Houston, TX 77014
$-359
Cash flow
-17.3%
Cash-on-Cash Return
1.7%
Cap rate
1.2%
Rent to Value Ratio
Active
$279,000
4
bds
|
3
ba
|
2,131
sqft
|
built
2016
20454 Moon Walk Dr, Humble, TX 77338
$-433
Cash flow
-8.1%
Cash-on-Cash Return
3.8%
Cap rate
0.7%
Rent to Value Ratio
Active
$347,000
4
bds
|
3
ba
|
2,719
sqft
|
built
2015
13516 Northline Lake Dr, Houston, TX 77044
$-696
Cash flow
-10.5%
Cash-on-Cash Return
3.3%
Cap rate
0.8%
Rent to Value Ratio
Active
$910,000
3
bds
|
4
ba
|
3,045
sqft
|
built
2019
1319 Hunters Meadow Ln, Houston, TX 77055
$-232
Cash flow
-1.3%
Cash-on-Cash Return
5.4%
Cap rate
0.7%
Rent to Value Ratio
Active
$775,000
3
bds
|
3
ba
|
2,562
sqft
|
built
2005
311 E 23rd St, Houston, TX 77008
$-1,918
Cash flow
-12.9%
Cash-on-Cash Return
2.7%
Cap rate
0.6%
Rent to Value Ratio
Active
$975,000
4
bds
|
5
ba
|
4,370
sqft
|
built
2011
11722 Montmarte Blvd, Houston, TX 77082
$-4,073
Cash flow
-21.8%
Cash-on-Cash Return
0.7%
Cap rate
0.5%
Rent to Value Ratio
Active
$532,000
4
bds
|
4
ba
|
3,239
sqft
|
built
2015
18115 Stari Most Ln, Houston, TX 77044
$-1,195
Cash flow
-11.7%
Cash-on-Cash Return
3.0%
Cap rate
0.7%
Rent to Value Ratio
Active
$530,000
4
bds
|
4
ba
|
3,200
sqft
|
built
2015
5622 Chipstone Trail Ln, Katy, TX 77493
$-967
Cash flow
-9.5%
Cash-on-Cash Return
3.5%
Cap rate
0.7%
Rent to Value Ratio
Active
$285,000
3
bds
|
2
ba
|
1,730
sqft
|
built
2016
6051 Woodview Dr, Humble, TX 77396
$-436
Cash flow
-8.0%
Cash-on-Cash Return
3.8%
Cap rate
0.8%
Rent to Value Ratio
Active
$164,899
3
bds
|
3
ba
|
1,880
sqft
|
built
2021
5802 Twisted Pine Ct, Houston, TX 77039
$-66
Cash flow
-2.1%
Cash-on-Cash Return
5.2%
Cap rate
1.2%
Rent to Value Ratio
Active
$350,000
4
bds
|
4
ba
|
2,630
sqft
|
built
2016
7110 Joan Dee Ct, Spring, TX 77389
$-613
Cash flow
-9.1%
Cash-on-Cash Return
3.6%
Cap rate
0.7%
Rent to Value Ratio
Active
$350,000
3
bds
|
2
ba
|
1,884
sqft
|
built
2015
5329 Pointe Spring Xing, Spring, TX 77389
$-795
Cash flow
-11.9%
Cash-on-Cash Return
3.0%
Cap rate
0.7%
Rent to Value Ratio
Active
$2,200,000
4
bds
|
5
ba
|
5,873
sqft
|
built
2018
18 Rugged Lark Cir, Tomball, TX 77377
$-9,152
Cash flow
-21.7%
Cash-on-Cash Return
0.7%
Cap rate
0.4%
Rent to Value Ratio
Active
$440,000
4
bds
|
3
ba
|
2,769
sqft
|
built
2016
17214 Sequoia Kings Dr, Humble, TX 77346
$-1,128
Cash flow
-13.4%
Cash-on-Cash Return
2.6%
Cap rate
0.7%
Rent to Value Ratio
Active
$215,000
3
bds
|
2
ba
|
1,522
sqft
|
built
1969
12633 Memorial Dr, Houston, TX 77024
$-531
Cash flow
-12.9%
Cash-on-Cash Return
2.7%
Cap rate
0.9%
Rent to Value Ratio

Active
$274,900
3
bds
|
2
ba
|
1,707
sqft
|
built
2018
14726 Meadow Acre Trl, Houston, TX 77049
$-628
Cash flow
-11.9%
Cash-on-Cash Return
2.9%
Cap rate
0.7%
Rent to Value Ratio
Active
$227,500
2
bds
|
2
ba
|
1,226
sqft
|
built
1978
4747 Nasa Pkwy, Seabrook, TX 77586
$-565
Cash flow
-13.0%
Cash-on-Cash Return
2.7%
Cap rate
1.0%
Rent to Value Ratio
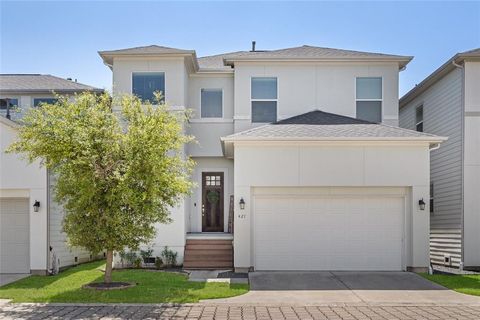
Active
$349,000
3
bds
|
3
ba
|
1,958
sqft
|
built
2018
427 Yale Oaks Ln, Houston, TX 77091
$-516
Cash flow
-7.7%
Cash-on-Cash Return
3.9%
Cap rate
0.8%
Rent to Value Ratio
Active
$512,000
4
bds
|
3
ba
|
2,526
sqft
|
built
2020
13710 Brahman Valley Ct, Cypress, TX 77429
$-1,454
Cash flow
-14.8%
Cash-on-Cash Return
2.3%
Cap rate
0.5%
Rent to Value Ratio
Active
$214,099
3
bds
|
2
ba
|
1,560
sqft
|
built
1950
5131 Nassau Rd, Houston, TX 77021
$-173
Cash flow
-4.2%
Cash-on-Cash Return
4.7%
Cap rate
0.7%
Rent to Value Ratio

Active
$262,000
3
bds
|
2
ba
|
1,100
sqft
|
built
1953
2125 Kingsdale Dr, Deer Park, TX 77536
$-304
Cash flow
-6.1%
Cash-on-Cash Return
4.3%
Cap rate
0.7%
Rent to Value Ratio
Active
$239,900
3
bds
|
2
ba
|
1,874
sqft
|
built
1978
7726 Ashmole Ln, Houston, TX 77088
$-219
Cash flow
-4.8%
Cash-on-Cash Return
4.6%
Cap rate
0.8%
Rent to Value Ratio
Active
$1,639,000
5
bds
|
5
ba
|
4,274
sqft
|
built
2023
1011 Wynnwood Ln, Houston, TX 77008
$-3,208
Cash flow
-10.2%
Cash-on-Cash Return
3.3%
Cap rate
0.6%
Rent to Value Ratio

Active
$139,000
3
bds
|
1
ba
|
857
sqft
|
built
1940
410 Clinton Park St, Houston, TX 77029
$-118
Cash flow
-4.4%
Cash-on-Cash Return
4.7%
Cap rate
0.7%
Rent to Value Ratio
Active
$1,125,000
5
bds
|
3
ba
|
3,748
sqft
|
built
1950
1902 Elmen St, Houston, TX 77019
$-5,532
Cash flow
-25.7%
Cash-on-Cash Return
-0.2%
Cap rate
0.2%
Rent to Value Ratio
Active
$290,000
3
bds
|
3
ba
|
1,842
sqft
|
built
2021
5530 Evanston Ln, Pasadena, TX 77505
$-459
Cash flow
-8.3%
Cash-on-Cash Return
3.8%
Cap rate
0.8%
Rent to Value Ratio
Active
$185,000
3
bds
|
2
ba
|
1,635
sqft
|
built
1978
3030 Ciderwood Dr, Spring, TX 77373
$-233
Cash flow
-6.6%
Cash-on-Cash Return
4.2%
Cap rate
0.9%
Rent to Value Ratio
Active
$240,000
3
bds
|
3
ba
|
1,939
sqft
|
built
2016
17035 Wilthorne Gardens Ct, Houston, TX 77084
$-491
Cash flow
-10.7%
Cash-on-Cash Return
3.2%
Cap rate
0.8%
Rent to Value Ratio
Active
$399,999
3
bds
|
2
ba
|
2,131
sqft
|
built
2016
9135 Monarch Field Ln, Cypress, TX 77433
$-1,006
Cash flow
-13.1%
Cash-on-Cash Return
2.7%
Cap rate
0.7%
Rent to Value Ratio