Broward County Investment Properties for Sale
Browse homes for sale and investment properties in Broward County. Refine your search by price, property type, or more.
Best cash flowing properties in Broward County
Active
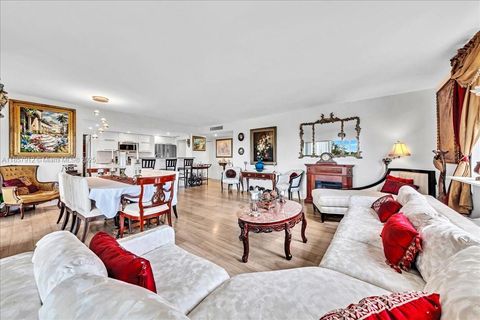
$225,000
2
bds
|
2
ba
|
984
sqft
|
built
1970
4500 N Federal Hwy, Lighthouse Point, FL 33064
$-136
Cash flow
-3.2%
Cash-on-Cash Return
5.4%
Cap rate
0.8%
Rent to Value Ratio
Active
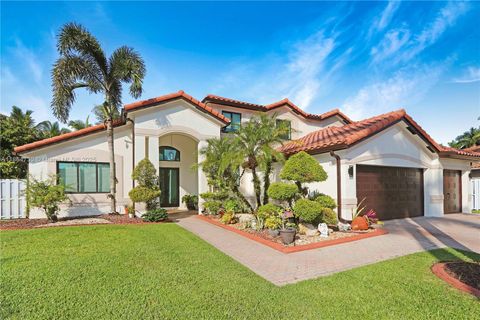
$390,000
3
bds
|
2
ba
|
1,296
sqft
|
built
1959
3433 SW 12th Pl, Fort Lauderdale, FL 33312
$-308
Cash flow
-4.1%
Cash-on-Cash Return
5.2%
Cap rate
0.7%
Rent to Value Ratio
9,720 out of 11,320 properties for sale in Broward County
Limited Results Shown
Create a free account, or log in to reveal all property listings and enjoy the complete experience.
Active
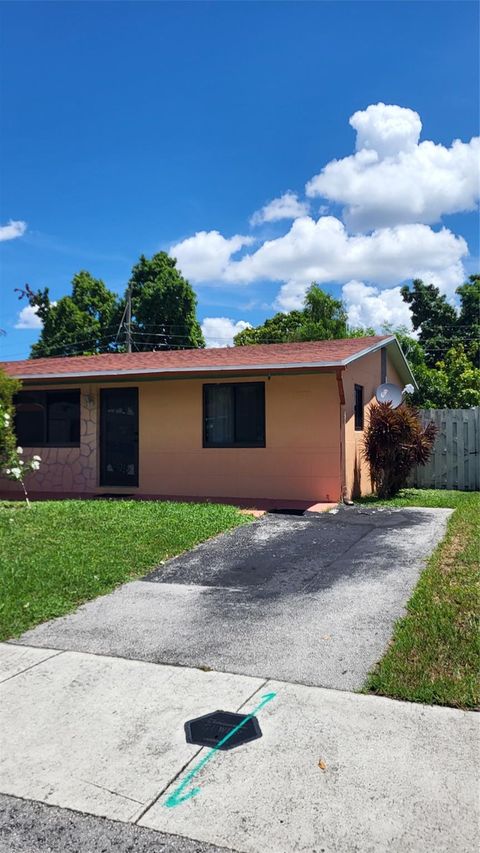
$720,000
3
bds
|
3
ba
|
1,701
sqft
|
built
1991
10202 Caracas St, Hollywood, FL 33026
$-1,751
Cash flow
-12.7%
Cash-on-Cash Return
3.2%
Cap rate
0.6%
Rent to Value Ratio
Active
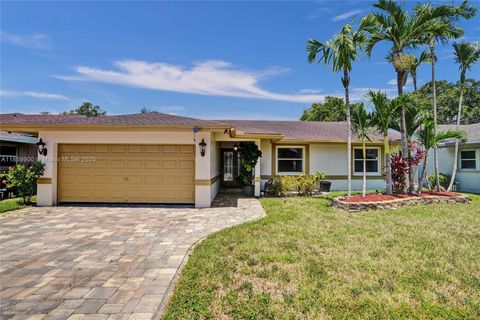
$430,000
2
bds
|
2
ba
|
1,000
sqft
|
built
1973
1280 SE 2nd Ct, Fort Lauderdale, FL 33301
$-1,679
Cash flow
-20.4%
Cash-on-Cash Return
1.5%
Cap rate
0.6%
Rent to Value Ratio
Active
$269,000
2
bds
|
1
ba
|
983
sqft
|
built
2003
1919 Van Buren St, Hollywood, FL 33020
$-906
Cash flow
-17.6%
Cash-on-Cash Return
2.1%
Cap rate
0.9%
Rent to Value Ratio
Active
$799,000
4
bds
|
4
ba
|
2,762
sqft
|
built
1988
5449 NW 86th Ter, Coral Springs, FL 33067
$-921
Cash flow
-6.0%
Cash-on-Cash Return
4.8%
Cap rate
0.7%
Rent to Value Ratio
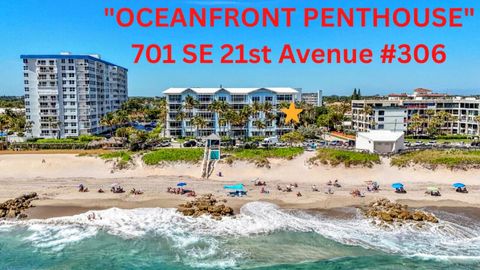
Active
$2,299,000
3
bds
|
4
ba
|
2,630
sqft
|
built
2006
701 SE 21st Ave, Deerfield Beach, FL 33441
$-9,492
Cash flow
-21.5%
Cash-on-Cash Return
1.2%
Cap rate
0.3%
Rent to Value Ratio

Active
$275,000
2
bds
|
2
ba
|
1,370
sqft
|
built
1981
6800 Cypress Rd, Plantation, FL 33317
$-1,184
Cash flow
-22.5%
Cash-on-Cash Return
1.0%
Cap rate
0.8%
Rent to Value Ratio
Active
$618,000
3
bds
|
2
ba
|
1,414
sqft
|
built
1958
7490 Buchanan St, Hollywood, FL 33024
$-1,291
Cash flow
-10.9%
Cash-on-Cash Return
3.6%
Cap rate
0.7%
Rent to Value Ratio
Active
$335,000
2
bds
|
2
ba
|
1,372
sqft
|
built
1975
3800 Hillcrest Dr, Hollywood, FL 33021
$-554
Cash flow
-8.6%
Cash-on-Cash Return
4.2%
Cap rate
0.9%
Rent to Value Ratio
Active
$1,100,000
5
bds
|
3
ba
|
3,305
sqft
|
built
1999
3940 SW 144th Ter, Miramar, FL 33027
$-3,043
Cash flow
-14.4%
Cash-on-Cash Return
2.8%
Cap rate
0.5%
Rent to Value Ratio
Active
$299,900
2
bds
|
1
ba
|
873
sqft
|
built
1964
1936 SW 67th Ave, North Lauderdale, FL 33068
$-624
Cash flow
-10.9%
Cash-on-Cash Return
3.6%
Cap rate
0.7%
Rent to Value Ratio
Active
$559,000
3
bds
|
2
ba
|
1,853
sqft
|
built
1989
4365 NW 103rd Ter, Sunrise, FL 33351
$-756
Cash flow
-7.1%
Cash-on-Cash Return
4.5%
Cap rate
0.7%
Rent to Value Ratio
Active
$465,000
2
bds
|
3
ba
|
1,750
sqft
|
built
1975
1001 Three Islands Blvd, Hallandale Beach, FL 33009
$-951
Cash flow
-10.7%
Cash-on-Cash Return
3.7%
Cap rate
0.8%
Rent to Value Ratio
Active
$615,000
3
bds
|
3
ba
|
1,816
sqft
|
built
1999
4907 Pelican Mnr, Coconut Creek, FL 33073
$-1,417
Cash flow
-12.0%
Cash-on-Cash Return
3.4%
Cap rate
0.6%
Rent to Value Ratio
Active
$715,000
3
bds
|
3
ba
|
1,650
sqft
|
built
1980
3225 NE 13th St, Pompano Beach, FL 33062
$-1,879
Cash flow
-13.7%
Cash-on-Cash Return
3.0%
Cap rate
0.5%
Rent to Value Ratio
Active
$739,000
bds
|
0
ba
|
2,716
sqft
|
built
1976
575 NW 41st St, Oakland Park, FL 33309
$-3,536
Cash flow
-25.0%
Cash-on-Cash Return
0.4%
Cap rate
0.2%
Rent to Value Ratio

Active
$190,000
1
bds
|
2
ba
|
900
sqft
|
built
1975
3253 Foxcroft Rd, Miramar, FL 33025
$-512
Cash flow
-14.1%
Cash-on-Cash Return
2.9%
Cap rate
1.0%
Rent to Value Ratio
Active
$539,000
2
bds
|
1
ba
|
1,307
sqft
|
built
1950
1923 Dewey St, Hollywood, FL 33020
$-846
Cash flow
-8.2%
Cash-on-Cash Return
4.3%
Cap rate
0.6%
Rent to Value Ratio
Active
$503,999
4
bds
|
3
ba
|
1,804
sqft
|
built
1962
671 SW 14th St, Deerfield Beach, FL 33441
$-526
Cash flow
-5.4%
Cash-on-Cash Return
4.9%
Cap rate
0.8%
Rent to Value Ratio
Active
$899,000
3
bds
|
3
ba
|
1,952
sqft
|
built
1959
333 Sunset Dr, Fort Lauderdale, FL 33301
$-3,385
Cash flow
-19.6%
Cash-on-Cash Return
1.6%
Cap rate
0.7%
Rent to Value Ratio
Active
$390,000
2
bds
|
2
ba
|
1,500
sqft
|
built
1986
1460 Sheridan St, Hollywood, FL 33020
$-1,454
Cash flow
-19.5%
Cash-on-Cash Return
1.7%
Cap rate
0.7%
Rent to Value Ratio
Active
$670,000
2
bds
|
2
ba
|
1,176
sqft
|
built
1969
3801 S Ocean Dr, Hollywood, FL 33019
$-2,622
Cash flow
-20.4%
Cash-on-Cash Return
1.5%
Cap rate
0.7%
Rent to Value Ratio
Active
$324,999
1
bds
|
1
ba
|
700
sqft
|
built
1977
531 N Ocean Blvd, Pompano Beach, FL 33062
$-1,176
Cash flow
-18.9%
Cash-on-Cash Return
1.8%
Cap rate
0.8%
Rent to Value Ratio
Active
$389,900
1
bds
|
1
ba
|
720
sqft
|
built
2002
3020 NE 32nd Ave, Fort Lauderdale, FL 33308
$-1,851
Cash flow
-24.8%
Cash-on-Cash Return
0.4%
Cap rate
0.6%
Rent to Value Ratio
Active
$189,900
1
bds
|
2
ba
|
764
sqft
|
built
1985
721 N Pine Island Rd, Plantation, FL 33324
$-376
Cash flow
-10.3%
Cash-on-Cash Return
3.8%
Cap rate
0.9%
Rent to Value Ratio
Active
$249,500
2
bds
|
2
ba
|
1,000
sqft
|
built
1965
141 NE 10th Ave, Hallandale Beach, FL 33009
$-680
Cash flow
-14.2%
Cash-on-Cash Return
2.9%
Cap rate
0.9%
Rent to Value Ratio
Active
$345,000
3
bds
|
3
ba
|
1,720
sqft
|
built
1982
4299 Coral Springs Dr, Coral Springs, FL 33065
$-661
Cash flow
-10.0%
Cash-on-Cash Return
3.8%
Cap rate
0.8%
Rent to Value Ratio
Active
$849,900
4
bds
|
3
ba
|
2,687
sqft
|
built
1988
6335 NW 52nd St, Coral Springs, FL 33067
$-1,596
Cash flow
-9.8%
Cash-on-Cash Return
3.9%
Cap rate
0.6%
Rent to Value Ratio
Active
$399,900
1
bds
|
2
ba
|
930
sqft
|
built
1970
1500 S Ocean Blvd, Pompano Beach, FL 33062
$-1,624
Cash flow
-21.2%
Cash-on-Cash Return
1.3%
Cap rate
0.7%
Rent to Value Ratio
Active
$199,999
1
bds
|
1
ba
|
816
sqft
|
built
1998
913 Coral Club Dr, Coral Springs, FL 33071
$-406
Cash flow
-10.6%
Cash-on-Cash Return
3.7%
Cap rate
0.8%
Rent to Value Ratio
Active
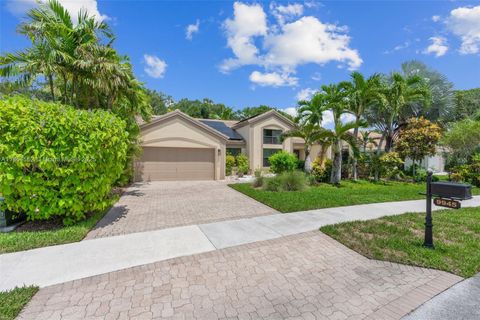
$949,000
4
bds
|
3
ba
|
2,406
sqft
|
built
2000
9945 W Tree Tops Ct, Davie, FL 33328
$-2,520
Cash flow
-13.9%
Cash-on-Cash Return
3.0%
Cap rate
0.5%
Rent to Value Ratio
Active
$699,999
3
bds
|
2
ba
|
1,821
sqft
|
built
1997
18581 NW 23rd St, Pembroke Pines, FL 33029
$-2,226
Cash flow
-16.6%
Cash-on-Cash Return
2.3%
Cap rate
0.5%
Rent to Value Ratio
Active
$555,000
4
bds
|
2
ba
|
1,293
sqft
|
built
1950
802 S 24th Ave, Hollywood, FL 33020
$-1,123
Cash flow
-10.6%
Cash-on-Cash Return
3.7%
Cap rate
0.6%
Rent to Value Ratio
Active
$190,000
2
bds
|
2
ba
|
827
sqft
|
built
1988
10709 W Clairmont Cir, Tamarac, FL 33321
$-554
Cash flow
-15.2%
Cash-on-Cash Return
2.6%
Cap rate
0.9%
Rent to Value Ratio
Active
$849,000
3
bds
|
2
ba
|
1,440
sqft
|
built
1957
925 SE 14th Ave, Deerfield Beach, FL 33441
$-1,570
Cash flow
-9.6%
Cash-on-Cash Return
3.9%
Cap rate
0.5%
Rent to Value Ratio
Active
$650,000
3
bds
|
4
ba
|
1,578
sqft
|
built
2004
530 NE 7th Ave, Fort Lauderdale, FL 33301
$-1,994
Cash flow
-16.0%
Cash-on-Cash Return
2.5%
Cap rate
0.6%
Rent to Value Ratio
Active
$660,000
3
bds
|
3
ba
|
1,748
sqft
|
built
1997
1125 Doveplum St, Hollywood, FL 33019
$-1,683
Cash flow
-13.3%
Cash-on-Cash Return
3.1%
Cap rate
0.5%
Rent to Value Ratio
Active
$750,000
2
bds
|
2
ba
|
1,063
sqft
|
built
1965
1057 Hillsboro Mile, Hillsboro Beach, FL 33062
$-3,387
Cash flow
-23.6%
Cash-on-Cash Return
0.7%
Cap rate
0.5%
Rent to Value Ratio
Active
$724,999
3
bds
|
2
ba
|
2,056
sqft
|
built
2002
12430 NW 78th Mnr, Parkland, FL 33076
$-1,463
Cash flow
-10.5%
Cash-on-Cash Return
3.7%
Cap rate
0.7%
Rent to Value Ratio