Milwaukee County Investment Properties for Sale
Browse homes for sale and investment properties in Milwaukee County. Refine your search by price, property type, or more.
Best cash flowing properties in Milwaukee County

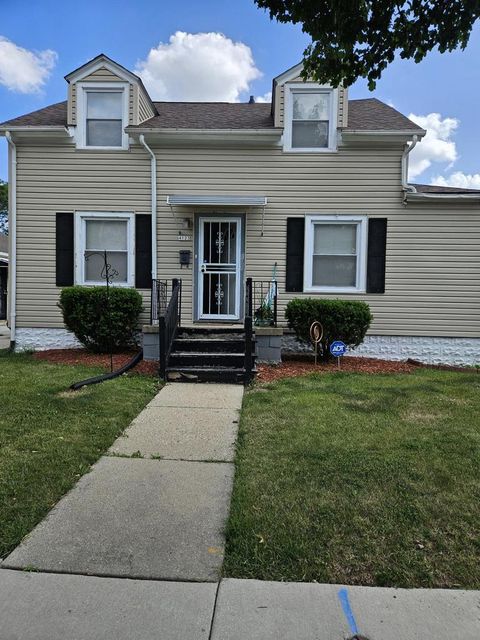
Active
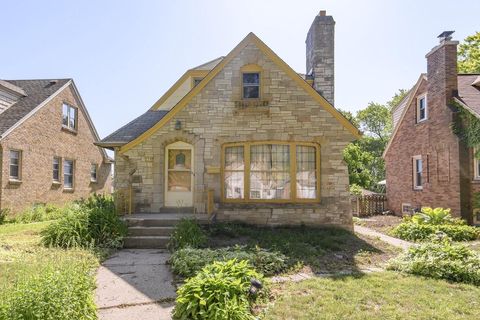
$35,000
3
bds
|
0
ba
|
890
sqft
|
built
1892
2966 N 23rd St, Milwaukee, WI 53206
$629
Cash flow
20.9%
Cash-on-Cash Return
21.6%
Cap rate
2.9%
Rent to Value Ratio

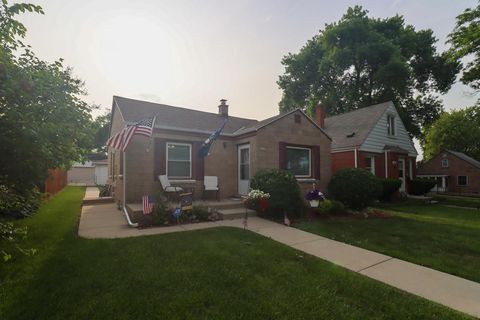
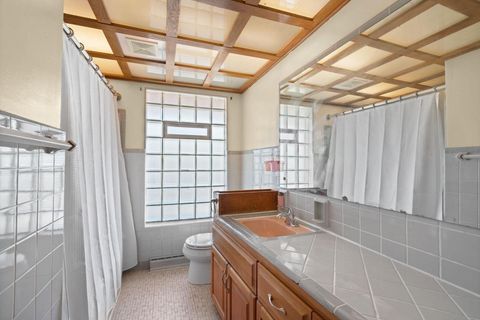
Active
$102,800
5
bds
|
0
ba
|
1,700
sqft
|
built
1915
3252 N 29th St, Milwaukee, WI 53216
$347
Cash flow
17.6%
Cash-on-Cash Return
10.2%
Cap rate
1.4%
Rent to Value Ratio
1,085 out of 1,259 properties for sale in Milwaukee County
Limited Results Shown
Create a free account, or log in to reveal all property listings and enjoy the complete experience.

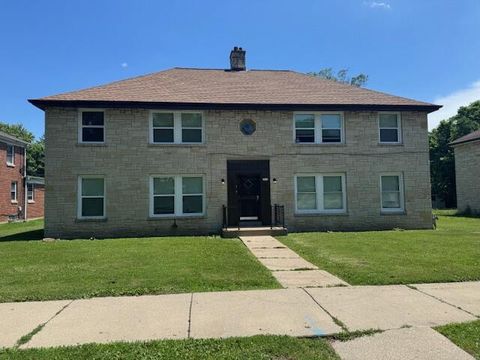
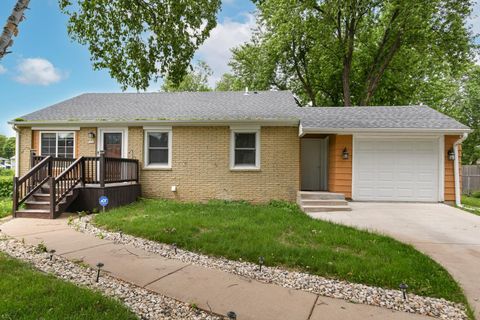
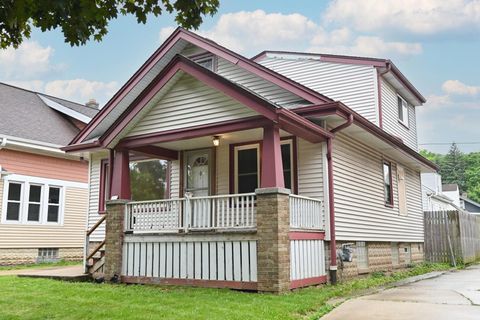
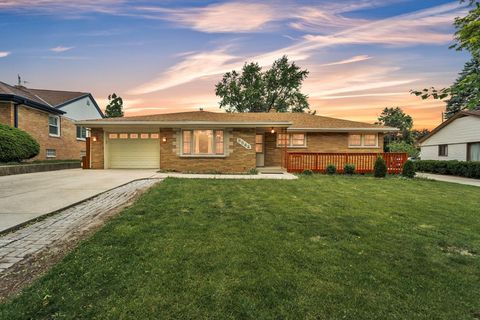
Active
$269,900
3
bds
|
0
ba
|
1,585
sqft
|
built
1951
3667 S 21st St, Milwaukee, WI 53221
$-658
Cash flow
-12.7%
Cash-on-Cash Return
3.2%
Cap rate
0.6%
Rent to Value Ratio

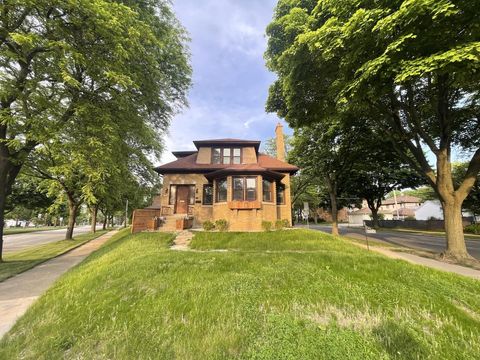
Active
$449,000
bds
|
0
ba
|
3,546
sqft
|
built
1890
905 E Clarke St, Milwaukee, WI 53212
$-1,777
Cash flow
-20.6%
Cash-on-Cash Return
1.4%
Cap rate
0.4%
Rent to Value Ratio

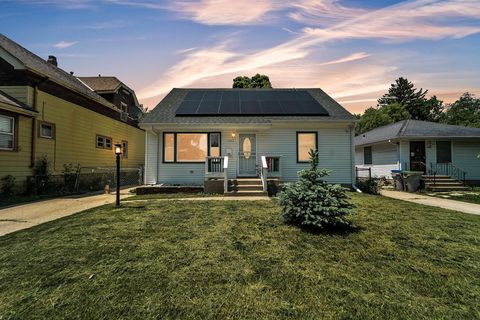
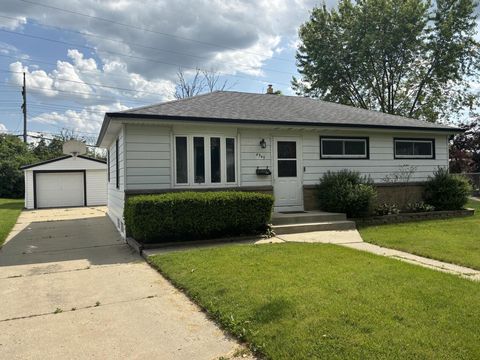
Active
$249,900
3
bds
|
0
ba
|
1,646
sqft
|
built
1936
6229 N 118th St, Milwaukee, WI 53225
$-234
Cash flow
-4.9%
Cash-on-Cash Return
5.0%
Cap rate
0.8%
Rent to Value Ratio
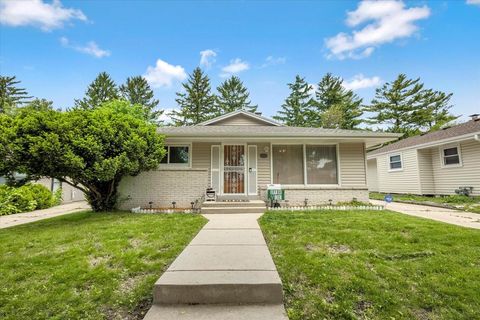
Active
$175,000
3
bds
|
0
ba
|
1,268
sqft
|
built
1922
4123 W Fairmount Ave, Milwaukee, WI 53209
$-146
Cash flow
-4.4%
Cash-on-Cash Return
5.1%
Cap rate
0.8%
Rent to Value Ratio
Active
$193,000
2
bds
|
0
ba
|
857
sqft
|
built
1949
2807 S 49th St, Milwaukee, WI 53219
$-357
Cash flow
-9.7%
Cash-on-Cash Return
3.9%
Cap rate
0.7%
Rent to Value Ratio
Active
$425,900
bds
|
0
ba
|
0
sqft
|
built
1947
3910 N Sherman Blvd, Milwaukee, WI 53216
$-1,787
Cash flow
-21.9%
Cash-on-Cash Return
1.1%
Cap rate
0.3%
Rent to Value Ratio
Active
$284,900
3
bds
|
0
ba
|
1,012
sqft
|
built
1950
2750 N 86th St, Milwaukee, WI 53222
$-434
Cash flow
-7.9%
Cash-on-Cash Return
4.3%
Cap rate
0.7%
Rent to Value Ratio
Active
$310,000
4
bds
|
0
ba
|
1,670
sqft
|
built
1959
3268 W Birchwood Ave, Milwaukee, WI 53221
$-845
Cash flow
-14.2%
Cash-on-Cash Return
3.0%
Cap rate
0.6%
Rent to Value Ratio
Active
$424,900
2
bds
|
0
ba
|
1,354
sqft
|
built
1926
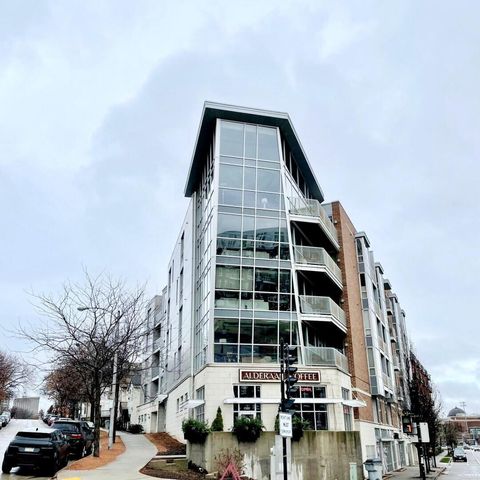
741 N Milwaukee St, Milwaukee, WI 53202
$-1,008
Cash flow
-12.4%
Cash-on-Cash Return
3.4%
Cap rate
0.6%
Rent to Value Ratio
Active
$99,000
4
bds
|
0
ba
|
1,860
sqft
|
built
1923
1920 W Vienna Ave, Milwaukee, WI 53206
$-71
Cash flow
-3.7%
Cash-on-Cash Return
5.3%
Cap rate
0.9%
Rent to Value Ratio
Active
$130,000
4
bds
|
0
ba
|
2,563
sqft
|
built
1929
3013 N 57th St, Milwaukee, WI 53210
$-145
Cash flow
-5.8%
Cash-on-Cash Return
4.8%
Cap rate
0.9%
Rent to Value Ratio
Active
$325,000
4
bds
|
0
ba
|
1,120
sqft
|
built
1926
203 N 71st St, Milwaukee, WI 53213
$-966
Cash flow
-15.5%
Cash-on-Cash Return
2.6%
Cap rate
0.5%
Rent to Value Ratio
Active
$329,000
6
bds
|
0
ba
|
2,719
sqft
|
built
1928
3402 N 51st Blvd, Milwaukee, WI 53216
$-1,045
Cash flow
-16.6%
Cash-on-Cash Return
2.3%
Cap rate
0.4%
Rent to Value Ratio
Active
$219,000
3
bds
|
0
ba
|
1,012
sqft
|
built
1953
4951 N 49th St, Milwaukee, WI 53218
$-516
Cash flow
-12.3%
Cash-on-Cash Return
3.3%
Cap rate
0.6%
Rent to Value Ratio
Active
$224,900
3
bds
|
0
ba
|
1,618
sqft
|
built
1963
4720 W Brentwood Ave, Milwaukee, WI 53223
$-434
Cash flow
-10.1%
Cash-on-Cash Return
3.8%
Cap rate
0.6%
Rent to Value Ratio
Active
$219,900
4
bds
|
0
ba
|
1,464
sqft
|
built
1940
3940 N 64th St, Milwaukee, WI 53216
$-405
Cash flow
-9.6%
Cash-on-Cash Return
3.9%
Cap rate
0.6%
Rent to Value Ratio
Active
$335,000
4
bds
|
0
ba
|
1,820
sqft
|
built
1956
5110 W Cleveland Ave, Milwaukee, WI 53219
$-795
Cash flow
-12.4%
Cash-on-Cash Return
3.3%
Cap rate
0.6%
Rent to Value Ratio
Active
$410,000
3
bds
|
0
ba
|
2,175
sqft
|
built
1958
5542 W Jerelyn Pl, Milwaukee, WI 53219
$-985
Cash flow
-12.5%
Cash-on-Cash Return
3.3%
Cap rate
0.5%
Rent to Value Ratio
Active
$300,000
3
bds
|
0
ba
|
864
sqft
|
built
1956
4945 W Tesch Ave, Milwaukee, WI 53220
$-969
Cash flow
-16.9%
Cash-on-Cash Return
2.3%
Cap rate
0.5%
Rent to Value Ratio
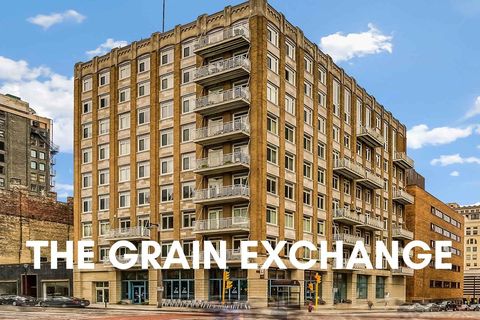
Active
$315,000
2
bds
|
0
ba
|
1,140
sqft
|
built
2008
1541 N Jefferson St, Milwaukee, WI 53202
$-831
Cash flow
-13.8%
Cash-on-Cash Return
3.0%
Cap rate
0.6%
Rent to Value Ratio
Active
$110,000
1
bds
|
0
ba
|
863
sqft
|
built
1974
9002 W Lisbon Ave, Milwaukee, WI 53222
$129
Cash flow
6.1%
Cash-on-Cash Return
7.5%
Cap rate
1.1%
Rent to Value Ratio
Active
$279,900
2
bds
|
0
ba
|
934
sqft
|
built
1926
3265 S Swain Ct, Milwaukee, WI 53207
$-705
Cash flow
-13.1%
Cash-on-Cash Return
3.1%
Cap rate
0.6%
Rent to Value Ratio
Active
$320,000
3
bds
|
0
ba
|
1,574
sqft
|
built
1923
2221 N 60th St, Milwaukee, WI 53208
$-390
Cash flow
-6.4%
Cash-on-Cash Return
4.7%
Cap rate
0.8%
Rent to Value Ratio
Active
$469,900
3
bds
|
0
ba
|
2,258
sqft
|
built
2016
7236 N Beau Ave, Milwaukee, WI 53224
$-1,404
Cash flow
-15.6%
Cash-on-Cash Return
2.6%
Cap rate
0.5%
Rent to Value Ratio

Active
$150,000
4
bds
|
0
ba
|
2,032
sqft
|
built
1914
2832 W Meinecke Ave, Milwaukee, WI 53210
$-298
Cash flow
-10.4%
Cash-on-Cash Return
3.8%
Cap rate
0.5%
Rent to Value Ratio

Active
$113,900
2
bds
|
0
ba
|
672
sqft
|
built
1954
5750 N 62nd St, Milwaukee, WI 53218
$-77
Cash flow
-3.5%
Cash-on-Cash Return
5.3%
Cap rate
0.8%
Rent to Value Ratio

Active
$215,000
4
bds
|
0
ba
|
2,289
sqft
|
built
1930
4302 N 65th St, Milwaukee, WI 53216
$-273
Cash flow
-6.6%
Cash-on-Cash Return
4.6%
Cap rate
0.6%
Rent to Value Ratio
Active
$239,000
4
bds
|
0
ba
|
1,800
sqft
|
built
1933
6819 W Hampton Ave, Milwaukee, WI 53218
$-291
Cash flow
-6.4%
Cash-on-Cash Return
4.7%
Cap rate
0.7%
Rent to Value Ratio

Active
$414,900
4
bds
|
0
ba
|
2,416
sqft
|
built
1976
10500 W Good Hope Rd, Milwaukee, WI 53224
$-1,069
Cash flow
-13.4%
Cash-on-Cash Return
3.1%
Cap rate
0.6%
Rent to Value Ratio

Active
$595,000
4
bds
|
0
ba
|
0
sqft
|
built
1914
2518 N 41st St, Milwaukee, WI 53210
$-2,361
Cash flow
-20.7%
Cash-on-Cash Return
1.4%
Cap rate
0.2%
Rent to Value Ratio

Active
$399,000
9
bds
|
0
ba
|
3,380
sqft
|
built
1973
5246 N 54th St, Milwaukee, WI 53218
$-1,346
Cash flow
-17.6%
Cash-on-Cash Return
2.1%
Cap rate
0.5%
Rent to Value Ratio

Active
$209,500
1
bds
|
0
ba
|
653
sqft
|
built
1921
215 W Maple St, Milwaukee, WI 53204
$-546
Cash flow
-13.6%
Cash-on-Cash Return
3.0%
Cap rate
0.6%
Rent to Value Ratio

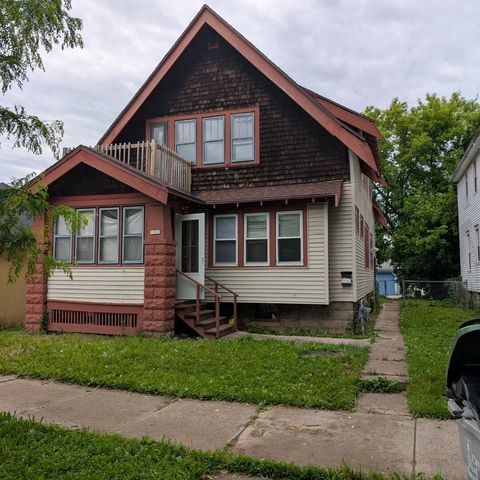
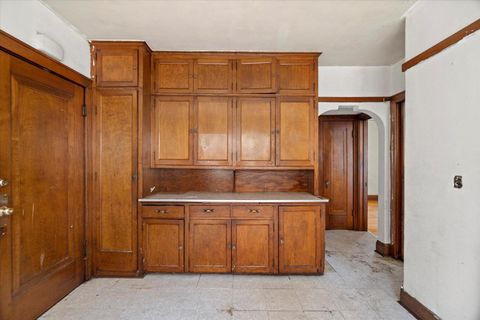
Active
$124,900
4
bds
|
0
ba
|
2,344
sqft
|
built
1928
4465 N 27th St, Milwaukee, WI 53209
$98
Cash flow
4.1%
Cash-on-Cash Return
7.1%
Cap rate
1.0%
Rent to Value Ratio

Active
$94,900
1
bds
|
0
ba
|
625
sqft
|
built
1971
11926 W Mill Rd, Milwaukee, WI 53225
$-139
Cash flow
-7.6%
Cash-on-Cash Return
4.4%
Cap rate
0.8%
Rent to Value Ratio
Active
$199,900
3
bds
|
0
ba
|
1,454
sqft
|
built
1951
4709 N 44th St, Milwaukee, WI 53218
$-19,729
Cash flow
-514.9%
Cash-on-Cash Return
-112.3%
Cap rate
0.7%
Rent to Value Ratio

Active
$250,000
3
bds
|
0
ba
|
1,200
sqft
|
built
1966
5804 W Boehlke Ave, Milwaukee, WI 53223
$-425
Cash flow
-8.9%
Cash-on-Cash Return
4.1%
Cap rate
0.7%
Rent to Value Ratio
Active
$279,900
3
bds
|
0
ba
|
1,091
sqft
|
built
1950
2829 N 90th St, Milwaukee, WI 53222
$-511
Cash flow
-9.5%
Cash-on-Cash Return
4.0%
Cap rate
0.6%
Rent to Value Ratio
Active
$209,000
3
bds
|
0
ba
|
1,374
sqft
|
built
1959
8447 W Denver Ave, Milwaukee, WI 53224
$-405
Cash flow
-10.1%
Cash-on-Cash Return
3.8%
Cap rate
0.7%
Rent to Value Ratio