Milwaukee County Investment Properties for Sale
Browse homes for sale and investment properties in Milwaukee County. Refine your search by price, property type, or more.
Best cash flowing properties in Milwaukee County
Active
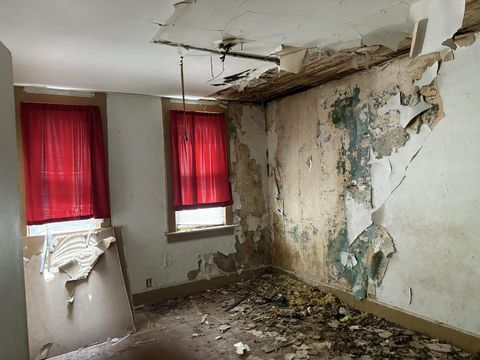
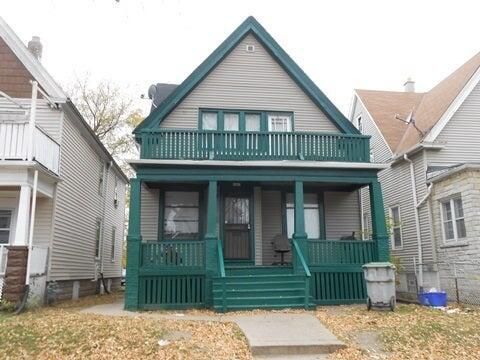
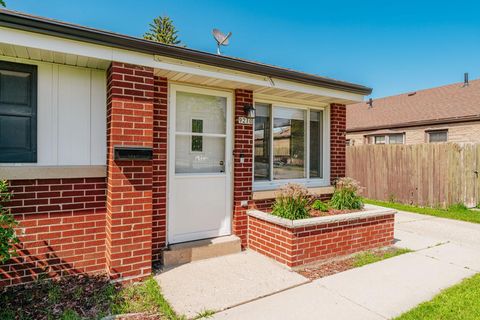
$49,900
2
bds
|
0
ba
|
800
sqft
|
built
1889
112 W Hadley St, Milwaukee, WI 53212
$709
Cash flow
16.6%
Cash-on-Cash Return
17.1%
Cap rate
2.2%
Rent to Value Ratio
Active
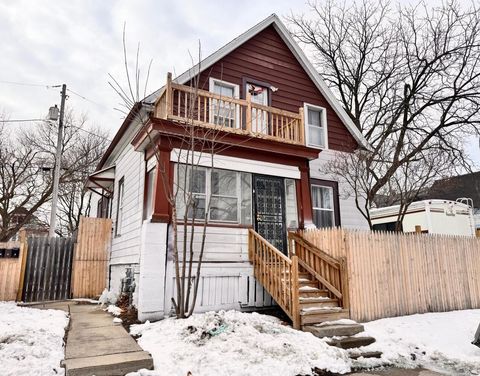
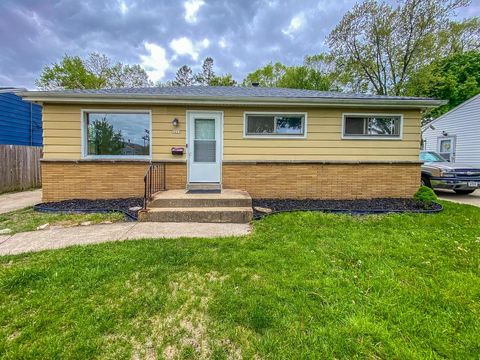
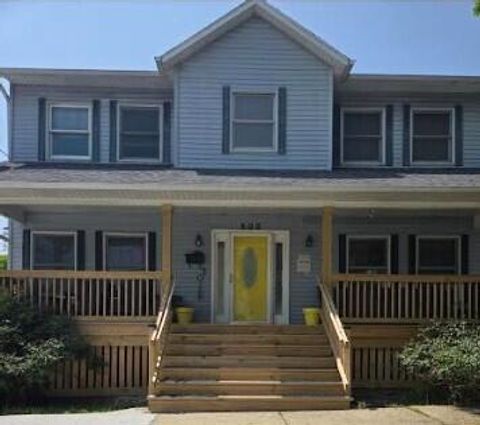
$69,900
4
bds
|
0
ba
|
1,500
sqft
|
built
1899
3039 N 10th Ln, Milwaukee, WI 53206
$632
Cash flow
10.5%
Cash-on-Cash Return
10.8%
Cap rate
1.4%
Rent to Value Ratio
1,165 out of 1,353 properties for sale in Milwaukee County
Limited Results Shown
Create a free account, or log in to reveal all property listings and enjoy the complete experience.
Active
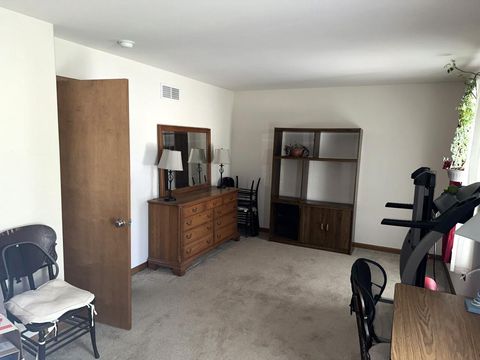
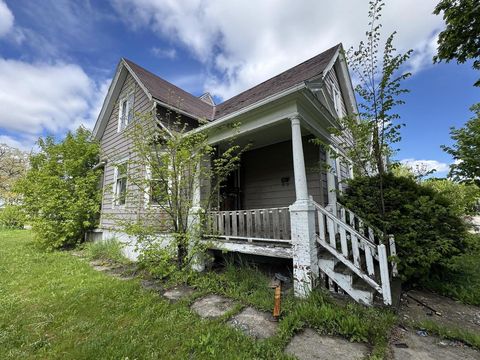
$349,900
4
bds
|
3
ba
|
2,414
sqft
|
built
2008
2367 N Dr William Finlayson St, Milwaukee, WI 53212
$-970
Cash flow
-14.5%
Cash-on-Cash Return
2.8%
Cap rate
0.5%
Rent to Value Ratio
Active
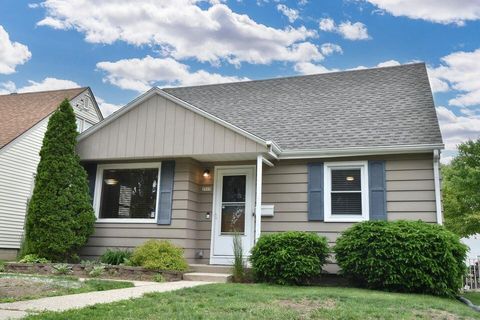
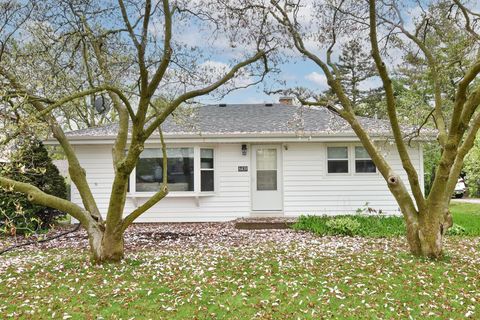
$279,900
3
bds
|
1
ba
|
1,084
sqft
|
built
1953
2519 S 70th St, Milwaukee, WI 53219
$-644
Cash flow
-12.0%
Cash-on-Cash Return
3.4%
Cap rate
0.6%
Rent to Value Ratio
Active
$114,900
4
bds
|
0
ba
|
1,863
sqft
|
built
1907
2847 N 26th St, Milwaukee, WI 53206
$52
Cash flow
2.4%
Cash-on-Cash Return
6.7%
Cap rate
0.9%
Rent to Value Ratio

Active
$249,900
2
bds
|
0
ba
|
1,375
sqft
|
built
1974
4161 W College Ave, Milwaukee, WI 53221
$-466
Cash flow
-9.7%
Cash-on-Cash Return
3.9%
Cap rate
0.6%
Rent to Value Ratio

Active
$279,900
3
bds
|
0
ba
|
1,172
sqft
|
built
1959
3268 S 86th St, Milwaukee, WI 53227
$-705
Cash flow
-13.1%
Cash-on-Cash Return
3.1%
Cap rate
0.6%
Rent to Value Ratio
Active
$154,900
3
bds
|
0
ba
|
995
sqft
|
built
1955
5641 N 70th St, Milwaukee, WI 53218
$-88
Cash flow
-3.0%
Cash-on-Cash Return
5.5%
Cap rate
0.8%
Rent to Value Ratio
Active
$499,900
5
bds
|
0
ba
|
1,791
sqft
|
built
1904
503 W Chambers St, Milwaukee, WI 53212
$-2,157
Cash flow
-22.5%
Cash-on-Cash Return
1.0%
Cap rate
0.2%
Rent to Value Ratio
Active
$170,000
2
bds
|
0
ba
|
1,276
sqft
|
built
1955
6439 N 40th St, Milwaukee, WI 53209
$-177
Cash flow
-5.4%
Cash-on-Cash Return
4.9%
Cap rate
0.8%
Rent to Value Ratio
Active
$229,900
3
bds
|
0
ba
|
1,937
sqft
|
built
1955
7728 W Kathryn Ave, Milwaukee, WI 53218
$-434
Cash flow
-9.8%
Cash-on-Cash Return
3.9%
Cap rate
0.6%
Rent to Value Ratio
Active
$210,000
3
bds
|
0
ba
|
1,044
sqft
|
built
1922
7503 W Stevenson St, Milwaukee, WI 53213
$-490
Cash flow
-12.2%
Cash-on-Cash Return
3.3%
Cap rate
0.7%
Rent to Value Ratio
Active
$249,900
3
bds
|
0
ba
|
1,395
sqft
|
built
1948
3656 S 16th St, Milwaukee, WI 53221
$-503
Cash flow
-10.5%
Cash-on-Cash Return
3.7%
Cap rate
0.7%
Rent to Value Ratio

Active
$249,900
3
bds
|
0
ba
|
1,216
sqft
|
built
1925
436 S 73rd St, Milwaukee, WI 53214
$-548
Cash flow
-11.4%
Cash-on-Cash Return
3.5%
Cap rate
0.6%
Rent to Value Ratio
Active
$239,900
2
bds
|
0
ba
|
1,084
sqft
|
built
1942
2840 N 79th St, Milwaukee, WI 53222
$-260
Cash flow
-5.7%
Cash-on-Cash Return
4.8%
Cap rate
0.8%
Rent to Value Ratio
Active
$399,900
1
bds
|
0
ba
|
1,077
sqft
|
built
2006
106 W Seeboth St, Milwaukee, WI 53204
$-1,605
Cash flow
-20.9%
Cash-on-Cash Return
1.3%
Cap rate
0.4%
Rent to Value Ratio
Active
$225,000
1
bds
|
0
ba
|
1,278
sqft
|
built
1901
270 E Highland Ave, Milwaukee, WI 53202
$-590
Cash flow
-13.7%
Cash-on-Cash Return
3.0%
Cap rate
0.7%
Rent to Value Ratio
Active
$165,000
3
bds
|
0
ba
|
1,178
sqft
|
built
1926
4035 N 15th St, Milwaukee, WI 53209
$361
Cash flow
11.4%
Cash-on-Cash Return
8.8%
Cap rate
1.2%
Rent to Value Ratio
Active
$359,900
5
bds
|
0
ba
|
3,493
sqft
|
built
1921
2131 N Hi Mount Blvd, Milwaukee, WI 53208
$-1,269
Cash flow
-18.4%
Cash-on-Cash Return
1.9%
Cap rate
0.5%
Rent to Value Ratio
Active
$174,900
1
bds
|
0
ba
|
782
sqft
|
built
1929
606 W Wisconsin Ave, Milwaukee, WI 53203
$-225
Cash flow
-6.7%
Cash-on-Cash Return
4.6%
Cap rate
0.8%
Rent to Value Ratio
Active
$85,000
2
bds
|
0
ba
|
748
sqft
|
built
1936
4416 N Houston Ave, Milwaukee, WI 53218
$119
Cash flow
7.3%
Cash-on-Cash Return
7.8%
Cap rate
1.2%
Rent to Value Ratio
Active
$325,000
1
bds
|
0
ba
|
789
sqft
|
built
2006
106 W Seeboth St, Milwaukee, WI 53204
$-1,008
Cash flow
-16.2%
Cash-on-Cash Return
2.4%
Cap rate
0.6%
Rent to Value Ratio
Active
$180,000
3
bds
|
0
ba
|
1,485
sqft
|
built
1947
4098 N Elmhurst Rd, Milwaukee, WI 53216
$-127
Cash flow
-3.7%
Cash-on-Cash Return
5.3%
Cap rate
0.8%
Rent to Value Ratio
Active
$272,500
3
bds
|
0
ba
|
1,420
sqft
|
built
1952
3328 N 85th St, Milwaukee, WI 53222
$-393
Cash flow
-7.5%
Cash-on-Cash Return
4.4%
Cap rate
0.7%
Rent to Value Ratio
Active
$82,900
4
bds
|
0
ba
|
2,042
sqft
|
built
1916
3317 N 28th St, Milwaukee, WI 53216
$164
Cash flow
10.3%
Cash-on-Cash Return
8.5%
Cap rate
1.2%
Rent to Value Ratio
Active
$110,000
3
bds
|
0
ba
|
1,521
sqft
|
built
1938
3914 W Hampton Ave, Milwaukee, WI 53209
$338
Cash flow
16.0%
Cash-on-Cash Return
9.8%
Cap rate
1.5%
Rent to Value Ratio
Active
$299,000
3
bds
|
0
ba
|
1,248
sqft
|
built
1967
5611 S 23rd St, Milwaukee, WI 53221
$-664
Cash flow
-11.6%
Cash-on-Cash Return
3.5%
Cap rate
0.6%
Rent to Value Ratio
Active
$599,900
5
bds
|
0
ba
|
4,200
sqft
|
built
1959
4922 W Dean Rd, Brown Deer, WI 53223
$-585
Cash flow
-5.1%
Cash-on-Cash Return
5.0%
Cap rate
0.7%
Rent to Value Ratio
Active
$220,000
3
bds
|
0
ba
|
942
sqft
|
built
1959
1420 W Vogel Ave, Milwaukee, WI 53221
$-361
Cash flow
-8.6%
Cash-on-Cash Return
4.2%
Cap rate
0.7%
Rent to Value Ratio
Active
$260,000
5
bds
|
0
ba
|
1,851
sqft
|
built
1941
3734 N 50th St, Milwaukee, WI 53216
$-560
Cash flow
-11.2%
Cash-on-Cash Return
3.6%
Cap rate
0.5%
Rent to Value Ratio
Active
$310,000
3
bds
|
0
ba
|
1,837
sqft
|
built
1971
9701 W Cleveland Ave, West Allis, WI 53227
$-834
Cash flow
-14.0%
Cash-on-Cash Return
2.9%
Cap rate
0.6%
Rent to Value Ratio
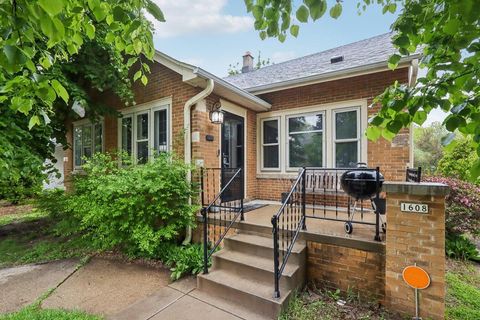
Active
$299,000
4
bds
|
0
ba
|
1,492
sqft
|
built
1923
1608 S 60th St, West Allis, WI 53214
$-704
Cash flow
-12.3%
Cash-on-Cash Return
3.3%
Cap rate
0.6%
Rent to Value Ratio
Active
$92,900
3
bds
|
0
ba
|
940
sqft
|
built
1883
526 W Hadley St, Milwaukee, WI 53212
$272
Cash flow
15.3%
Cash-on-Cash Return
9.7%
Cap rate
1.4%
Rent to Value Ratio
Active
$190,000
3
bds
|
0
ba
|
1,014
sqft
|
built
1954
4941 N 63rd St, Milwaukee, WI 53218
$-286
Cash flow
-7.9%
Cash-on-Cash Return
4.3%
Cap rate
0.7%
Rent to Value Ratio

Active
$129,900
2
bds
|
0
ba
|
781
sqft
|
built
1938
4222 W Thurston Ave, Milwaukee, WI 53209
$-12
Cash flow
-0.5%
Cash-on-Cash Return
6.0%
Cap rate
0.8%
Rent to Value Ratio
Active
$274,900
3
bds
|
0
ba
|
1,120
sqft
|
built
1961
7902 W Howard Ave, Milwaukee, WI 53220
$-682
Cash flow
-12.9%
Cash-on-Cash Return
3.2%
Cap rate
0.6%
Rent to Value Ratio
Active
$279,500
3
bds
|
0
ba
|
1,237
sqft
|
built
1953
9210 W Dixon St, Milwaukee, WI 53214
$-353
Cash flow
-6.6%
Cash-on-Cash Return
4.6%
Cap rate
0.8%
Rent to Value Ratio
Active
$350,000
3
bds
|
0
ba
|
2,054
sqft
|
built
2002
503 N 29th St, Milwaukee, WI 53208
$-1,009
Cash flow
-15.0%
Cash-on-Cash Return
2.7%
Cap rate
0.5%
Rent to Value Ratio
Active
$229,900
2
bds
|
0
ba
|
1,030
sqft
|
built
1954
181 W Van Norman Ave, Milwaukee, WI 53207
$-549
Cash flow
-12.5%
Cash-on-Cash Return
3.3%
Cap rate
0.6%
Rent to Value Ratio
Active
$248,900
4
bds
|
0
ba
|
1,782
sqft
|
built
1952
4833 N 54th St, Milwaukee, WI 53218
$-629
Cash flow
-13.2%
Cash-on-Cash Return
3.1%
Cap rate
0.5%
Rent to Value Ratio