Broward County Investment Properties for Sale
Browse homes for sale and investment properties in Broward County. Refine your search by price, property type, or more.
Best cash flowing properties in Broward County
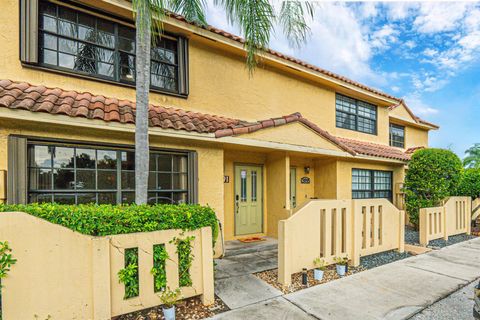
Active
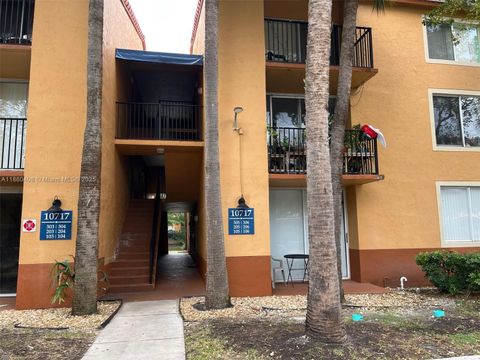
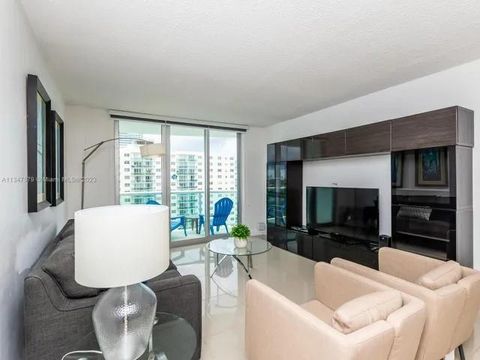
$200,000
1
bds
|
1
ba
|
734
sqft
|
built
1989
10717 Cleary Blvd, Plantation, FL 33324
$-322
Cash flow
-8.4%
Cash-on-Cash Return
4.2%
Cap rate
0.9%
Rent to Value Ratio
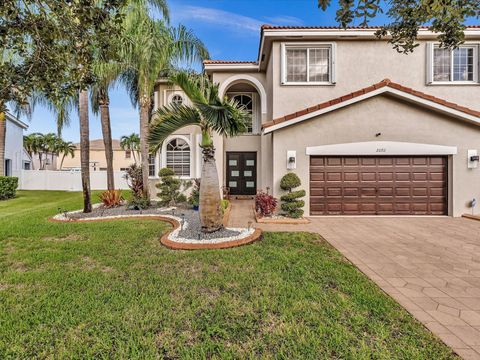
Active
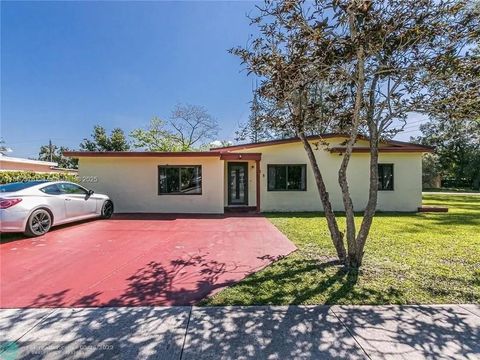
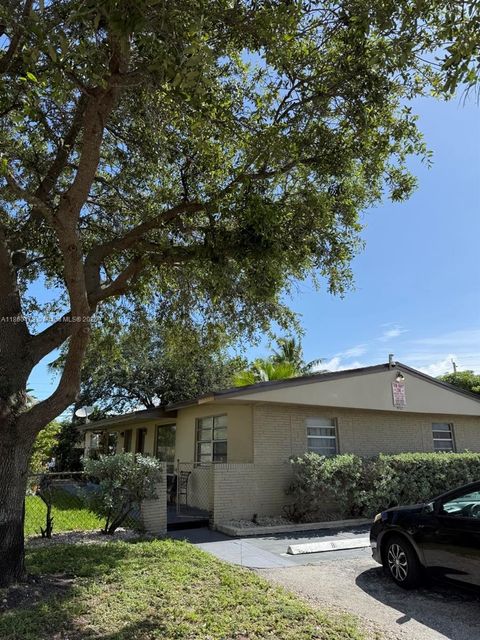
$399,999
4
bds
|
3
ba
|
1,757
sqft
|
built
1951
115 Marion Rd, West Park, FL 33023
$-347
Cash flow
-4.5%
Cash-on-Cash Return
5.1%
Cap rate
0.9%
Rent to Value Ratio
8,713 out of 10,156 properties for sale in Broward County
Limited Results Shown
Create a free account, or log in to reveal all property listings and enjoy the complete experience.
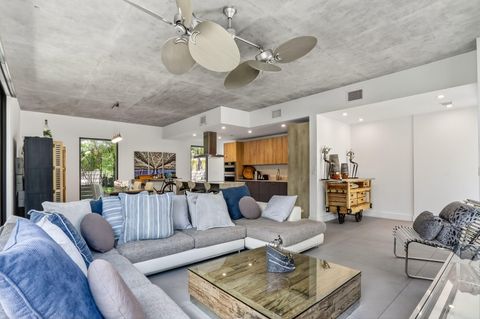
Active
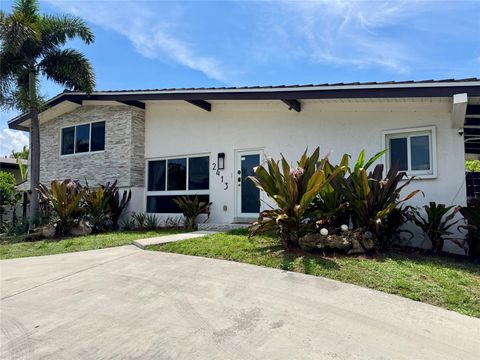
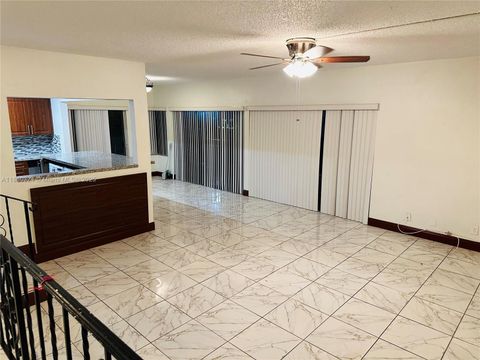
$889,000
3
bds
|
3
ba
|
1,860
sqft
|
built
1956
2413 Sugarloaf Ln, Fort Lauderdale, FL 33312
$-740
Cash flow
-4.3%
Cash-on-Cash Return
5.1%
Cap rate
0.7%
Rent to Value Ratio
Active
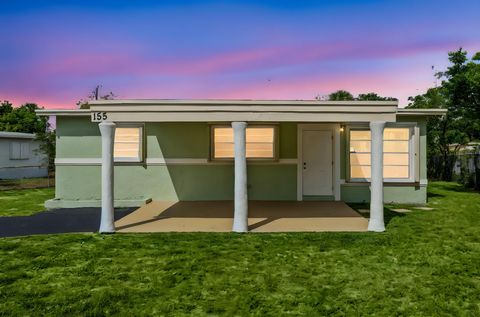
$369,000
3
bds
|
1
ba
|
1,043
sqft
|
built
1954
155 NW 29th Ave, Fort Lauderdale, FL 33311
$-825
Cash flow
-11.7%
Cash-on-Cash Return
3.5%
Cap rate
0.6%
Rent to Value Ratio
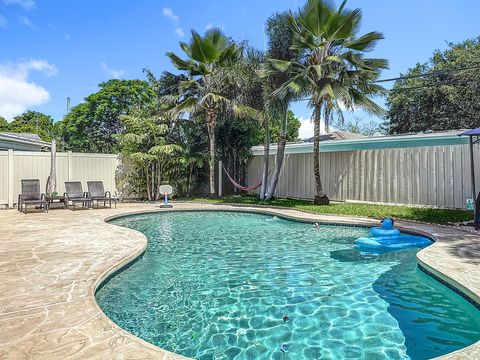
Active
$749,000
4
bds
|
3
ba
|
2,445
sqft
|
built
1988
5185 NW 52nd St, Coconut Creek, FL 33073
$-1,254
Cash flow
-8.7%
Cash-on-Cash Return
4.1%
Cap rate
0.7%
Rent to Value Ratio
Active
$450,000
3
bds
|
3
ba
|
1,400
sqft
|
built
1986
340 SW 97th Ave, Pembroke Pines, FL 33025
$-1,229
Cash flow
-14.2%
Cash-on-Cash Return
2.9%
Cap rate
0.6%
Rent to Value Ratio
Active
$295,000
2
bds
|
2
ba
|
978
sqft
|
built
1986
3072 S Oakland Forest Dr, Oakland Park, FL 33309
$-583
Cash flow
-10.3%
Cash-on-Cash Return
3.8%
Cap rate
0.7%
Rent to Value Ratio
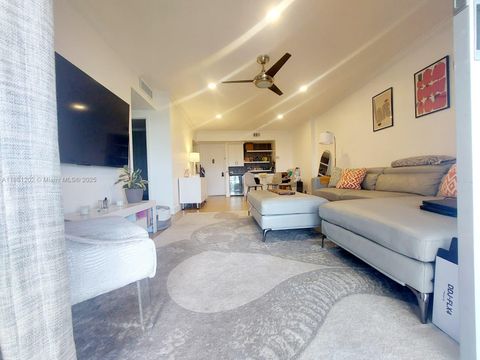
Active
$170,000
1
bds
|
1
ba
|
720
sqft
|
built
1965
700 Layne Blvd, Hallandale Beach, FL 33009
$-485
Cash flow
-14.9%
Cash-on-Cash Return
2.7%
Cap rate
1.2%
Rent to Value Ratio
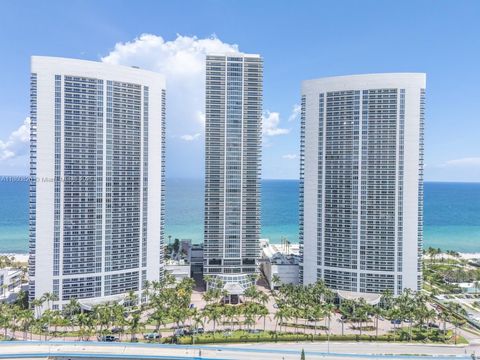
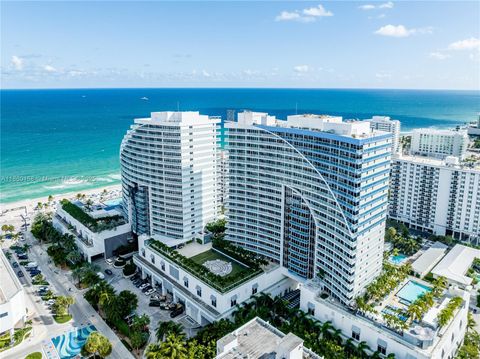
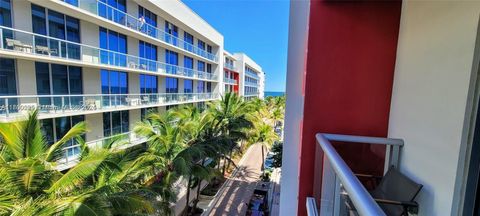
Active
$690,000
1
bds
|
1
ba
|
871
sqft
|
built
2006
1830 S Ocean Dr, Hallandale Beach, FL 33009
$-2,834
Cash flow
-21.4%
Cash-on-Cash Return
1.2%
Cap rate
0.6%
Rent to Value Ratio
Active
$199,500
1
bds
|
2
ba
|
844
sqft
|
built
1969
4400 Hillcrest Dr, Hollywood, FL 33021
$-689
Cash flow
-18.0%
Cash-on-Cash Return
2.0%
Cap rate
0.9%
Rent to Value Ratio
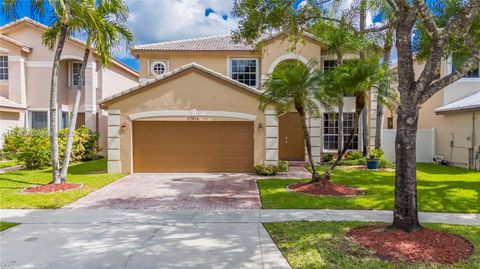
Active
$790,000
4
bds
|
3
ba
|
2,870
sqft
|
built
1998
17915 SW 33rd St, Miramar, FL 33029
$-1,843
Cash flow
-12.2%
Cash-on-Cash Return
3.3%
Cap rate
0.6%
Rent to Value Ratio
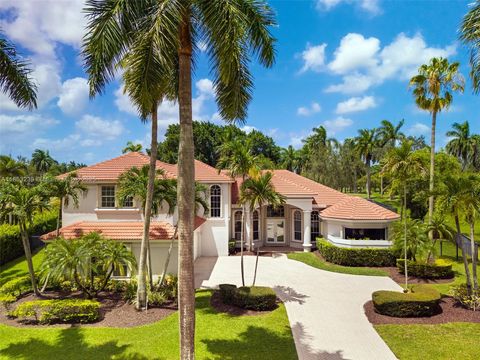
Active
$3,295,000
5
bds
|
6
ba
|
5,507
sqft
|
built
1997
2438 Poinciana Ct, Weston, FL 33327
$-13,567
Cash flow
-21.5%
Cash-on-Cash Return
1.2%
Cap rate
0.3%
Rent to Value Ratio
Active
$854,000
4
bds
|
3
ba
|
2,146
sqft
|
built
1962
1600 Yale Dr, Hollywood, FL 33021
$-1,017
Cash flow
-6.2%
Cash-on-Cash Return
4.7%
Cap rate
0.7%
Rent to Value Ratio
Active
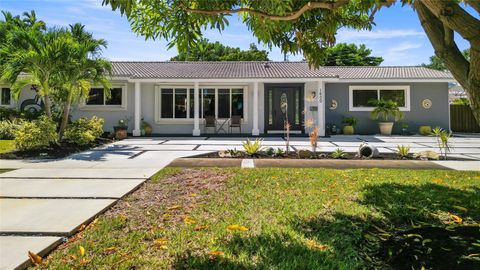
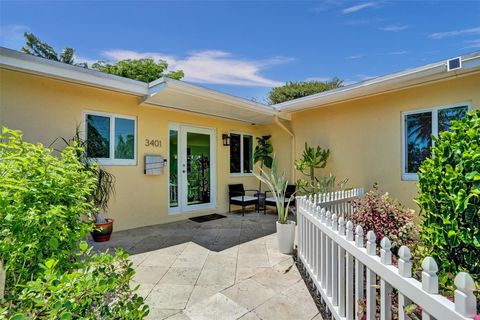
$649,000
3
bds
|
3
ba
|
1,716
sqft
|
built
1953
3401 NE 17th Ave, Oakland Park, FL 33334
$-965
Cash flow
-7.8%
Cash-on-Cash Return
4.4%
Cap rate
0.6%
Rent to Value Ratio
Active
$620,000
3
bds
|
2
ba
|
1,405
sqft
|
built
1955
1401 N 31st Rd, Hollywood, FL 33021
$-1,392
Cash flow
-11.7%
Cash-on-Cash Return
3.5%
Cap rate
0.6%
Rent to Value Ratio
Active
$449,999
3
bds
|
2
ba
|
1,334
sqft
|
built
1940
1635 Hayes St, Hollywood, FL 33020
$-1,355
Cash flow
-15.7%
Cash-on-Cash Return
2.5%
Cap rate
0.6%
Rent to Value Ratio
Active
$1,020,000
2
bds
|
2
ba
|
1,176
sqft
|
built
2011
3101 Bayshore Dr, Fort Lauderdale, FL 33304
$-4,117
Cash flow
-21.1%
Cash-on-Cash Return
1.3%
Cap rate
0.7%
Rent to Value Ratio
Active
$1,099,000
4
bds
|
4
ba
|
1,896
sqft
|
built
1954
2601 NE 18th St, Pompano Beach, FL 33062
$-1,899
Cash flow
-9.0%
Cash-on-Cash Return
4.1%
Cap rate
0.6%
Rent to Value Ratio
Active
$249,000
2
bds
|
2
ba
|
1,065
sqft
|
built
1976
6000 NE 22nd Way, Fort Lauderdale, FL 33308
$-554
Cash flow
-11.6%
Cash-on-Cash Return
3.5%
Cap rate
0.9%
Rent to Value Ratio
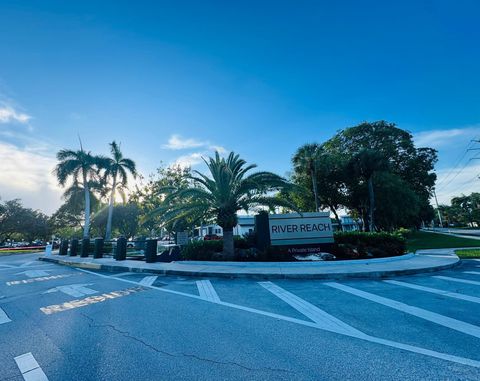
Active
$469,000
2
bds
|
2
ba
|
1,110
sqft
|
built
1982
1101 River Reach Dr, Fort Lauderdale, FL 33315
$-1,743
Cash flow
-19.4%
Cash-on-Cash Return
1.7%
Cap rate
0.5%
Rent to Value Ratio
Active
$765,000
2
bds
|
2
ba
|
1,320
sqft
|
built
1983
4201 N Ocean Dr, Hollywood, FL 33019
$-3,627
Cash flow
-24.7%
Cash-on-Cash Return
0.5%
Cap rate
0.5%
Rent to Value Ratio
Active
$365,000
2
bds
|
1
ba
|
966
sqft
|
built
1966
6621 SW 19th St, North Lauderdale, FL 33068
$-839
Cash flow
-12.0%
Cash-on-Cash Return
3.4%
Cap rate
0.5%
Rent to Value Ratio
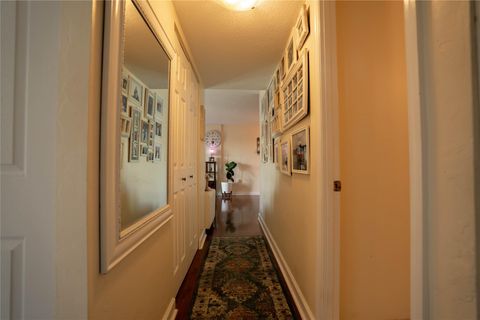
Active
$339,000
2
bds
|
2
ba
|
1,213
sqft
|
built
1998
160 SW 117th Ter, Pembroke Pines, FL 33025
$-1,033
Cash flow
-15.9%
Cash-on-Cash Return
2.5%
Cap rate
0.7%
Rent to Value Ratio
Active
$995,000
4
bds
|
3
ba
|
3,077
sqft
|
built
2002
5044 SW 164th Ave, Miramar, FL 33027
$-1,960
Cash flow
-10.3%
Cash-on-Cash Return
3.8%
Cap rate
0.6%
Rent to Value Ratio
Active
$609,900
3
bds
|
2
ba
|
2,025
sqft
|
built
1967
6764 Dogwood Dr, Miramar, FL 33023
$-895
Cash flow
-7.7%
Cash-on-Cash Return
4.4%
Cap rate
0.6%
Rent to Value Ratio
Active
$225,000
3
bds
|
2
ba
|
1,200
sqft
|
built
1978
701 Pine Dr, Pompano Beach, FL 33060
$-393
Cash flow
-9.1%
Cash-on-Cash Return
4.1%
Cap rate
1.0%
Rent to Value Ratio
Active
$749,900
4
bds
|
2
ba
|
1,624
sqft
|
built
1961
2109 NW 2nd Ave, Wilton Manors, FL 33311
$-1,455
Cash flow
-10.1%
Cash-on-Cash Return
3.8%
Cap rate
0.7%
Rent to Value Ratio
Active
$517,000
3
bds
|
2
ba
|
1,275
sqft
|
built
1972
6668 NW 1st St, Margate, FL 33063
$-909
Cash flow
-9.2%
Cash-on-Cash Return
4.0%
Cap rate
0.7%
Rent to Value Ratio
Active
$259,999
2
bds
|
2
ba
|
1,235
sqft
|
built
1983
4902 NW 82nd Ave, Lauderhill, FL 33351
$-993
Cash flow
-19.9%
Cash-on-Cash Return
1.6%
Cap rate
0.8%
Rent to Value Ratio
Active
$549,000
2
bds
|
2
ba
|
1,559
sqft
|
built
1977
1370 S Ocean Blvd, Pompano Beach, FL 33062
$-2,129
Cash flow
-20.2%
Cash-on-Cash Return
1.5%
Cap rate
0.7%
Rent to Value Ratio
Active
$1,849,000
3
bds
|
3
ba
|
2,323
sqft
|
built
1981
2415 NE 35th Dr, Fort Lauderdale, FL 33308
$-6,401
Cash flow
-18.1%
Cash-on-Cash Return
2.0%
Cap rate
0.3%
Rent to Value Ratio
Active
$720,000
3
bds
|
2
ba
|
1,648
sqft
|
built
1996
2411 NW 184th Ter, Pembroke Pines, FL 33029
$-1,787
Cash flow
-12.9%
Cash-on-Cash Return
3.2%
Cap rate
0.6%
Rent to Value Ratio
Active
$300,000
1
bds
|
1
ba
|
366
sqft
|
built
2018
777 N Ocean Dr, Hollywood, FL 33019
$-961
Cash flow
-16.7%
Cash-on-Cash Return
2.3%
Cap rate
0.8%
Rent to Value Ratio
Active
$425,000
3
bds
|
3
ba
|
1,764
sqft
|
built
1984
3991 NW 94th Way, Sunrise, FL 33351
$-802
Cash flow
-9.8%
Cash-on-Cash Return
3.9%
Cap rate
0.7%
Rent to Value Ratio
Active
$1,350,000
3
bds
|
3
ba
|
2,239
sqft
|
built
2019
925 NE 6th St, Fort Lauderdale, FL 33304
$-2,274
Cash flow
-8.8%
Cash-on-Cash Return
4.1%
Cap rate
0.7%
Rent to Value Ratio
Active
$1,090,000
4
bds
|
3
ba
|
2,818
sqft
|
built
2002
2092 SW 176th Ave, Miramar, FL 33029
$-2,264
Cash flow
-10.8%
Cash-on-Cash Return
3.7%
Cap rate
0.6%
Rent to Value Ratio
Active
$489,000
1
bds
|
1
ba
|
874
sqft
|
built
1969
3901 S Ocean Dr, Hollywood, FL 33019
$-1,985
Cash flow
-21.2%
Cash-on-Cash Return
1.3%
Cap rate
0.7%
Rent to Value Ratio

Active
$345,000
2
bds
|
2
ba
|
1,256
sqft
|
built
1979
195 Lakeview Dr, Weston, FL 33326
$-814
Cash flow
-12.3%
Cash-on-Cash Return
3.3%
Cap rate
0.7%
Rent to Value Ratio
Active
$524,900
bds
|
0
ba
|
1,646
sqft
|
built
1964
4123 SW 21st St, Fort Lauderdale, FL 33317
$-2,139
Cash flow
-21.3%
Cash-on-Cash Return
1.3%
Cap rate
0.3%
Rent to Value Ratio
Active
$260,000
2
bds
|
2
ba
|
1,100
sqft
|
built
1974
4850 SW 63rd Ter, Davie, FL 33314
$-646
Cash flow
-13.0%
Cash-on-Cash Return
3.2%
Cap rate
0.8%
Rent to Value Ratio