Broward County Investment Properties for Sale
Browse homes for sale and investment properties in Broward County. Refine your search by price, property type, or more.
Best cash flowing properties in Broward County

Active
$95,000
1
bds
|
2
ba
|
928
sqft
|
built
1973
4750 NW 22nd Ct, Lauderhill, FL 33313
$29
Cash flow
1.6%
Cash-on-Cash Return
6.5%
Cap rate
1.7%
Rent to Value Ratio
Active
$170,000
2
bds
|
2
ba
|
880
sqft
|
built
1981
203 Lake Pointe Dr, Oakland Park, FL 33309
$-366
Cash flow
-11.2%
Cash-on-Cash Return
3.6%
Cap rate
1.2%
Rent to Value Ratio
9,164 out of 10,677 properties for sale in Broward County
Limited Results Shown
Create a free account, or log in to reveal all property listings and enjoy the complete experience.
Active
$299,000
2
bds
|
2
ba
|
1,022
sqft
|
built
2005
1450 SE 3rd Ave, Dania Beach, FL 33004
$-1,159
Cash flow
-20.2%
Cash-on-Cash Return
1.5%
Cap rate
0.7%
Rent to Value Ratio

Active
$179,000
2
bds
|
2
ba
|
1,000
sqft
|
built
1979
1820 N Lauderdale Ave, North Lauderdale, FL 33068
$-685
Cash flow
-20.0%
Cash-on-Cash Return
1.6%
Cap rate
1.1%
Rent to Value Ratio

Active
$619,000
3
bds
|
2
ba
|
1,423
sqft
|
built
1961
2175 NE 59th Ct, Fort Lauderdale, FL 33308
$-1,049
Cash flow
-8.8%
Cash-on-Cash Return
4.1%
Cap rate
0.7%
Rent to Value Ratio
Active
$995,000
3
bds
|
3
ba
|
1,868
sqft
|
built
1994
5320 SW 199th Ave, Fort Lauderdale, FL 33332
$-793
Cash flow
-4.2%
Cash-on-Cash Return
5.2%
Cap rate
0.7%
Rent to Value Ratio
Active
$323,900
2
bds
|
2
ba
|
1,098
sqft
|
built
1973
400 N Riverside Dr, Pompano Beach, FL 33062
$-1,175
Cash flow
-18.9%
Cash-on-Cash Return
1.8%
Cap rate
0.8%
Rent to Value Ratio
Active
$565,000
2
bds
|
2
ba
|
1,380
sqft
|
built
1970
1501 S Ocean Dr, Hollywood, FL 33019
$-986
Cash flow
-9.1%
Cash-on-Cash Return
4.1%
Cap rate
0.6%
Rent to Value Ratio

Active
$379,000
2
bds
|
2
ba
|
1,276
sqft
|
built
1967
2500 NE 48th Ln, Fort Lauderdale, FL 33308
$-1,405
Cash flow
-19.3%
Cash-on-Cash Return
1.7%
Cap rate
0.7%
Rent to Value Ratio

Active
$237,000
2
bds
|
2
ba
|
1,075
sqft
|
built
1976
1000 Parkview Dr, Hallandale Beach, FL 33009
$-686
Cash flow
-15.1%
Cash-on-Cash Return
2.7%
Cap rate
1.1%
Rent to Value Ratio

Active
$974,999
2
bds
|
2
ba
|
1,350
sqft
|
built
1969
12411 SW 12th St, Davie, FL 33325
$-2,780
Cash flow
-14.9%
Cash-on-Cash Return
2.7%
Cap rate
0.5%
Rent to Value Ratio

Active
$1,199,995
4
bds
|
4
ba
|
2,456
sqft
|
built
1952
417 NE 26th Dr, Wilton Manors, FL 33334
$-1,411
Cash flow
-6.1%
Cash-on-Cash Return
4.7%
Cap rate
0.7%
Rent to Value Ratio

Active
$260,000
2
bds
|
2
ba
|
1,000
sqft
|
built
1972
807 W Oakland Park Blvd, Wilton Manors, FL 33311
$-1,178
Cash flow
-23.6%
Cash-on-Cash Return
0.7%
Cap rate
0.7%
Rent to Value Ratio
Active
$824,950
3
bds
|
2
ba
|
1,587
sqft
|
built
1956
3488 NE 19th Ave, Oakland Park, FL 33306
$-1,998
Cash flow
-12.6%
Cash-on-Cash Return
3.2%
Cap rate
0.6%
Rent to Value Ratio

Active
$587,500
4
bds
|
4
ba
|
1,714
sqft
|
built
2015
9627 Watercrest Isle, Parkland, FL 33076
$-1,621
Cash flow
-14.4%
Cash-on-Cash Return
2.8%
Cap rate
0.7%
Rent to Value Ratio
Active
$379,000
3
bds
|
3
ba
|
1,472
sqft
|
built
1980
1150 NW 99th Ave, Pembroke Pines, FL 33024
$-687
Cash flow
-9.5%
Cash-on-Cash Return
4.0%
Cap rate
0.8%
Rent to Value Ratio

Active
$269,999
2
bds
|
2
ba
|
1,106
sqft
|
built
1987
4861 NW 22nd St, Coconut Creek, FL 33063
$-568
Cash flow
-11.0%
Cash-on-Cash Return
3.6%
Cap rate
0.8%
Rent to Value Ratio
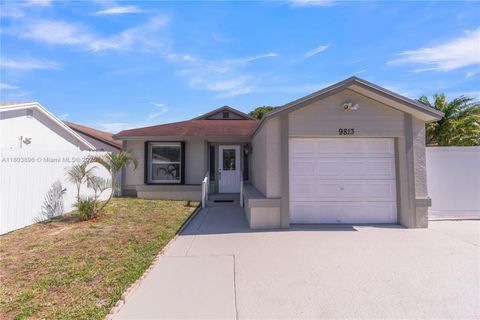
Active
$584,000
3
bds
|
2
ba
|
1,186
sqft
|
built
1983
9813 SW 57th St, Cooper City, FL 33328
$-1,305
Cash flow
-11.7%
Cash-on-Cash Return
3.5%
Cap rate
0.6%
Rent to Value Ratio
Active
$330,000
2
bds
|
2
ba
|
1,180
sqft
|
built
1973
300 NE 19th Ct, Wilton Manors, FL 33305
$-1,061
Cash flow
-16.8%
Cash-on-Cash Return
2.3%
Cap rate
0.8%
Rent to Value Ratio

Active
$585,000
2
bds
|
2
ba
|
1,270
sqft
|
built
1974
1237 Hillsboro Mile, Hillsboro Beach, FL 33062
$-1,877
Cash flow
-16.7%
Cash-on-Cash Return
2.3%
Cap rate
0.7%
Rent to Value Ratio

Active
$289,000
2
bds
|
3
ba
|
1,310
sqft
|
built
1975
611 N University Dr, Plantation, FL 33324
$-645
Cash flow
-11.6%
Cash-on-Cash Return
3.5%
Cap rate
0.8%
Rent to Value Ratio

Active
$505,000
1
bds
|
1
ba
|
761
sqft
|
built
2017
777 N Ocean Dr, Hollywood, FL 33019
$-2,176
Cash flow
-22.5%
Cash-on-Cash Return
1.0%
Cap rate
0.6%
Rent to Value Ratio
Active
$599,900
3
bds
|
1
ba
|
1,268
sqft
|
built
1956
928 N 30th Rd, Hollywood, FL 33021
$-1,100
Cash flow
-9.6%
Cash-on-Cash Return
3.9%
Cap rate
0.6%
Rent to Value Ratio

Active
$1,210,000
3
bds
|
2
ba
|
2,454
sqft
|
built
2008
300 NW 21st Ct, Wilton Manors, FL 33311
$-3,079
Cash flow
-13.3%
Cash-on-Cash Return
3.1%
Cap rate
0.5%
Rent to Value Ratio

Active
$595,000
2
bds
|
2
ba
|
870
sqft
|
built
1971
1950 S Ocean Dr, Hallandale Beach, FL 33009
$-2,173
Cash flow
-19.1%
Cash-on-Cash Return
1.8%
Cap rate
0.5%
Rent to Value Ratio
Active
$474,000
4
bds
|
2
ba
|
1,846
sqft
|
built
1968
3226 NW 41st St, Lauderdale Lakes, FL 33309
$-1,119
Cash flow
-12.3%
Cash-on-Cash Return
3.3%
Cap rate
0.7%
Rent to Value Ratio
Active
$215,000
2
bds
|
2
ba
|
1,120
sqft
|
built
1975
6555 W Broward Blvd, Plantation, FL 33317
$-634
Cash flow
-15.4%
Cash-on-Cash Return
2.6%
Cap rate
0.9%
Rent to Value Ratio
Active
$6,850,000
3
bds
|
5
ba
|
3,833
sqft
|
built
2008
1 N Fort Lauderdale Beach Blvd, Fort Lauderdale, FL 33304
$-36,888
Cash flow
-28.1%
Cash-on-Cash Return
-0.3%
Cap rate
0.1%
Rent to Value Ratio
Active
$475,000
2
bds
|
1
ba
|
720
sqft
|
built
1962
6421 Allen St, Hollywood, FL 33024
$-1,008
Cash flow
-11.1%
Cash-on-Cash Return
3.6%
Cap rate
0.6%
Rent to Value Ratio
Active
$650,000
3
bds
|
2
ba
|
1,658
sqft
|
built
1970
7601 Harbour Blvd, Miramar, FL 33023
$-1,495
Cash flow
-12.0%
Cash-on-Cash Return
3.4%
Cap rate
0.6%
Rent to Value Ratio
Active
$363,000
3
bds
|
1
ba
|
1,399
sqft
|
built
1967
4240 NW 22nd St, Lauderhill, FL 33313
$-582
Cash flow
-8.4%
Cash-on-Cash Return
4.2%
Cap rate
0.7%
Rent to Value Ratio
Active
$1,199,000
3
bds
|
3
ba
|
2,400
sqft
|
built
1970
4280 Galt Ocean Dr, Fort Lauderdale, FL 33308
$-4,286
Cash flow
-18.7%
Cash-on-Cash Return
1.9%
Cap rate
0.7%
Rent to Value Ratio
Active
$359,000
1
bds
|
2
ba
|
870
sqft
|
built
1971
1980 S Ocean Dr, Hallandale Beach, FL 33009
$-1,071
Cash flow
-15.6%
Cash-on-Cash Return
2.6%
Cap rate
0.8%
Rent to Value Ratio

Active
$649,000
3
bds
|
2
ba
|
1,419
sqft
|
built
1963
921 SE 13th Ct, Deerfield Beach, FL 33441
$-1,512
Cash flow
-12.2%
Cash-on-Cash Return
3.4%
Cap rate
0.6%
Rent to Value Ratio
Active
$699,000
2
bds
|
2
ba
|
1,028
sqft
|
built
2015
2600 E Hallandale Beach Blvd, Hallandale Beach, FL 33009
$-3,094
Cash flow
-23.1%
Cash-on-Cash Return
0.8%
Cap rate
0.5%
Rent to Value Ratio
Active
$320,000
2
bds
|
2
ba
|
1,292
sqft
|
built
1981
16141 Blatt Blvd, Weston, FL 33326
$-527
Cash flow
-8.6%
Cash-on-Cash Return
4.2%
Cap rate
0.7%
Rent to Value Ratio
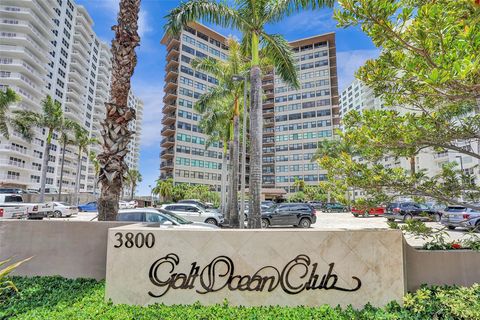
Active
$329,000
0
bds
|
1
ba
|
644
sqft
|
built
1963
3800 Galt Ocean Dr, Fort Lauderdale, FL 33308
$-1,225
Cash flow
-19.4%
Cash-on-Cash Return
1.7%
Cap rate
0.7%
Rent to Value Ratio
Active
$159,000
1
bds
|
1
ba
|
650
sqft
|
built
1965
3033 NW 43rd Ave, Lauderdale Lakes, FL 33313
$-444
Cash flow
-14.6%
Cash-on-Cash Return
2.8%
Cap rate
0.9%
Rent to Value Ratio
Active
$625,000
2
bds
|
2
ba
|
1,760
sqft
|
built
1982
3432 NE 16th Ave, Oakland Park, FL 33334
$-2,143
Cash flow
-17.9%
Cash-on-Cash Return
2.0%
Cap rate
0.4%
Rent to Value Ratio
Active
$189,900
2
bds
|
2
ba
|
890
sqft
|
built
1985
212 Lake Pointe Dr, Oakland Park, FL 33309
$-496
Cash flow
-13.6%
Cash-on-Cash Return
3.0%
Cap rate
1.0%
Rent to Value Ratio