Broward County Investment Properties for Sale
Browse homes for sale and investment properties in Broward County. Refine your search by price, property type, or more.
Best cash flowing properties in Broward County
Active
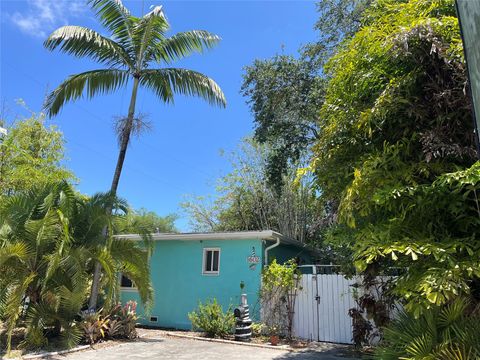
$525,000
3
bds
|
2
ba
|
1,205
sqft
|
built
1969
2917 NW 9th Ave, Wilton Manors, FL 33311
$-55
Cash flow
-0.5%
Cash-on-Cash Return
6.0%
Cap rate
1.0%
Rent to Value Ratio
Active
$180,000
2
bds
|
2
ba
|
950
sqft
|
built
1971
2220 NE 68th St, Fort Lauderdale, FL 33308
$-271
Cash flow
-7.9%
Cash-on-Cash Return
4.3%
Cap rate
1.0%
Rent to Value Ratio
7,970 out of 9,311 properties for sale in Broward County
Limited Results Shown
Create a free account, or log in to reveal all property listings and enjoy the complete experience.
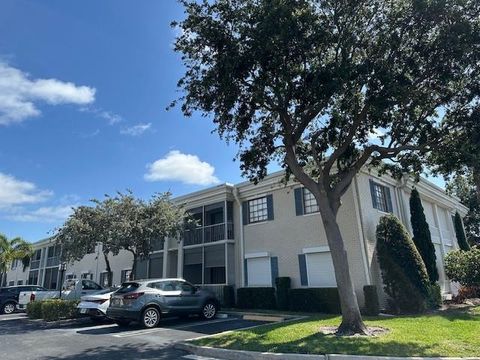
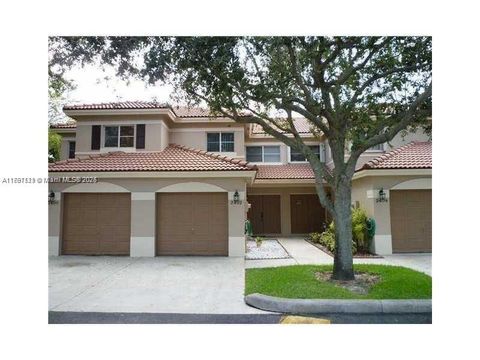
Active
$470,000
2
bds
|
2
ba
|
1,490
sqft
|
built
1980
371 Fairway Cir, Weston, FL 33326
$-1,155
Cash flow
-12.8%
Cash-on-Cash Return
3.2%
Cap rate
0.7%
Rent to Value Ratio
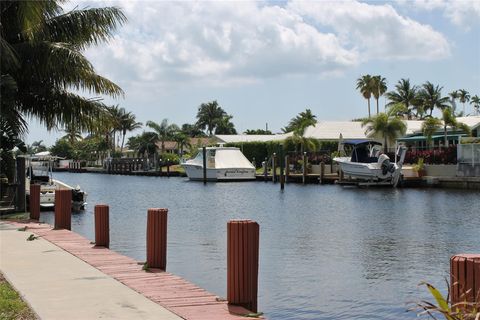
Active
$349,000
2
bds
|
2
ba
|
1,050
sqft
|
built
1966
1901 S Ocean Dr, Hollywood, FL 33019
$-1,341
Cash flow
-20.0%
Cash-on-Cash Return
1.5%
Cap rate
0.8%
Rent to Value Ratio

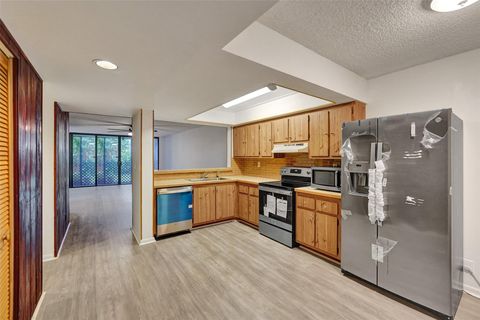
Active
$300,000
2
bds
|
1
ba
|
1,029
sqft
|
built
1990
3638 NW 83rd Ln, Sunrise, FL 33351
$-472
Cash flow
-8.2%
Cash-on-Cash Return
4.3%
Cap rate
0.8%
Rent to Value Ratio
Active
$269,900
2
bds
|
2
ba
|
966
sqft
|
built
1972
130 Cypress Club Dr, Pompano Beach, FL 33060
$-582
Cash flow
-11.3%
Cash-on-Cash Return
3.6%
Cap rate
0.8%
Rent to Value Ratio
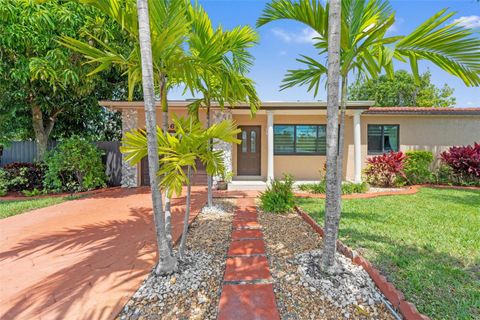
Active
$580,000
3
bds
|
2
ba
|
1,339
sqft
|
built
1956
6631 SW 24th St, Miramar, FL 33023
$-1,614
Cash flow
-14.5%
Cash-on-Cash Return
2.8%
Cap rate
0.5%
Rent to Value Ratio
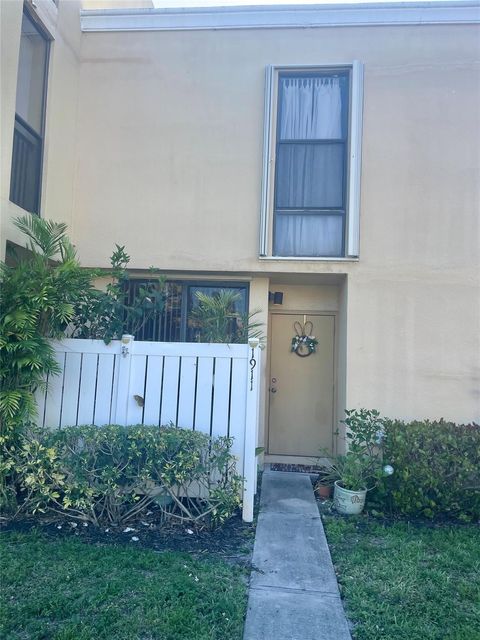
Active
$305,000
3
bds
|
3
ba
|
1,300
sqft
|
built
1981
2931 SW 87th Ter, Davie, FL 33328
$-717
Cash flow
-12.3%
Cash-on-Cash Return
3.3%
Cap rate
0.9%
Rent to Value Ratio
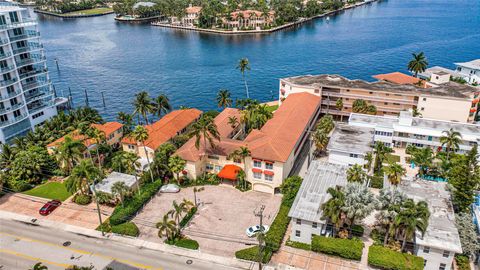
Active
$499,000
1
bds
|
1
ba
|
601
sqft
|
built
1993
341 N Birch Rd, Fort Lauderdale, FL 33304
$-2,058
Cash flow
-21.5%
Cash-on-Cash Return
1.2%
Cap rate
0.6%
Rent to Value Ratio
Active
$647,967
4
bds
|
2
ba
|
1,458
sqft
|
built
1977
181 SW 76th Ter, Margate, FL 33068
$-1,608
Cash flow
-12.9%
Cash-on-Cash Return
3.2%
Cap rate
0.5%
Rent to Value Ratio
Active
$472,000
4
bds
|
3
ba
|
2,137
sqft
|
built
1981
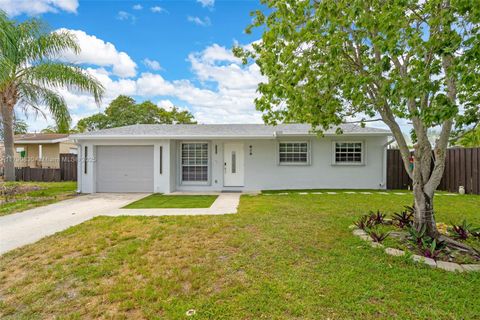
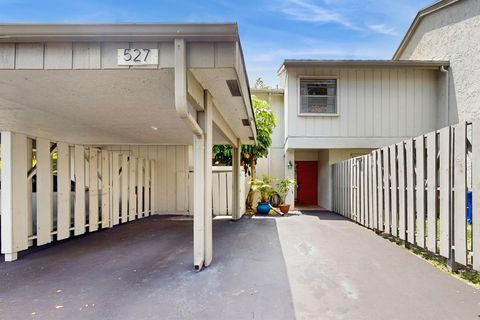
527 Deer Creek Wildwood Ln E, Deerfield Beach, FL 33442
$-915
Cash flow
-10.1%
Cash-on-Cash Return
3.8%
Cap rate
0.7%
Rent to Value Ratio
Active
$699,995
3
bds
|
2
ba
|
1,681
sqft
|
built
1961
2120 NE 59th St, Fort Lauderdale, FL 33308
$-1,350
Cash flow
-10.1%
Cash-on-Cash Return
3.8%
Cap rate
0.6%
Rent to Value Ratio
Active
$698,999
4
bds
|
3
ba
|
1,998
sqft
|
built
1968
8441 NW 18th St, Pembroke Pines, FL 33024
$-1,202
Cash flow
-9.0%
Cash-on-Cash Return
4.1%
Cap rate
0.6%
Rent to Value Ratio
Active
$1,099,000
3
bds
|
2
ba
|
1,911
sqft
|
built
1963
4220 NE 26th Ter, Lighthouse Point, FL 33064
$-2,121
Cash flow
-10.1%
Cash-on-Cash Return
3.8%
Cap rate
0.6%
Rent to Value Ratio
Active
$1,600,000
3
bds
|
4
ba
|
2,450
sqft
|
built
2021
2514 NE 21st St, Fort Lauderdale, FL 33305
$-3,896
Cash flow
-12.7%
Cash-on-Cash Return
3.2%
Cap rate
0.6%
Rent to Value Ratio
Active
$174,900
2
bds
|
2
ba
|
975
sqft
|
built
1974
113 Royal Park Dr, Oakland Park, FL 33309
$-643
Cash flow
-19.2%
Cash-on-Cash Return
1.7%
Cap rate
1.1%
Rent to Value Ratio
Active
$3,900,000
5
bds
|
6
ba
|
4,507
sqft
|
built
1967
5201 NE 33rd Ave, Fort Lauderdale, FL 33308
$-14,925
Cash flow
-20.0%
Cash-on-Cash Return
1.6%
Cap rate
0.3%
Rent to Value Ratio
Active
$399,000
2
bds
|
1
ba
|
824
sqft
|
built
1951
1602 NE 1st Ave, Fort Lauderdale, FL 33305
$-1,179
Cash flow
-15.4%
Cash-on-Cash Return
2.6%
Cap rate
0.5%
Rent to Value Ratio
Active
$413,000
2
bds
|
3
ba
|
1,226
sqft
|
built
1995
2405 NW 97th Ter, Pembroke Pines, FL 33024
$-855
Cash flow
-10.8%
Cash-on-Cash Return
3.7%
Cap rate
0.7%
Rent to Value Ratio
Active
$1,250,000
bds
|
0
ba
|
2,642
sqft
|
built
1966
2700 NE 57th St, Fort Lauderdale, FL 33308
$-6,399
Cash flow
-26.7%
Cash-on-Cash Return
0.0%
Cap rate
0.2%
Rent to Value Ratio
Active
$249,000
2
bds
|
2
ba
|
1,100
sqft
|
built
1983
2801 SW 87th Ave, Davie, FL 33328
$-661
Cash flow
-13.9%
Cash-on-Cash Return
3.0%
Cap rate
0.9%
Rent to Value Ratio
Active
$360,000
1
bds
|
2
ba
|
982
sqft
|
built
1981
2900 NE 14th Street Cswy, Pompano Beach, FL 33062
$-1,334
Cash flow
-19.3%
Cash-on-Cash Return
1.7%
Cap rate
0.8%
Rent to Value Ratio
Active
$500,000
3
bds
|
2
ba
|
1,258
sqft
|
built
1950
1100 NW 7th Ave, Fort Lauderdale, FL 33311
$-1,192
Cash flow
-12.4%
Cash-on-Cash Return
3.3%
Cap rate
0.6%
Rent to Value Ratio
Active
$170,000
2
bds
|
2
ba
|
1,002
sqft
|
built
1981
3321 NW 47th Ter, Lauderdale Lakes, FL 33319
$-448
Cash flow
-13.7%
Cash-on-Cash Return
3.0%
Cap rate
1.1%
Rent to Value Ratio
Active
$520,000
2
bds
|
2
ba
|
1,248
sqft
|
built
1970
2030 S Ocean Dr, Hallandale Beach, FL 33009
$-632
Cash flow
-6.3%
Cash-on-Cash Return
4.7%
Cap rate
0.8%
Rent to Value Ratio
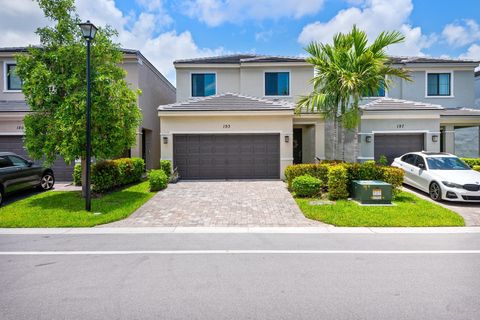
Active
$510,000
3
bds
|
3
ba
|
1,455
sqft
|
built
2022
193 NW 36th Ave, Pompano Beach, FL 33069
$-1,322
Cash flow
-13.5%
Cash-on-Cash Return
3.0%
Cap rate
0.7%
Rent to Value Ratio
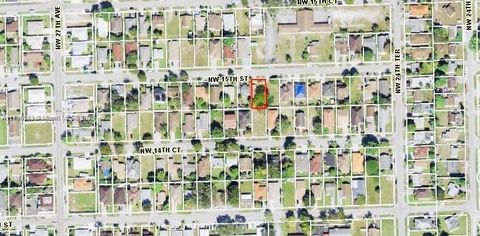
Active
$420,000
4
bds
|
2
ba
|
1,368
sqft
|
built
1962
2540 NW 15th St, Fort Lauderdale, FL 33311
$-858
Cash flow
-10.7%
Cash-on-Cash Return
3.7%
Cap rate
0.6%
Rent to Value Ratio
Active
$599,900
3
bds
|
2
ba
|
1,973
sqft
|
built
1970
3207 NW 89th Ter, Coral Springs, FL 33065
$-1,219
Cash flow
-10.6%
Cash-on-Cash Return
3.7%
Cap rate
0.6%
Rent to Value Ratio
Active
$2,650,000
6
bds
|
4
ba
|
4,142
sqft
|
built
1972
17531 SW 68th Ct, Southwest Ranches, FL 33331
$-9,646
Cash flow
-19.0%
Cash-on-Cash Return
1.8%
Cap rate
0.3%
Rent to Value Ratio
Active
$1,740,000
2
bds
|
2
ba
|
2,011
sqft
|
built
1971
2200 S Ocean Ln, Fort Lauderdale, FL 33316
$-8,152
Cash flow
-24.4%
Cash-on-Cash Return
0.5%
Cap rate
0.4%
Rent to Value Ratio
Active
$869,000
2
bds
|
2
ba
|
1,645
sqft
|
built
1971
4020 Galt Ocean Dr, Fort Lauderdale, FL 33308
$-3,817
Cash flow
-22.9%
Cash-on-Cash Return
0.9%
Cap rate
0.5%
Rent to Value Ratio
Active
$825,000
3
bds
|
2
ba
|
1,606
sqft
|
built
1976
2211 NE 34th St, Lighthouse Point, FL 33064
$-2,619
Cash flow
-16.6%
Cash-on-Cash Return
2.3%
Cap rate
0.5%
Rent to Value Ratio
Active
$598,000
3
bds
|
2
ba
|
1,484
sqft
|
built
1985
9711 SW 57th St, Cooper City, FL 33328
$-1,664
Cash flow
-14.5%
Cash-on-Cash Return
2.8%
Cap rate
0.5%
Rent to Value Ratio
Active
$540,000
3
bds
|
2
ba
|
1,500
sqft
|
built
1980
370 Fairway Cir, Weston, FL 33326
$-1,726
Cash flow
-16.7%
Cash-on-Cash Return
2.3%
Cap rate
0.6%
Rent to Value Ratio
Active
$1,199,000
bds
|
0
ba
|
4,635
sqft
|
built
1950
2535 Lincoln St, Hollywood, FL 33020
$-5,237
Cash flow
-22.8%
Cash-on-Cash Return
0.9%
Cap rate
0.2%
Rent to Value Ratio
Active
$1,119,900
4
bds
|
3
ba
|
2,966
sqft
|
built
1994
6533 NW 99th Ln, Parkland, FL 33076
$-1,011
Cash flow
-4.7%
Cash-on-Cash Return
5.1%
Cap rate
0.8%
Rent to Value Ratio
Active
$575,000
bds
|
0
ba
|
1,478
sqft
|
built
1966
6111 SW 37th Ct, Davie, FL 33314
$-2,292
Cash flow
-20.8%
Cash-on-Cash Return
1.4%
Cap rate
0.3%
Rent to Value Ratio
Active
$545,000
2
bds
|
2
ba
|
1,310
sqft
|
built
1992
9271 Arborwood Cir, Davie, FL 33328
$-1,086
Cash flow
-10.4%
Cash-on-Cash Return
3.8%
Cap rate
0.6%
Rent to Value Ratio
Active
$634,900
4
bds
|
3
ba
|
1,748
sqft
|
built
1961
5901 NE 4th Ave, Oakland Park, FL 33334
$-1,783
Cash flow
-14.7%
Cash-on-Cash Return
2.8%
Cap rate
0.5%
Rent to Value Ratio
Active
$990,000
3
bds
|
3
ba
|
1,571
sqft
|
built
2005
1850 S Ocean Dr, Hallandale Beach, FL 33009
$-3,704
Cash flow
-19.5%
Cash-on-Cash Return
1.7%
Cap rate
0.6%
Rent to Value Ratio