Broward County Investment Properties for Sale
Browse homes for sale and investment properties in Broward County. Refine your search by price, property type, or more.
Best cash flowing properties in Broward County
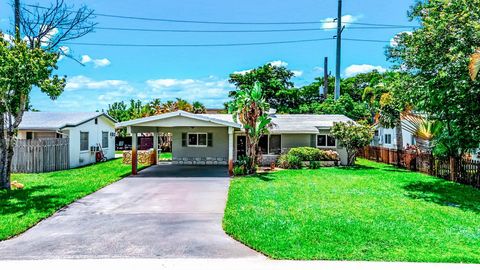
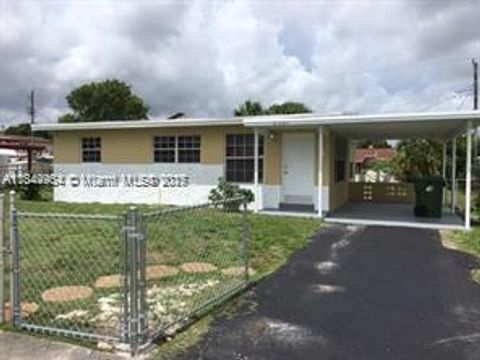
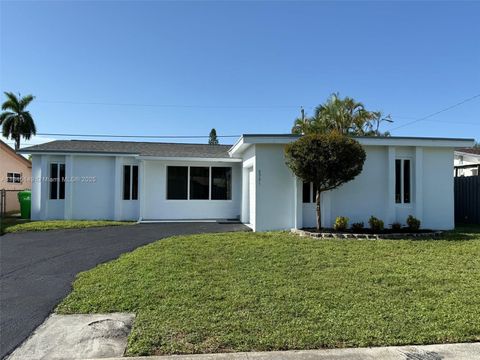
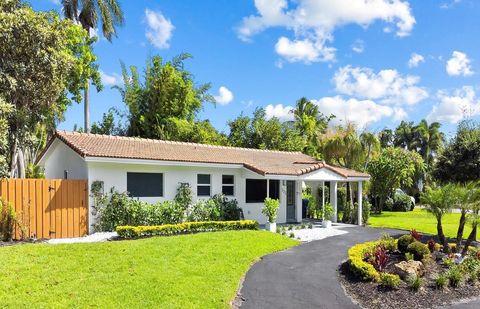
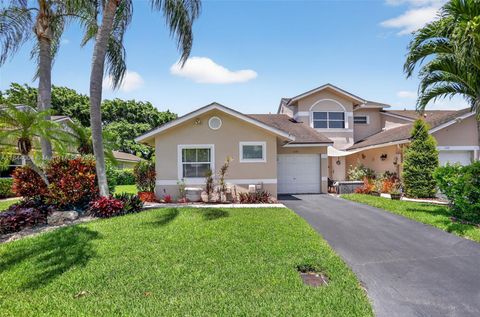
Active
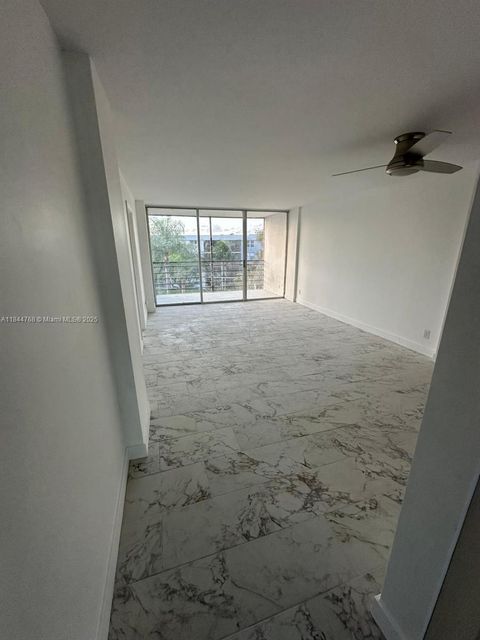
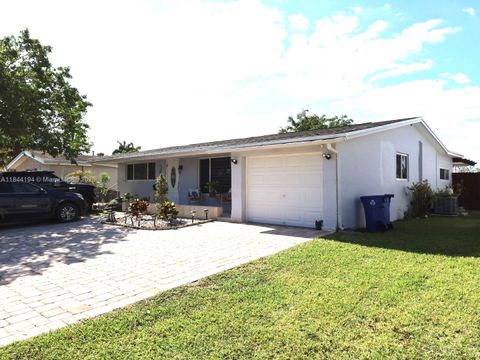
$475,000
3
bds
|
2
ba
|
1,197
sqft
|
built
1963
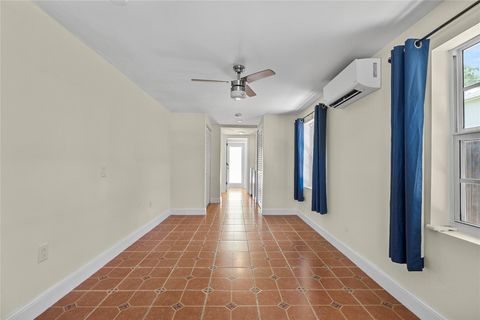
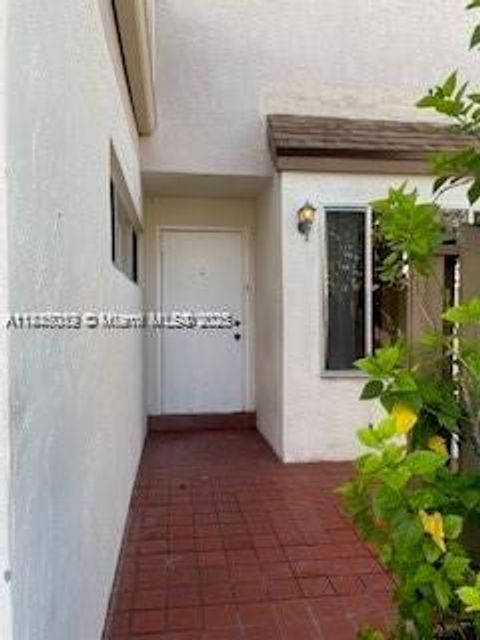
4401 NE 13th Ave, Oakland Park, FL 33334
$-226
Cash flow
-2.5%
Cash-on-Cash Return
5.6%
Cap rate
0.7%
Rent to Value Ratio
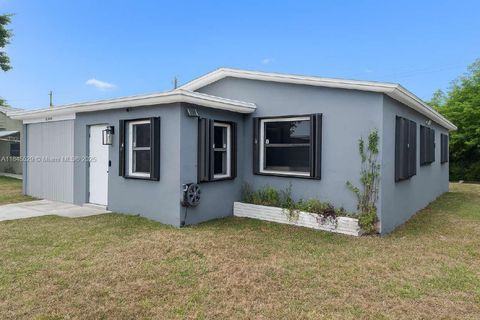
Active
$165,000
1
bds
|
1
ba
|
615
sqft
|
built
1987
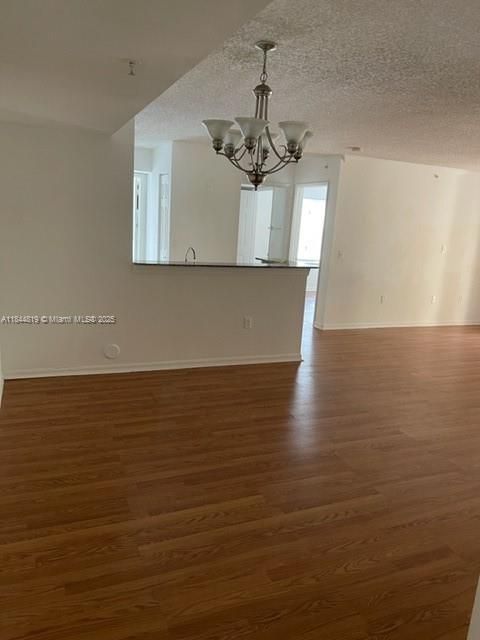
5686 Rock Island Rd, Tamarac, FL 33319
$-260
Cash flow
-8.2%
Cash-on-Cash Return
4.3%
Cap rate
1.0%
Rent to Value Ratio
8,153 out of 9,522 properties for sale in Broward County
Limited Results Shown
Create a free account, or log in to reveal all property listings and enjoy the complete experience.
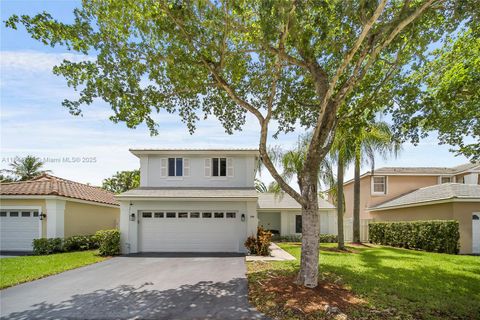
Active
$419,000
2
bds
|
2
ba
|
1,270
sqft
|
built
1973
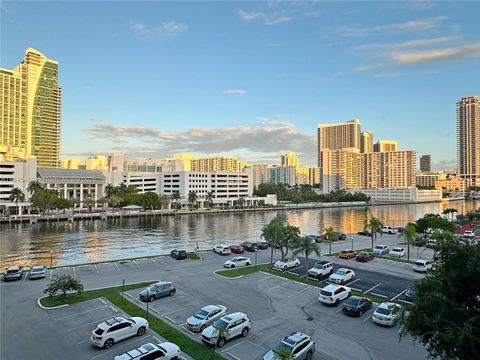
3800 S Ocean Dr, Hollywood, FL 33019
$-2,021
Cash flow
-25.2%
Cash-on-Cash Return
0.4%
Cap rate
0.7%
Rent to Value Ratio
Active
$945,000
3
bds
|
2
ba
|
1,344
sqft
|
built
1954
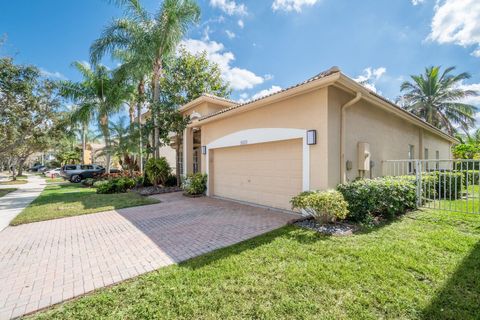
424 NE 27th Dr, Wilton Manors, FL 33334
$-1,808
Cash flow
-10.0%
Cash-on-Cash Return
3.9%
Cap rate
0.7%
Rent to Value Ratio
Active
$370,000
3
bds
|
2
ba
|
825
sqft
|
built
1962
1731 NW 26th Ave, Fort Lauderdale, FL 33311
$-472
Cash flow
-6.7%
Cash-on-Cash Return
4.6%
Cap rate
0.8%
Rent to Value Ratio
Active
$375,000
3
bds
|
1
ba
|
1,050
sqft
|
built
1956
2231 NW 9th Ct, Fort Lauderdale, FL 33311
$-455
Cash flow
-6.3%
Cash-on-Cash Return
4.7%
Cap rate
0.7%
Rent to Value Ratio
Active
$524,000
2
bds
|
3
ba
|
1,185
sqft
|
built
2007
315 NE 3rd Ave, Fort Lauderdale, FL 33301
$-2,711
Cash flow
-27.0%
Cash-on-Cash Return
-0.1%
Cap rate
0.6%
Rent to Value Ratio
Active
$1,024,000
4
bds
|
3
ba
|
3,014
sqft
|
built
1995
541 NW 110th Ave, Plantation, FL 33324
$-1,851
Cash flow
-9.4%
Cash-on-Cash Return
4.0%
Cap rate
0.6%
Rent to Value Ratio
Active
$714,000
3
bds
|
3
ba
|
1,560
sqft
|
built
1950
15 SE 13th Ave, Pompano Beach, FL 33060
$-1,981
Cash flow
-14.5%
Cash-on-Cash Return
2.8%
Cap rate
0.6%
Rent to Value Ratio
Active
$314,900
2
bds
|
2
ba
|
1,080
sqft
|
built
2001
2494 Centergate Dr, Miramar, FL 33025
$-757
Cash flow
-12.5%
Cash-on-Cash Return
3.3%
Cap rate
0.8%
Rent to Value Ratio
Active
$224,900
1
bds
|
1
ba
|
875
sqft
|
built
1981
400 Leslie Dr, Hallandale Beach, FL 33009
$-328
Cash flow
-7.6%
Cash-on-Cash Return
4.4%
Cap rate
1.1%
Rent to Value Ratio
Active
$805,000
3
bds
|
2
ba
|
2,116
sqft
|
built
1998
16524 Turquoise Trl, Weston, FL 33331
$-2,104
Cash flow
-13.6%
Cash-on-Cash Return
3.0%
Cap rate
0.6%
Rent to Value Ratio
Active
$220,000
3
bds
|
3
ba
|
1,770
sqft
|
built
1979
879 NW 81st Way, Plantation, FL 33324
$-270
Cash flow
-6.4%
Cash-on-Cash Return
4.7%
Cap rate
1.3%
Rent to Value Ratio
Active
$489,000
3
bds
|
2
ba
|
1,560
sqft
|
built
1957
3548 SW 13th Ct, Fort Lauderdale, FL 33312
$-699
Cash flow
-7.5%
Cash-on-Cash Return
4.4%
Cap rate
0.7%
Rent to Value Ratio
Active
$610,000
3
bds
|
2
ba
|
1,592
sqft
|
built
1976
140 SW 126th Ave, Plantation, FL 33325
$-1,169
Cash flow
-10.0%
Cash-on-Cash Return
3.8%
Cap rate
0.6%
Rent to Value Ratio
Active
$675,000
3
bds
|
2
ba
|
2,116
sqft
|
built
1976
1328 NW 86th Way, Coral Springs, FL 33071
$-1,967
Cash flow
-15.2%
Cash-on-Cash Return
2.7%
Cap rate
0.5%
Rent to Value Ratio
Active
$319,000
2
bds
|
2
ba
|
1,260
sqft
|
built
1979
535 Oaks Dr, Pompano Beach, FL 33069
$-845
Cash flow
-13.8%
Cash-on-Cash Return
3.0%
Cap rate
0.8%
Rent to Value Ratio
Active
$950,000
2
bds
|
0
ba
|
0
sqft
|
built
1954
1940 Adams St, Hollywood, FL 33020
$-4,699
Cash flow
-25.8%
Cash-on-Cash Return
0.2%
Cap rate
0.2%
Rent to Value Ratio
Active
$564,900
3
bds
|
3
ba
|
1,536
sqft
|
built
1961
6201 SW 20th St, Miramar, FL 33023
$-1,489
Cash flow
-13.8%
Cash-on-Cash Return
3.0%
Cap rate
0.6%
Rent to Value Ratio
Active
$309,000
1
bds
|
1
ba
|
800
sqft
|
built
1967
301 N Ocean Blvd, Pompano Beach, FL 33062
$-500
Cash flow
-8.4%
Cash-on-Cash Return
4.2%
Cap rate
0.8%
Rent to Value Ratio
Active
$558,000
3
bds
|
2
ba
|
1,433
sqft
|
built
1973
8981 NW 24th St, Sunrise, FL 33322
$-1,179
Cash flow
-11.0%
Cash-on-Cash Return
3.6%
Cap rate
0.6%
Rent to Value Ratio
Active
$525,000
3
bds
|
2
ba
|
1,316
sqft
|
built
1955
2455 Wiley Ct, Hollywood, FL 33020
$-790
Cash flow
-7.9%
Cash-on-Cash Return
4.3%
Cap rate
0.7%
Rent to Value Ratio
Active
$179,500
2
bds
|
2
ba
|
1,000
sqft
|
built
1974
2320 S Cypress Bend Dr, Pompano Beach, FL 33069
$-410
Cash flow
-11.9%
Cash-on-Cash Return
3.4%
Cap rate
1.1%
Rent to Value Ratio
Active
$775,000
3
bds
|
3
ba
|
1,618
sqft
|
built
1980
1194 Hillsboro Mile, Hillsboro Beach, FL 33062
$-1,439
Cash flow
-9.7%
Cash-on-Cash Return
3.9%
Cap rate
0.7%
Rent to Value Ratio
Active
$163,000
2
bds
|
2
ba
|
975
sqft
|
built
1976
114 Royal Park Dr, Oakland Park, FL 33309
$-593
Cash flow
-19.0%
Cash-on-Cash Return
1.8%
Cap rate
1.2%
Rent to Value Ratio
Active
$180,000
2
bds
|
2
ba
|
790
sqft
|
built
1973
5100 SW 41st St, Pembroke Park, FL 33023
$-574
Cash flow
-16.6%
Cash-on-Cash Return
2.3%
Cap rate
1.0%
Rent to Value Ratio
Active
$11,995,000
6
bds
|
8
ba
|
6,263
sqft
|
built
1999
110 Holiday Dr, Hallandale Beach, FL 33009
$-62,782
Cash flow
-27.3%
Cash-on-Cash Return
-0.1%
Cap rate
0.1%
Rent to Value Ratio
Active
$899,000
4
bds
|
3
ba
|
2,204
sqft
|
built
1957
817 NW 30th St, Wilton Manors, FL 33311
$-1,515
Cash flow
-8.8%
Cash-on-Cash Return
4.1%
Cap rate
0.7%
Rent to Value Ratio
Active
$580,000
3
bds
|
2
ba
|
1,537
sqft
|
built
1974
9170 NW 24th Pl, Sunrise, FL 33322
$-1,103
Cash flow
-9.9%
Cash-on-Cash Return
3.9%
Cap rate
0.6%
Rent to Value Ratio
Active
$875,000
3
bds
|
2
ba
|
1,561
sqft
|
built
1998
1571 Breakwater Ter, Hollywood, FL 33019
$-3,113
Cash flow
-18.6%
Cash-on-Cash Return
1.9%
Cap rate
0.6%
Rent to Value Ratio
Active
$539,000
2
bds
|
3
ba
|
1,131
sqft
|
built
1995
1051 Sorrento Dr, Weston, FL 33326
$-1,668
Cash flow
-16.1%
Cash-on-Cash Return
2.4%
Cap rate
0.5%
Rent to Value Ratio
Active
$335,900
3
bds
|
2
ba
|
952
sqft
|
built
1954
2316 NW 13th Ct, Fort Lauderdale, FL 33311
$-314
Cash flow
-4.9%
Cash-on-Cash Return
5.0%
Cap rate
0.7%
Rent to Value Ratio
Active
$995,000
2
bds
|
2
ba
|
1,458
sqft
|
built
1956
332 NE 29th St, Wilton Manors, FL 33334
$-2,897
Cash flow
-15.2%
Cash-on-Cash Return
2.7%
Cap rate
0.5%
Rent to Value Ratio
Active
$248,000
2
bds
|
2
ba
|
1,100
sqft
|
built
1988
2846 S University Dr, Davie, FL 33328
$-888
Cash flow
-18.7%
Cash-on-Cash Return
1.8%
Cap rate
0.9%
Rent to Value Ratio
Active
$1,250,000
2
bds
|
2
ba
|
1,444
sqft
|
built
1984
1710 S Ocean Ln, Fort Lauderdale, FL 33316
$-6,120
Cash flow
-25.5%
Cash-on-Cash Return
0.3%
Cap rate
0.5%
Rent to Value Ratio
Active
$450,000
3
bds
|
2
ba
|
1,740
sqft
|
built
1982
606 Deer Creek Lake Point North Ln, Deerfield Beach, FL 33442
$-1,414
Cash flow
-16.4%
Cash-on-Cash Return
2.4%
Cap rate
0.7%
Rent to Value Ratio
Active
$419,000
3
bds
|
2
ba
|
1,364
sqft
|
built
1992
1245 NW 52nd Way, Deerfield Beach, FL 33442
$-1,135
Cash flow
-14.1%
Cash-on-Cash Return
2.9%
Cap rate
0.7%
Rent to Value Ratio
Active
$685,000
3
bds
|
3
ba
|
1,806
sqft
|
built
1989
9536 NW 9th Ct, Plantation, FL 33324
$-1,740
Cash flow
-13.3%
Cash-on-Cash Return
3.1%
Cap rate
0.5%
Rent to Value Ratio
Active
$575,000
3
bds
|
3
ba
|
1,793
sqft
|
built
2005
4331 SW 124th Way, Miramar, FL 33027
$-2,036
Cash flow
-18.5%
Cash-on-Cash Return
1.9%
Cap rate
0.6%
Rent to Value Ratio
Active
$179,000
2
bds
|
2
ba
|
875
sqft
|
built
1970
2221 NE 68th St, Fort Lauderdale, FL 33308
$-446
Cash flow
-13.0%
Cash-on-Cash Return
3.2%
Cap rate
1.1%
Rent to Value Ratio