Broward County Investment Properties for Sale
Browse homes for sale and investment properties in Broward County. Refine your search by price, property type, or more.
Best cash flowing properties in Broward County
Active
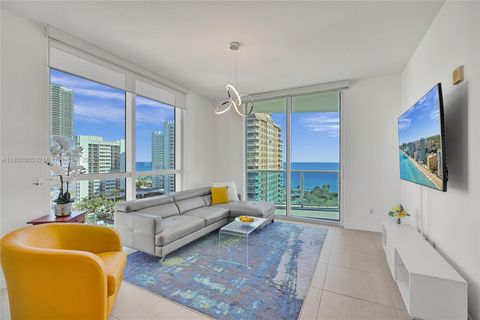
$349,900
2
bds
|
2
ba
|
990
sqft
|
built
1973
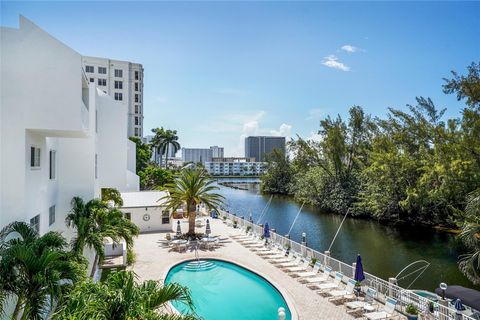
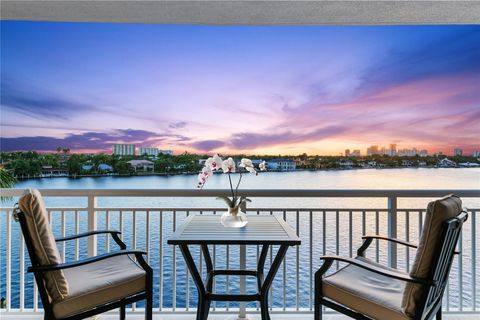
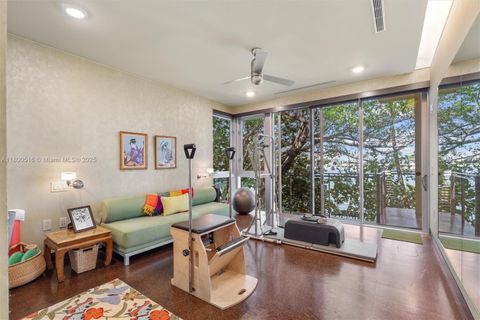
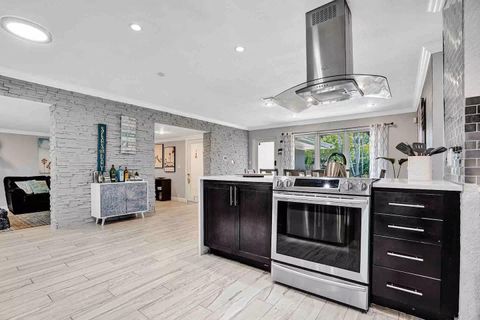
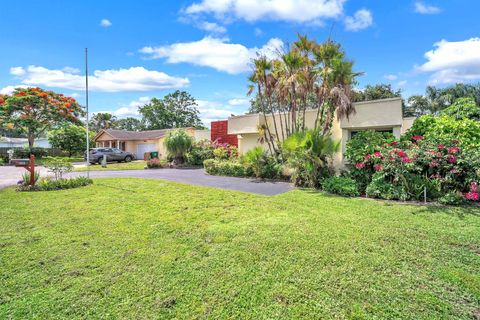
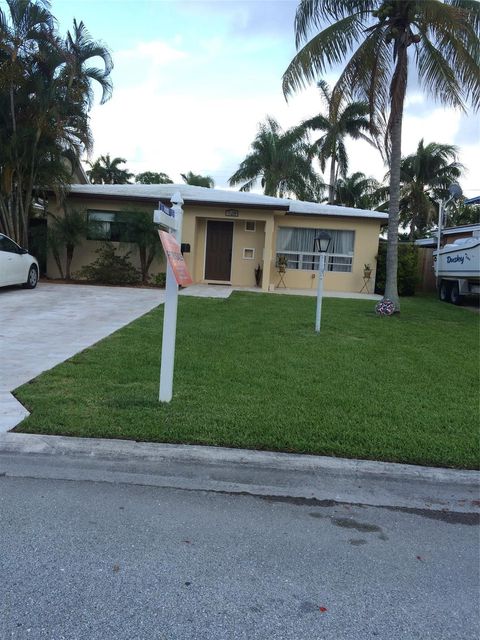
400 N Riverside Dr, Pompano Beach, FL 33062
$7
Cash flow
0.1%
Cash-on-Cash Return
6.2%
Cap rate
0.8%
Rent to Value Ratio
Active
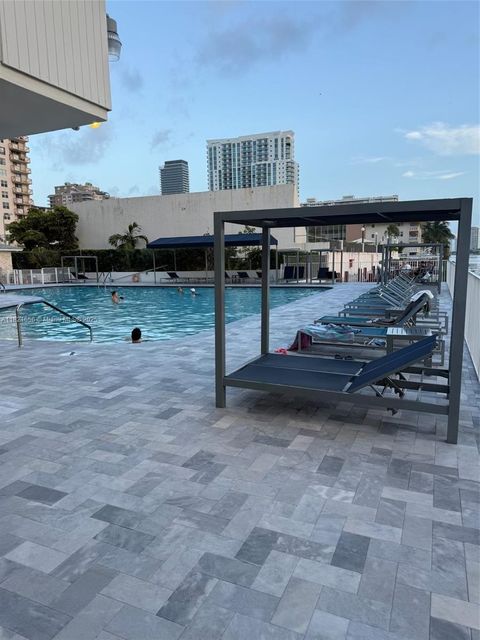
$167,500
1
bds
|
1
ba
|
633
sqft
|
built
1992
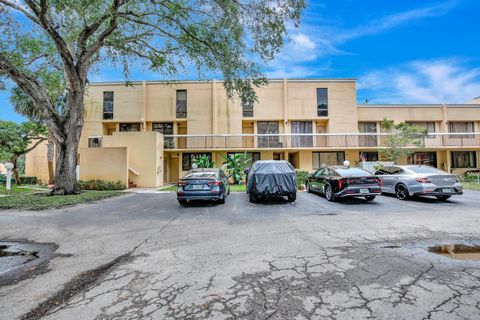
4055 W Mc Nab Rd, Pompano Beach, FL 33069
$-356
Cash flow
-11.1%
Cash-on-Cash Return
3.6%
Cap rate
1.0%
Rent to Value Ratio
7,970 out of 9,311 properties for sale in Broward County
Limited Results Shown
Create a free account, or log in to reveal all property listings and enjoy the complete experience.
Active
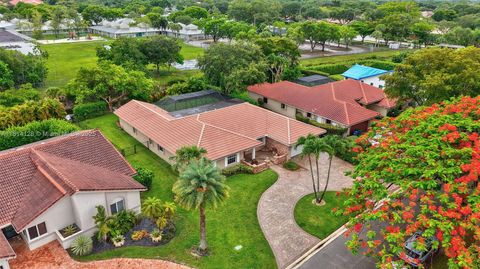
$665,000
3
bds
|
3
ba
|
2,017
sqft
|
built
2010
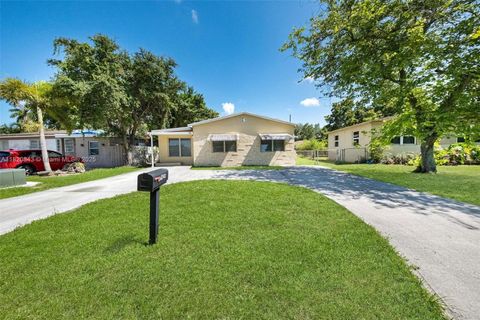
2837 Hidden Harbour Ct, Fort Lauderdale, FL 33312
$-2,393
Cash flow
-18.8%
Cash-on-Cash Return
1.8%
Cap rate
0.6%
Rent to Value Ratio
Active
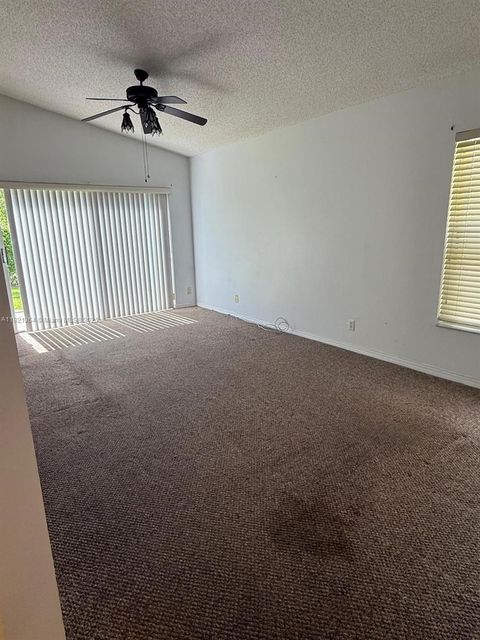
$879,000
4
bds
|
3
ba
|
3,347
sqft
|
built
1997
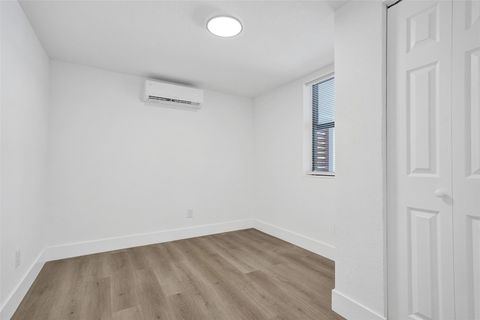
15651 NW 14th Ct, Pembroke Pines, FL 33028
$-1,884
Cash flow
-11.2%
Cash-on-Cash Return
3.6%
Cap rate
0.6%
Rent to Value Ratio
Active
$324,000
2
bds
|
2
ba
|
835
sqft
|
built
1974
2860 NE 14th Street Cswy, Pompano Beach, FL 33062
$-766
Cash flow
-12.3%
Cash-on-Cash Return
3.3%
Cap rate
0.8%
Rent to Value Ratio
Active
$875,000
2
bds
|
2
ba
|
1,436
sqft
|
built
1971
511 Bayshore Dr, Fort Lauderdale, FL 33304
$-3,437
Cash flow
-20.5%
Cash-on-Cash Return
1.4%
Cap rate
0.5%
Rent to Value Ratio
Active
$27,500,000
7
bds
|
7
ba
|
6,250
sqft
|
built
2005
2500 Mercedes Dr, Fort Lauderdale, FL 33316
$-141,438
Cash flow
-26.8%
Cash-on-Cash Return
0.0%
Cap rate
0.0%
Rent to Value Ratio
Active
$899,000
3
bds
|
2
ba
|
1,332
sqft
|
built
1956
616 NW 21st St, Wilton Manors, FL 33311
$-1,748
Cash flow
-10.1%
Cash-on-Cash Return
3.8%
Cap rate
0.6%
Rent to Value Ratio
Active
$629,900
2
bds
|
2
ba
|
1,341
sqft
|
built
2007
1945 S Ocean Dr, Hallandale Beach, FL 33009
$-2,370
Cash flow
-19.6%
Cash-on-Cash Return
1.6%
Cap rate
0.7%
Rent to Value Ratio
Active
$319,000
2
bds
|
2
ba
|
1,060
sqft
|
built
1972
1833 S Ocean Dr, Hallandale Beach, FL 33009
$-1,347
Cash flow
-22.0%
Cash-on-Cash Return
1.1%
Cap rate
0.7%
Rent to Value Ratio
Active
$785,000
4
bds
|
3
ba
|
2,505
sqft
|
built
1987
5655 NW 86th Ave, Coral Springs, FL 33067
$-1,263
Cash flow
-8.4%
Cash-on-Cash Return
4.2%
Cap rate
0.7%
Rent to Value Ratio
Active
$509,000
3
bds
|
2
ba
|
1,642
sqft
|
built
1999
5657 NW 121st Ave, Coral Springs, FL 33076
$-763
Cash flow
-7.8%
Cash-on-Cash Return
4.3%
Cap rate
0.7%
Rent to Value Ratio
Active
$450,000
2
bds
|
2
ba
|
805
sqft
|
built
1959
1521 NW 62nd Ter, Margate, FL 33063
$-791
Cash flow
-9.2%
Cash-on-Cash Return
4.0%
Cap rate
0.6%
Rent to Value Ratio
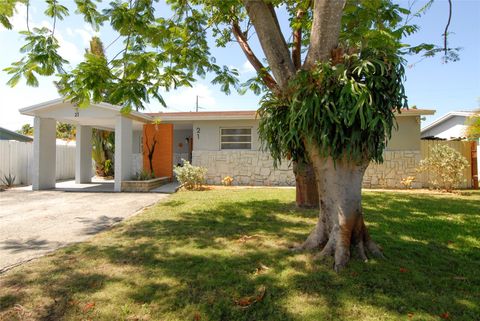
Active
$549,000
3
bds
|
2
ba
|
1,234
sqft
|
built
1960
21 NE 57th Ct, Oakland Park, FL 33334
$-927
Cash flow
-8.8%
Cash-on-Cash Return
4.1%
Cap rate
0.7%
Rent to Value Ratio
Active
$1,650,000
2
bds
|
3
ba
|
2,129
sqft
|
built
2004
333 Las Olas Way, Fort Lauderdale, FL 33301
$-7,839
Cash flow
-24.8%
Cash-on-Cash Return
0.4%
Cap rate
0.4%
Rent to Value Ratio
Active
$1,099,900
3
bds
|
2
ba
|
1,700
sqft
|
built
1968
2750 NE 45th St, Lighthouse Point, FL 33064
$-2,681
Cash flow
-12.7%
Cash-on-Cash Return
3.2%
Cap rate
0.4%
Rent to Value Ratio
Active
$625,000
3
bds
|
2
ba
|
1,650
sqft
|
built
1975
7460 SW 42nd Pl, Davie, FL 33314
$-1,113
Cash flow
-9.3%
Cash-on-Cash Return
4.0%
Cap rate
0.6%
Rent to Value Ratio
Active
$524,900
3
bds
|
2
ba
|
1,261
sqft
|
built
1973
7151 Pershing St, Hollywood, FL 33024
$-757
Cash flow
-7.5%
Cash-on-Cash Return
4.4%
Cap rate
0.6%
Rent to Value Ratio
Active
$420,000
2
bds
|
3
ba
|
1,228
sqft
|
built
1985
3900 NE 18th Ave, Oakland Park, FL 33334
$-1,308
Cash flow
-16.2%
Cash-on-Cash Return
2.4%
Cap rate
0.7%
Rent to Value Ratio
Active
$259,000
2
bds
|
2
ba
|
768
sqft
|
built
1971
2901 NE 51st St, Fort Lauderdale, FL 33308
$-575
Cash flow
-11.6%
Cash-on-Cash Return
3.5%
Cap rate
0.9%
Rent to Value Ratio
Active
$899,000
2
bds
|
2
ba
|
1,870
sqft
|
built
1967
4300 N Ocean Blvd, Fort Lauderdale, FL 33308
$-3,651
Cash flow
-21.2%
Cash-on-Cash Return
1.3%
Cap rate
0.7%
Rent to Value Ratio
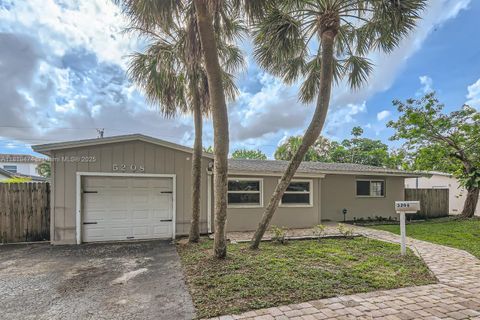
Active
$610,000
4
bds
|
2
ba
|
0
sqft
|
built
1969
5208 SW 91st Ter, Cooper City, FL 33328
$-1,388
Cash flow
-11.9%
Cash-on-Cash Return
3.4%
Cap rate
0.6%
Rent to Value Ratio
Active
$2,400,000
4
bds
|
6
ba
|
4,748
sqft
|
built
2006
15093 SW 16th St, Weston, FL 33326
$-8,139
Cash flow
-17.7%
Cash-on-Cash Return
2.1%
Cap rate
0.5%
Rent to Value Ratio
Active
$425,000
2
bds
|
1
ba
|
1,062
sqft
|
built
1969
5708 NW 48th Ave, Tamarac, FL 33319
$-1,150
Cash flow
-14.1%
Cash-on-Cash Return
2.9%
Cap rate
0.5%
Rent to Value Ratio
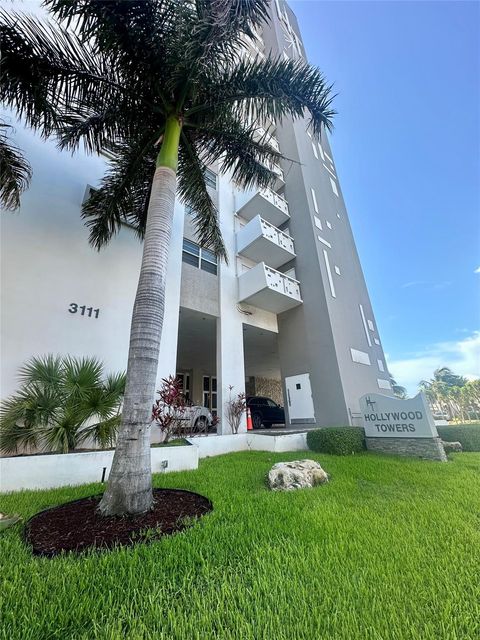
Active
$474,900
1
bds
|
2
ba
|
812
sqft
|
built
1967
3111 N Ocean Dr, Hollywood, FL 33019
$-1,967
Cash flow
-21.6%
Cash-on-Cash Return
1.2%
Cap rate
0.6%
Rent to Value Ratio
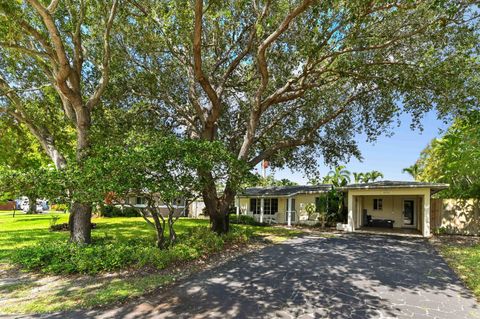
Active
$799,900
3
bds
|
2
ba
|
1,586
sqft
|
built
1959
4311 NE 16th Ave, Oakland Park, FL 33334
$-1,851
Cash flow
-12.1%
Cash-on-Cash Return
3.4%
Cap rate
0.6%
Rent to Value Ratio
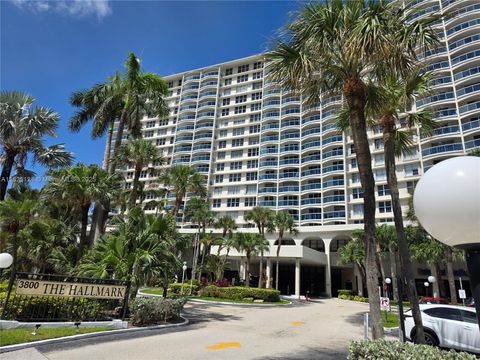
Active
$350,000
2
bds
|
2
ba
|
1,202
sqft
|
built
1973
3800 S Ocean Dr, Hollywood, FL 33019
$-1,516
Cash flow
-22.6%
Cash-on-Cash Return
0.9%
Cap rate
0.7%
Rent to Value Ratio
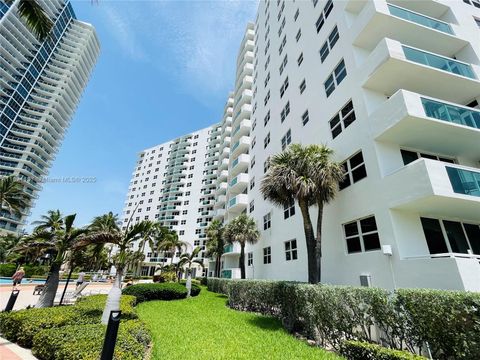
Active
$285,000
1
bds
|
1
ba
|
883
sqft
|
built
1966
3001 S Ocean Dr, Hollywood, FL 33019
$-1,075
Cash flow
-19.7%
Cash-on-Cash Return
1.6%
Cap rate
1.0%
Rent to Value Ratio
Active
$825,000
3
bds
|
2
ba
|
1,409
sqft
|
built
1952
1126 Lincoln St, Hollywood, FL 33019
$-2,208
Cash flow
-14.0%
Cash-on-Cash Return
2.9%
Cap rate
0.5%
Rent to Value Ratio
Active
$310,000
2
bds
|
3
ba
|
1,300
sqft
|
built
1981
2821 SW 87th Ave, Davie, FL 33328
$-776
Cash flow
-13.1%
Cash-on-Cash Return
3.1%
Cap rate
0.8%
Rent to Value Ratio
Active
$442,000
4
bds
|
2
ba
|
1,290
sqft
|
built
1956
6428 Plunkett St, Hollywood, FL 33023
$-657
Cash flow
-7.8%
Cash-on-Cash Return
4.4%
Cap rate
0.7%
Rent to Value Ratio
Active
$569,000
3
bds
|
2
ba
|
1,350
sqft
|
built
1953
1302 S 22nd Ct, Hollywood, FL 33020
$-1,314
Cash flow
-12.0%
Cash-on-Cash Return
3.4%
Cap rate
0.4%
Rent to Value Ratio
Active
$299,000
1
bds
|
2
ba
|
700
sqft
|
built
1972
664 SE 20th Ave, Deerfield Beach, FL 33441
$-1,066
Cash flow
-18.6%
Cash-on-Cash Return
1.9%
Cap rate
0.7%
Rent to Value Ratio
Active
$730,000
4
bds
|
4
ba
|
3,385
sqft
|
built
1977
5706 White Hickory Cir, Tamarac, FL 33319
$-1,800
Cash flow
-12.9%
Cash-on-Cash Return
3.2%
Cap rate
0.5%
Rent to Value Ratio
Active
$735,000
3
bds
|
2
ba
|
2,094
sqft
|
built
1968
6331 NE 22nd Ave, Fort Lauderdale, FL 33308
$-994
Cash flow
-7.1%
Cash-on-Cash Return
4.5%
Cap rate
0.6%
Rent to Value Ratio
Active
$734,800
3
bds
|
2
ba
|
1,908
sqft
|
built
1957
6285 Pine Ter, Plantation, FL 33317
$-1,589
Cash flow
-11.3%
Cash-on-Cash Return
3.6%
Cap rate
0.5%
Rent to Value Ratio
Active
$1,100,000
3
bds
|
3
ba
|
2,366
sqft
|
built
2000
1382 Harbor Vw W, Hollywood, FL 33019
$-3,589
Cash flow
-17.0%
Cash-on-Cash Return
2.2%
Cap rate
0.6%
Rent to Value Ratio
Active
$367,000
2
bds
|
2
ba
|
1,266
sqft
|
built
2007
140 S Dixie Hwy, Hollywood, FL 33020
$-1,637
Cash flow
-23.3%
Cash-on-Cash Return
0.8%
Cap rate
0.7%
Rent to Value Ratio
Active
$280,000
3
bds
|
2
ba
|
1,390
sqft
|
built
1968
3000 N Palm Aire Dr, Pompano Beach, FL 33069
$-836
Cash flow
-15.6%
Cash-on-Cash Return
2.6%
Cap rate
0.9%
Rent to Value Ratio
Active
$269,000
2
bds
|
2
ba
|
1,280
sqft
|
built
1981
2500 Parkview Dr, Hallandale Beach, FL 33009
$-774
Cash flow
-15.0%
Cash-on-Cash Return
2.7%
Cap rate
1.0%
Rent to Value Ratio