Broward County Investment Properties for Sale
Browse homes for sale and investment properties in Broward County. Refine your search by price, property type, or more.
Best cash flowing properties in Broward County
Active
$275,000
2
bds
|
2
ba
|
1,280
sqft
|
built
1974
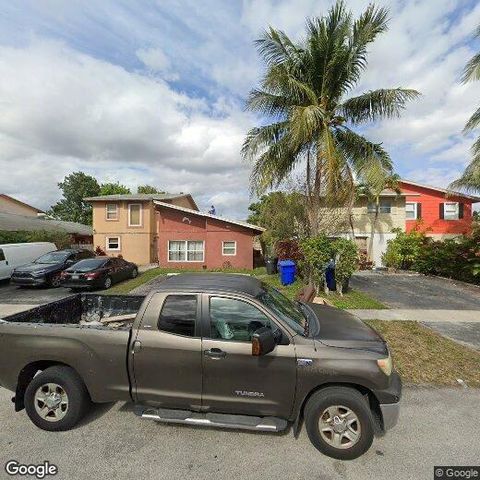
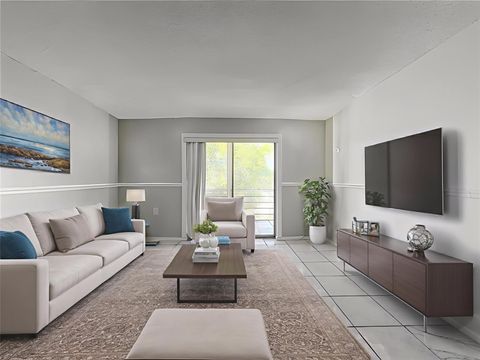
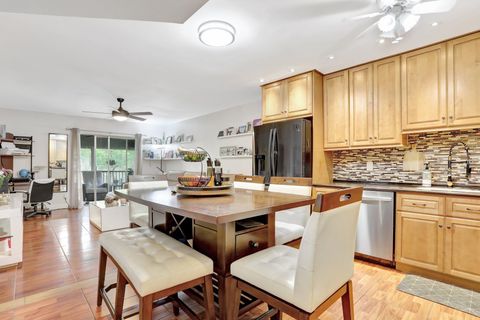
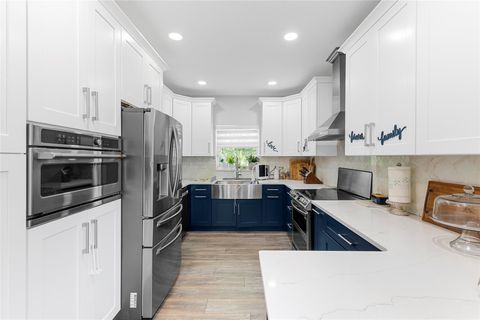
7955 SW 6th Ct, North Lauderdale, FL 33068
$-187
Cash flow
-3.5%
Cash-on-Cash Return
5.3%
Cap rate
0.8%
Rent to Value Ratio
Active
$189,000
2
bds
|
2
ba
|
1,290
sqft
|
built
1974
4304 NW 9th Ave, Deerfield Beach, FL 33064
$-209
Cash flow
-5.8%
Cash-on-Cash Return
4.8%
Cap rate
1.2%
Rent to Value Ratio
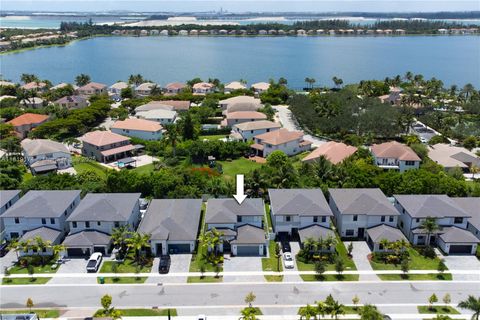
7,970 out of 9,311 properties for sale in Broward County
Limited Results Shown
Create a free account, or log in to reveal all property listings and enjoy the complete experience.
Active
$189,000
2
bds
|
2
ba
|
880
sqft
|
built
1974
257 S Cypress Rd, Pompano Beach, FL 33060
$-656
Cash flow
-18.1%
Cash-on-Cash Return
2.0%
Cap rate
1.1%
Rent to Value Ratio
Active
$615,000
3
bds
|
3
ba
|
2,200
sqft
|
built
2001
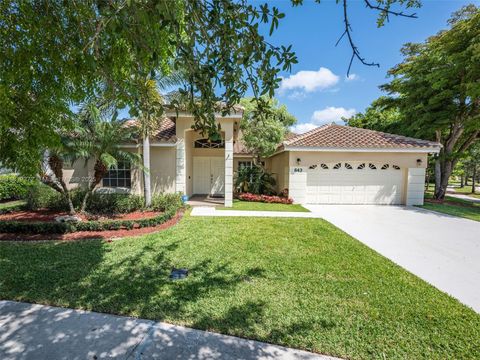
1970 NW 74th Way, Pembroke Pines, FL 33024
$-1,769
Cash flow
-15.0%
Cash-on-Cash Return
2.7%
Cap rate
0.7%
Rent to Value Ratio
Active
$1,079,000
5
bds
|
4
ba
|
2,852
sqft
|
built
1993
643 Lake Blvd, Weston, FL 33326
$-1,402
Cash flow
-6.8%
Cash-on-Cash Return
4.6%
Cap rate
0.7%
Rent to Value Ratio
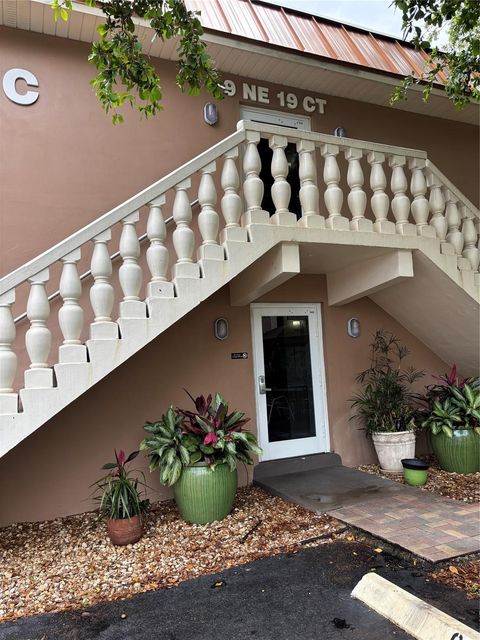
Active
$165,000
1
bds
|
1
ba
|
750
sqft
|
built
1970
9 NE 19th Ct, Wilton Manors, FL 33305
$-604
Cash flow
-19.1%
Cash-on-Cash Return
1.8%
Cap rate
1.0%
Rent to Value Ratio
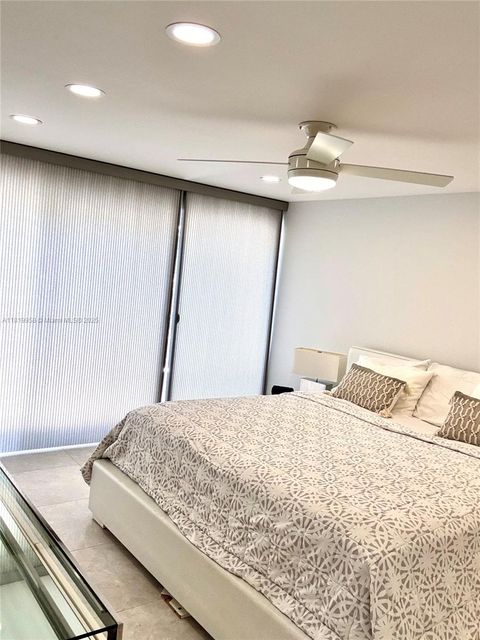
Active
$549,900
2
bds
|
2
ba
|
1,050
sqft
|
built
1977
531 N Ocean Blvd, Pompano Beach, FL 33062
$-1,039
Cash flow
-9.9%
Cash-on-Cash Return
3.9%
Cap rate
0.7%
Rent to Value Ratio
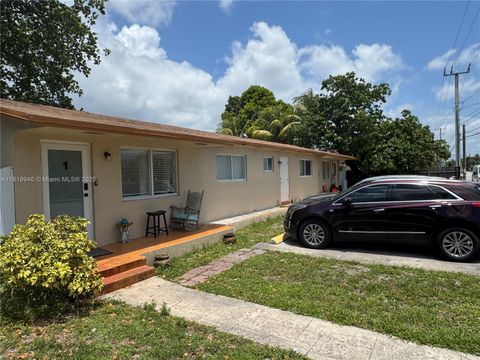
Active
$689,000
bds
|
0
ba
|
1,878
sqft
|
built
1982
2510 SW 62nd Ave, Miramar, FL 33023
$-3,005
Cash flow
-22.8%
Cash-on-Cash Return
0.9%
Cap rate
0.3%
Rent to Value Ratio
Active
$3,250,000
3
bds
|
4
ba
|
3,091
sqft
|
built
2005
3101 S Ocean Dr, Hollywood, FL 33019
$-14,980
Cash flow
-24.0%
Cash-on-Cash Return
0.6%
Cap rate
0.3%
Rent to Value Ratio
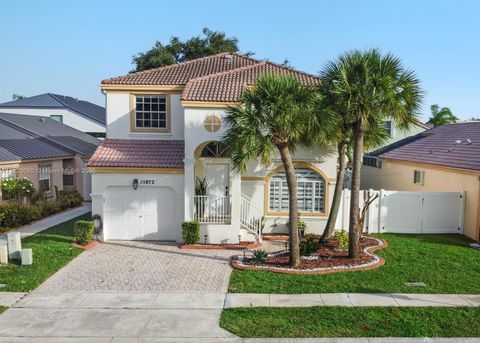
Active
$660,000
4
bds
|
3
ba
|
1,784
sqft
|
built
1999
15872 NW 21st St, Pembroke Pines, FL 33028
$-2,169
Cash flow
-17.1%
Cash-on-Cash Return
2.2%
Cap rate
0.5%
Rent to Value Ratio
Active
$1,849,500
4
bds
|
2
ba
|
2,627
sqft
|
built
1960
331 SE 9th Ct, Pompano Beach, FL 33060
$-5,597
Cash flow
-15.8%
Cash-on-Cash Return
2.5%
Cap rate
0.5%
Rent to Value Ratio
Active
$399,000
1
bds
|
2
ba
|
826
sqft
|
built
2007
315 NE 3rd Ave, Fort Lauderdale, FL 33301
$-1,688
Cash flow
-22.1%
Cash-on-Cash Return
1.1%
Cap rate
0.8%
Rent to Value Ratio
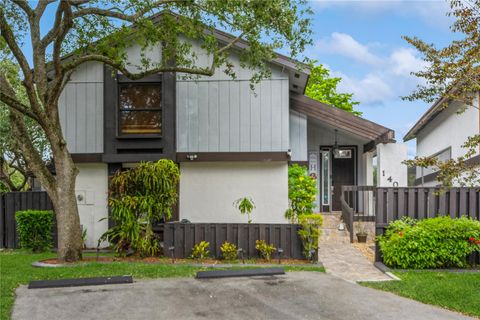
Active
$600,000
3
bds
|
3
ba
|
1,885
sqft
|
built
1979
1400 W Sandpiper Cir, Pembroke Pines, FL 33026
$-1,148
Cash flow
-10.0%
Cash-on-Cash Return
3.9%
Cap rate
0.7%
Rent to Value Ratio
Active
$1,850,000
4
bds
|
4
ba
|
3,199
sqft
|
built
2000
10771 Hawks Vista St, Plantation, FL 33324
$-6,991
Cash flow
-19.7%
Cash-on-Cash Return
1.6%
Cap rate
0.4%
Rent to Value Ratio
Active
$1,100,000
4
bds
|
3
ba
|
2,704
sqft
|
built
2023
17540 SW 46th St, Miramar, FL 33029
$-2,551
Cash flow
-12.1%
Cash-on-Cash Return
3.4%
Cap rate
0.5%
Rent to Value Ratio
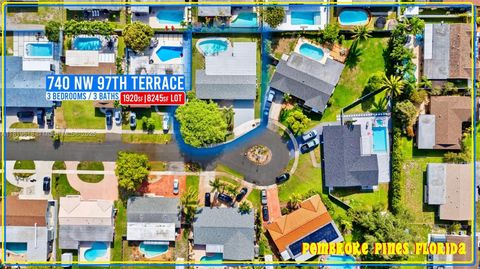
Active
$659,000
3
bds
|
3
ba
|
1,920
sqft
|
built
1973
740 NW 97th Ter, Pembroke Pines, FL 33024
$-1,148
Cash flow
-9.1%
Cash-on-Cash Return
4.1%
Cap rate
0.5%
Rent to Value Ratio
Active
$1,850,000
5
bds
|
5
ba
|
4,106
sqft
|
built
2022
13005 Addilyn Ct, Davie, FL 33325
$-3,972
Cash flow
-11.2%
Cash-on-Cash Return
3.6%
Cap rate
0.6%
Rent to Value Ratio
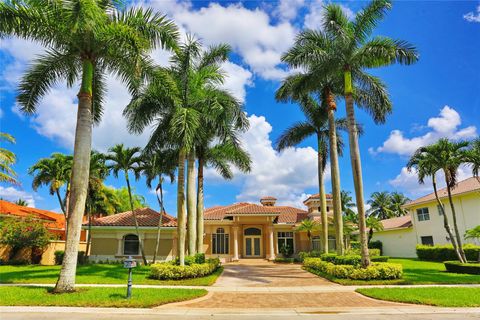
Active
$999,999
5
bds
|
3
ba
|
2,604
sqft
|
built
1995
803 Heritage Dr, Weston, FL 33326
$-2,392
Cash flow
-12.5%
Cash-on-Cash Return
3.3%
Cap rate
0.6%
Rent to Value Ratio
Active
$1,550,000
4
bds
|
3
ba
|
1,978
sqft
|
built
1954
1719 Poinsettia Dr, Fort Lauderdale, FL 33305
$-5,354
Cash flow
-18.0%
Cash-on-Cash Return
2.0%
Cap rate
0.4%
Rent to Value Ratio
Active
$1,150,000
3
bds
|
4
ba
|
2,364
sqft
|
built
2001
25 Hendricks Isle, Fort Lauderdale, FL 33301
$-777
Cash flow
-3.5%
Cash-on-Cash Return
5.3%
Cap rate
0.8%
Rent to Value Ratio
Active
$450,000
3
bds
|
3
ba
|
1,554
sqft
|
built
2022
166 SE 5th Ct, Deerfield Beach, FL 33441
$-897
Cash flow
-10.4%
Cash-on-Cash Return
3.8%
Cap rate
0.8%
Rent to Value Ratio
Active
$325,000
1
bds
|
2
ba
|
708
sqft
|
built
1966
1333 E Hallandale Beach Blvd, Hallandale Beach, FL 33009
$-1,108
Cash flow
-17.8%
Cash-on-Cash Return
2.1%
Cap rate
0.6%
Rent to Value Ratio
Active
$950,000
2
bds
|
2
ba
|
1,375
sqft
|
built
1941
607 NE 17th Ave, Fort Lauderdale, FL 33304
$-1,873
Cash flow
-10.3%
Cash-on-Cash Return
3.8%
Cap rate
0.5%
Rent to Value Ratio
Active
$222,999
2
bds
|
2
ba
|
905
sqft
|
built
1985
1105 S Flagler Ave, Pompano Beach, FL 33060
$-357
Cash flow
-8.4%
Cash-on-Cash Return
4.2%
Cap rate
0.9%
Rent to Value Ratio
Active
$259,900
1
bds
|
2
ba
|
870
sqft
|
built
1970
1849 S Ocean Dr, Hallandale Beach, FL 33009
$-1,046
Cash flow
-21.0%
Cash-on-Cash Return
1.3%
Cap rate
0.8%
Rent to Value Ratio
Active
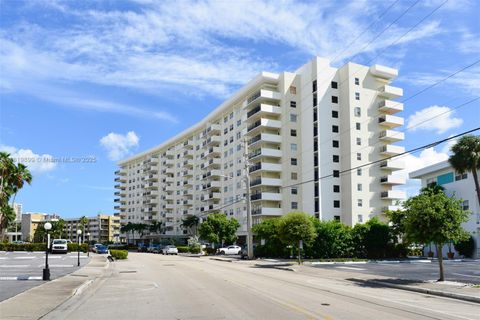
$699,000
2
bds
|
2
ba
|
1,768
sqft
|
built
1973
2751 S Ocean Dr, Hollywood, FL 33019
$-3,232
Cash flow
-24.1%
Cash-on-Cash Return
0.6%
Cap rate
0.6%
Rent to Value Ratio
Active
$1,850,000
4
bds
|
3
ba
|
3,396
sqft
|
built
2001
4268 SW 141st Ave, Davie, FL 33330
$-5,398
Cash flow
-15.2%
Cash-on-Cash Return
2.6%
Cap rate
0.4%
Rent to Value Ratio
Active
$143,500
1
bds
|
2
ba
|
800
sqft
|
built
1973
2029 NW 46th Ave, Lauderhill, FL 33313
$-439
Cash flow
-16.0%
Cash-on-Cash Return
2.5%
Cap rate
1.0%
Rent to Value Ratio
Active
$399,700
3
bds
|
1
ba
|
1,092
sqft
|
built
1960
2771 NW 25th St, Fort Lauderdale, FL 33311
$-470
Cash flow
-6.1%
Cash-on-Cash Return
4.7%
Cap rate
0.7%
Rent to Value Ratio
Active
$239,000
2
bds
|
1
ba
|
903
sqft
|
built
1987
1263 SW 46th Ave, Pompano Beach, FL 33069
$-414
Cash flow
-9.0%
Cash-on-Cash Return
4.1%
Cap rate
0.8%
Rent to Value Ratio
Active
$1,199,999
5
bds
|
5
ba
|
3,587
sqft
|
built
2018
4652 Saxon Rd, Coconut Creek, FL 33073
$-3,546
Cash flow
-15.4%
Cash-on-Cash Return
2.6%
Cap rate
0.5%
Rent to Value Ratio
Active
$499,000
3
bds
|
2
ba
|
1,555
sqft
|
built
1958
6275 Lakeshore Dr, Margate, FL 33063
$-882
Cash flow
-9.2%
Cash-on-Cash Return
4.0%
Cap rate
0.6%
Rent to Value Ratio
Active
$449,999
3
bds
|
2
ba
|
1,103
sqft
|
built
1959
131 NE 55th St, Oakland Park, FL 33334
$-300
Cash flow
-3.5%
Cash-on-Cash Return
5.3%
Cap rate
0.7%
Rent to Value Ratio
Active
$1,150,000
5
bds
|
4
ba
|
3,252
sqft
|
built
1998
2100 NW 127th Ave, Pembroke Pines, FL 33028
$-1,446
Cash flow
-6.6%
Cash-on-Cash Return
4.6%
Cap rate
0.7%
Rent to Value Ratio
Active
$529,000
2
bds
|
2
ba
|
1,490
sqft
|
built
1980
16039 Fairway Ln, Weston, FL 33326
$-1,957
Cash flow
-19.3%
Cash-on-Cash Return
1.7%
Cap rate
0.5%
Rent to Value Ratio
Active
$1,399,000
5
bds
|
5
ba
|
3,798
sqft
|
built
2015
10630 SW 55th St, Cooper City, FL 33328
$-4,814
Cash flow
-18.0%
Cash-on-Cash Return
2.0%
Cap rate
0.5%
Rent to Value Ratio
Active
$299,000
2
bds
|
2
ba
|
1,500
sqft
|
built
1970
401 Golden Isles Dr, Hallandale Beach, FL 33009
$-1,381
Cash flow
-24.1%
Cash-on-Cash Return
0.6%
Cap rate
0.9%
Rent to Value Ratio
Active
$199,000
2
bds
|
2
ba
|
920
sqft
|
built
1981
109 Lake Emerald Dr, Oakland Park, FL 33309
$-796
Cash flow
-20.9%
Cash-on-Cash Return
1.3%
Cap rate
1.0%
Rent to Value Ratio
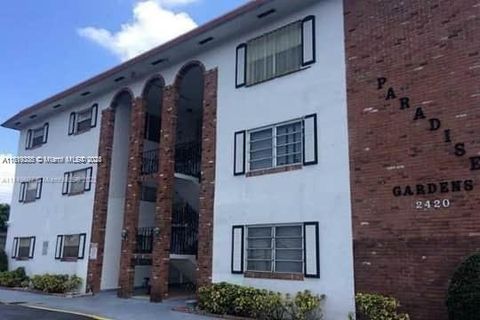
Active
$179,000
2
bds
|
1
ba
|
830
sqft
|
built
1969
2420 Johnson St, Hollywood, FL 33020
$-287
Cash flow
-8.4%
Cash-on-Cash Return
4.2%
Cap rate
1.0%
Rent to Value Ratio
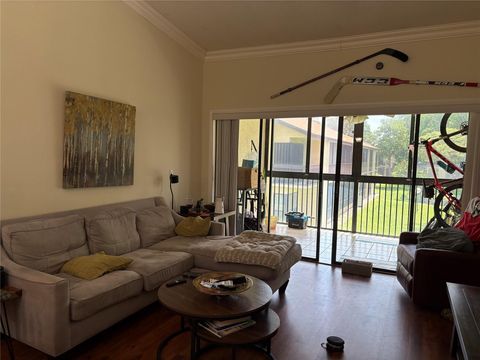
Active
$245,000
2
bds
|
2
ba
|
1,200
sqft
|
built
1983
1921 SW 15th St, Deerfield Beach, FL 33442
$-669
Cash flow
-14.2%
Cash-on-Cash Return
2.9%
Cap rate
0.9%
Rent to Value Ratio