Broward County Investment Properties for Sale
Browse homes for sale and investment properties in Broward County. Refine your search by price, property type, or more.
Best cash flowing properties in Broward County
Active
$228,000
2
bds
|
2
ba
|
996
sqft
|
built
1966
941 Crystal Lake Dr, Deerfield Beach, FL 33064
$-260
Cash flow
-5.9%
Cash-on-Cash Return
4.8%
Cap rate
0.9%
Rent to Value Ratio
Active
$270,000
1
bds
|
1
ba
|
736
sqft
|
built
2004
1919 Van Buren St, Hollywood, FL 33020
$-360
Cash flow
-7.0%
Cash-on-Cash Return
4.5%
Cap rate
0.7%
Rent to Value Ratio
9,761 out of 11,369 properties for sale in Broward County
Limited Results Shown
Create a free account, or log in to reveal all property listings and enjoy the complete experience.
Active
$374,985
3
bds
|
1
ba
|
870
sqft
|
built
1954
524 NW 21st Ave, Fort Lauderdale, FL 33311
$-686
Cash flow
-9.5%
Cash-on-Cash Return
4.0%
Cap rate
0.6%
Rent to Value Ratio
Active
$2,150,000
5
bds
|
5
ba
|
0
sqft
|
built
2024
3523 Forest View Cir, Fort Lauderdale, FL 33312
$-4,162
Cash flow
-10.1%
Cash-on-Cash Return
3.8%
Cap rate
0.5%
Rent to Value Ratio
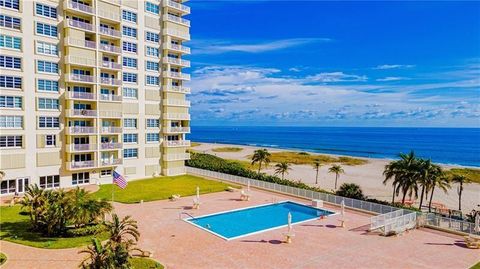
Active
$985,000
2
bds
|
2
ba
|
1,562
sqft
|
built
1973
2751 S Ocean Dr, Hollywood, FL 33019
$-3,726
Cash flow
-19.7%
Cash-on-Cash Return
1.6%
Cap rate
0.5%
Rent to Value Ratio
Active
$459,000
3
bds
|
2
ba
|
1,435
sqft
|
built
1971
3100 NE 48th Ct, Lighthouse Point, FL 33064
$-1,550
Cash flow
-17.6%
Cash-on-Cash Return
2.1%
Cap rate
0.8%
Rent to Value Ratio
Active
$679,000
2
bds
|
2
ba
|
1,570
sqft
|
built
1983
1201 S Ocean Dr, Hollywood, FL 33019
$-3,354
Cash flow
-25.8%
Cash-on-Cash Return
0.2%
Cap rate
0.6%
Rent to Value Ratio
Active
$1,346,000
2
bds
|
2
ba
|
1,145
sqft
|
built
2017
4111 S Ocean Dr, Hollywood, FL 33019
$-4,751
Cash flow
-18.4%
Cash-on-Cash Return
1.9%
Cap rate
0.5%
Rent to Value Ratio
Active
$480,000
3
bds
|
2
ba
|
1,335
sqft
|
built
1956
6181 Wiley St, Hollywood, FL 33023
$-941
Cash flow
-10.2%
Cash-on-Cash Return
3.8%
Cap rate
0.6%
Rent to Value Ratio

Active
$280,000
1
bds
|
1
ba
|
736
sqft
|
built
2003
1900 Van Buren St, Hollywood, FL 33020
$-955
Cash flow
-17.8%
Cash-on-Cash Return
2.1%
Cap rate
0.7%
Rent to Value Ratio
Active
$360,000
2
bds
|
2
ba
|
1,166
sqft
|
built
2004
1919 Van Buren St, Hollywood, FL 33020
$-1,399
Cash flow
-20.3%
Cash-on-Cash Return
1.5%
Cap rate
0.7%
Rent to Value Ratio

Active
$219,000
2
bds
|
1
ba
|
763
sqft
|
built
1968
1021 NE 24th Ave, Pompano Beach, FL 33062
$-400
Cash flow
-9.5%
Cash-on-Cash Return
4.0%
Cap rate
0.8%
Rent to Value Ratio

Active
$305,000
2
bds
|
3
ba
|
1,321
sqft
|
built
1988
3726 Coral Tree Cir, Coconut Creek, FL 33073
$-659
Cash flow
-11.3%
Cash-on-Cash Return
3.6%
Cap rate
0.9%
Rent to Value Ratio
Active
$295,000
1
bds
|
1
ba
|
738
sqft
|
built
2007
2100 Van Buren St, Hollywood, FL 33020
$-1,111
Cash flow
-19.6%
Cash-on-Cash Return
1.6%
Cap rate
0.6%
Rent to Value Ratio
Active
$255,000
1
bds
|
1
ba
|
808
sqft
|
built
2005
5860 W Sample Rd, Coral Springs, FL 33067
$-739
Cash flow
-15.1%
Cash-on-Cash Return
2.7%
Cap rate
0.7%
Rent to Value Ratio
Active
$1,945,000
3
bds
|
3
ba
|
2,010
sqft
|
built
2014
12 Seacrest Pkwy, Hollywood, FL 33019
$-4,859
Cash flow
-13.0%
Cash-on-Cash Return
3.1%
Cap rate
0.5%
Rent to Value Ratio
Active
$350,000
2
bds
|
2
ba
|
1,120
sqft
|
built
2005
5940 W Sample Rd, Coral Springs, FL 33067
$-1,169
Cash flow
-17.4%
Cash-on-Cash Return
2.1%
Cap rate
0.6%
Rent to Value Ratio
Active
$10,777,000
4
bds
|
6
ba
|
5,170
sqft
|
built
1970
2 Compass Rd, Fort Lauderdale, FL 33308
$-53,988
Cash flow
-26.1%
Cash-on-Cash Return
0.1%
Cap rate
0.1%
Rent to Value Ratio
Active
$1,100,000
5
bds
|
3
ba
|
2,896
sqft
|
built
1966
801 S Highland Dr, Hollywood, FL 33021
$-1,935
Cash flow
-9.2%
Cash-on-Cash Return
4.0%
Cap rate
0.6%
Rent to Value Ratio

Active
$2,795,000
5
bds
|
5
ba
|
4,020
sqft
|
built
1973
1512 SE 12th St, Deerfield Beach, FL 33441
$-8,448
Cash flow
-15.8%
Cash-on-Cash Return
2.5%
Cap rate
0.4%
Rent to Value Ratio

Active
$379,000
1
bds
|
2
ba
|
960
sqft
|
built
1970
1904 S Ocean Dr, Hallandale Beach, FL 33009
$-1,393
Cash flow
-19.2%
Cash-on-Cash Return
1.7%
Cap rate
0.7%
Rent to Value Ratio
Active
$729,000
3
bds
|
3
ba
|
2,236
sqft
|
built
1987
8522 NW 80th St, Tamarac, FL 33321
$-1,718
Cash flow
-12.3%
Cash-on-Cash Return
3.3%
Cap rate
0.6%
Rent to Value Ratio
Active
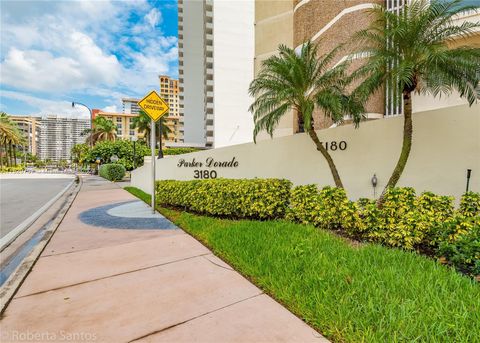
$279,000
1
bds
|
1
ba
|
741
sqft
|
built
1972
3180 S Ocean Dr, Hallandale Beach, FL 33009
$-1,293
Cash flow
-24.2%
Cash-on-Cash Return
0.6%
Cap rate
0.8%
Rent to Value Ratio
Active
$260,000
3
bds
|
2
ba
|
1,500
sqft
|
built
1969
3100 N Palm Aire Dr, Pompano Beach, FL 33069
$-795
Cash flow
-16.0%
Cash-on-Cash Return
2.5%
Cap rate
1.0%
Rent to Value Ratio

Active
$195,000
1
bds
|
2
ba
|
960
sqft
|
built
1969
3100 N Palm Aire Dr, Pompano Beach, FL 33069
$-621
Cash flow
-16.6%
Cash-on-Cash Return
2.3%
Cap rate
0.9%
Rent to Value Ratio
Active
$699,000
1
bds
|
1
ba
|
844
sqft
|
built
2006
1830 S Ocean Dr, Hallandale Beach, FL 33009
$-1,767
Cash flow
-13.2%
Cash-on-Cash Return
3.1%
Cap rate
0.6%
Rent to Value Ratio
Active
$689,999
2
bds
|
2
ba
|
1,140
sqft
|
built
1970
750 N Ocean Blvd, Pompano Beach, FL 33062
$-3,522
Cash flow
-26.6%
Cash-on-Cash Return
0.0%
Cap rate
0.5%
Rent to Value Ratio

Active
$3,160,000
3
bds
|
4
ba
|
2,536
sqft
|
built
2007
1 N Fort Lauderdale Beach Blvd, Fort Lauderdale, FL 33304
$-16,070
Cash flow
-26.5%
Cash-on-Cash Return
0.0%
Cap rate
0.3%
Rent to Value Ratio
Active
$1,149,000
5
bds
|
3
ba
|
2,189
sqft
|
built
1955
1342 Tyler St, Hollywood, FL 33019
$-2,786
Cash flow
-12.7%
Cash-on-Cash Return
3.2%
Cap rate
0.5%
Rent to Value Ratio
Active
$1,375,000
5
bds
|
3
ba
|
2,340
sqft
|
built
1949
1017 Tyler St, Hollywood, FL 33019
$-3,037
Cash flow
-11.5%
Cash-on-Cash Return
3.5%
Cap rate
0.6%
Rent to Value Ratio
Active
$5,500,000
7
bds
|
5
ba
|
5,515
sqft
|
built
1974
5901 SW 160th Ave, Southwest Ranches, FL 33331
$-25,050
Cash flow
-23.8%
Cash-on-Cash Return
0.7%
Cap rate
0.1%
Rent to Value Ratio
Active
$219,000
2
bds
|
1
ba
|
763
sqft
|
built
1968
1021 NE 24th Ave, Pompano Beach, FL 33062
$-427
Cash flow
-10.2%
Cash-on-Cash Return
3.8%
Cap rate
0.8%
Rent to Value Ratio
Active
$305,000
1
bds
|
1
ba
|
798
sqft
|
built
1970
1965 S Ocean Dr, Hallandale Beach, FL 33009
$-1,209
Cash flow
-20.7%
Cash-on-Cash Return
1.4%
Cap rate
0.7%
Rent to Value Ratio
Active
$430,000
1
bds
|
2
ba
|
870
sqft
|
built
1965
4010 Galt Ocean Dr, Fort Lauderdale, FL 33308
$-1,868
Cash flow
-22.7%
Cash-on-Cash Return
0.9%
Cap rate
0.7%
Rent to Value Ratio
Active
$1,350,000
3
bds
|
2
ba
|
1,554
sqft
|
built
2006
1830 S Ocean Dr, Hallandale Beach, FL 33009
$-5,309
Cash flow
-20.5%
Cash-on-Cash Return
1.4%
Cap rate
0.5%
Rent to Value Ratio

Active
$1,720,000
4
bds
|
3
ba
|
1,871
sqft
|
built
1958
2560 SE 9th St, Pompano Beach, FL 33062
$-3,752
Cash flow
-11.4%
Cash-on-Cash Return
3.5%
Cap rate
0.6%
Rent to Value Ratio
Active
$215,000
2
bds
|
2
ba
|
1,080
sqft
|
built
1973
1100 SE 4th Ave, Deerfield Beach, FL 33441
$-713
Cash flow
-17.3%
Cash-on-Cash Return
2.2%
Cap rate
1.0%
Rent to Value Ratio
Active
$1,175,000
2
bds
|
2
ba
|
1,458
sqft
|
built
2006
1830 S Ocean Dr, Hallandale Beach, FL 33009
$-3,666
Cash flow
-16.3%
Cash-on-Cash Return
2.4%
Cap rate
0.6%
Rent to Value Ratio

Active
$599,000
1
bds
|
1
ba
|
685
sqft
|
built
1993
341 N Birch Rd, Fort Lauderdale, FL 33304
$-2,510
Cash flow
-21.9%
Cash-on-Cash Return
1.1%
Cap rate
0.5%
Rent to Value Ratio
Active
$245,000
2
bds
|
2
ba
|
1,011
sqft
|
built
1975
7351 W Sunrise Blvd, Plantation, FL 33313
$-492
Cash flow
-10.5%
Cash-on-Cash Return
3.7%
Cap rate
0.9%
Rent to Value Ratio