Miami Dade County Investment Properties for Sale
Browse homes for sale and investment properties in Miami Dade County. Refine your search by price, property type, or more.
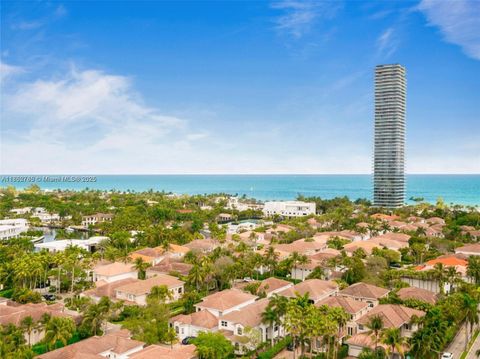
Best cash flowing properties in Miami Dade County
Active
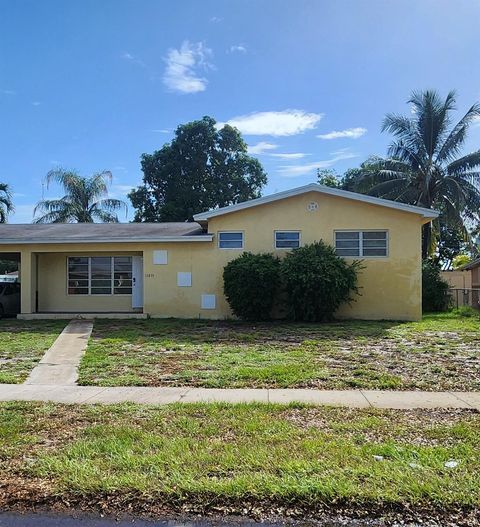
$230,000
2
bds
|
1
ba
|
802
sqft
|
built
1974
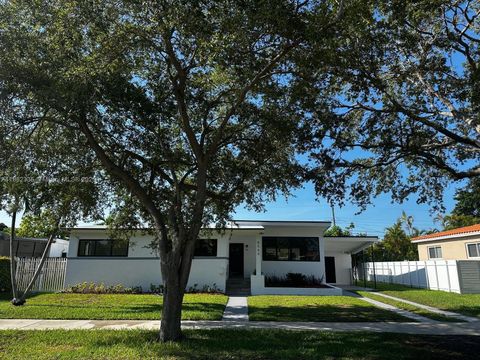
1075 W 68th St, Hialeah, FL 33014
$-165
Cash flow
-3.7%
Cash-on-Cash Return
5.3%
Cap rate
0.9%
Rent to Value Ratio
Active
$170,000
1
bds
|
1
ba
|
750
sqft
|
built
1972
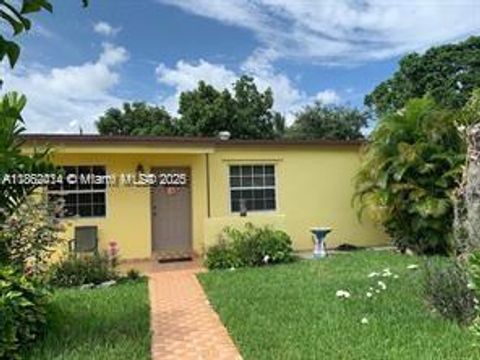
1465 NE 123rd St, North Miami, FL 33161
$-242
Cash flow
-7.4%
Cash-on-Cash Return
4.4%
Cap rate
1.1%
Rent to Value Ratio
10,000 out of 12,525 properties for sale in Miami Dade County
Limited Results Shown
Create a free account, or log in to reveal all property listings and enjoy the complete experience.
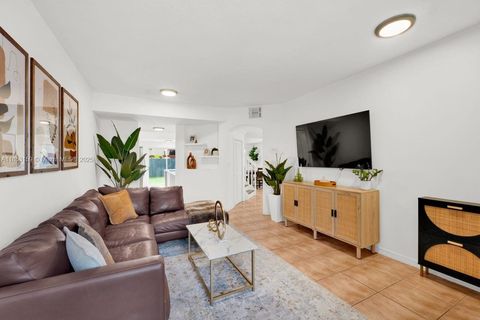
Active
$850,000
2
bds
|
3
ba
|
2,045
sqft
|
built
1971
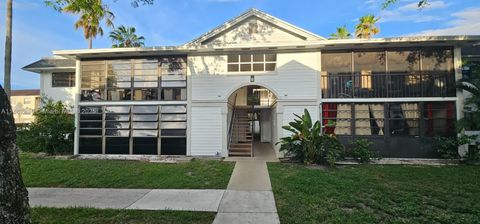
10180 W Bay Harbor Dr, Bay Harbor Islands, FL 33154
$-2,458
Cash flow
-15.1%
Cash-on-Cash Return
2.7%
Cap rate
0.8%
Rent to Value Ratio
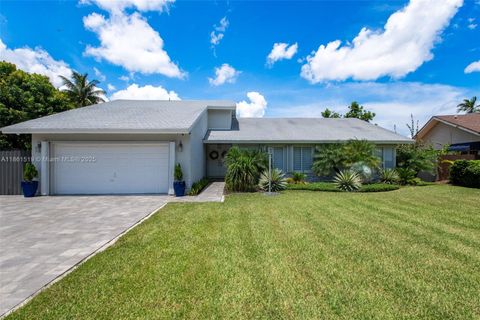
Active
$405,000
2
bds
|
2
ba
|
1,000
sqft
|
built
1972
110 Salamanca Ave, Coral Gables, FL 33134
$-1,300
Cash flow
-16.7%
Cash-on-Cash Return
2.3%
Cap rate
0.7%
Rent to Value Ratio
Active
$4,695,000
6
bds
|
7
ba
|
0
sqft
|
built
2017
1000 NE Little River Dr, Miami, FL 33138
$-23,547
Cash flow
-26.2%
Cash-on-Cash Return
0.1%
Cap rate
0.2%
Rent to Value Ratio
Active
$459,000
3
bds
|
2
ba
|
1,236
sqft
|
built
2020
7905 NW 104th Ave, Doral, FL 33178
$-1,615
Cash flow
-18.4%
Cash-on-Cash Return
1.9%
Cap rate
0.6%
Rent to Value Ratio

Active
$775,000
3
bds
|
2
ba
|
1,905
sqft
|
built
1989
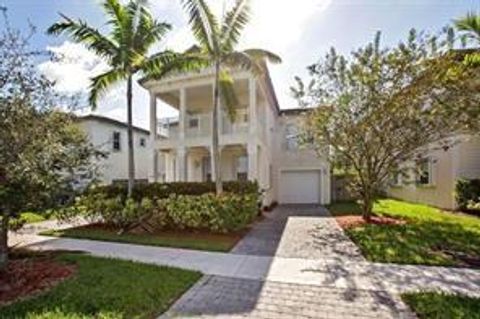
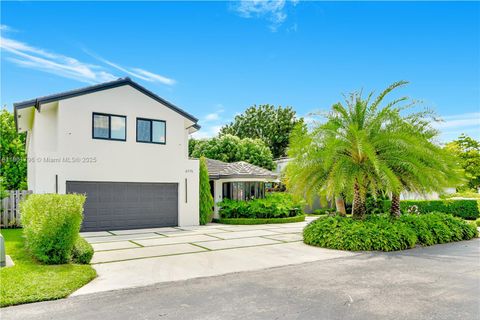
2671 SW 99th Ct, Miami, FL 33165
$-1,653
Cash flow
-11.1%
Cash-on-Cash Return
3.6%
Cap rate
0.5%
Rent to Value Ratio
Active
$220,000
1
bds
|
2
ba
|
873
sqft
|
built
1971
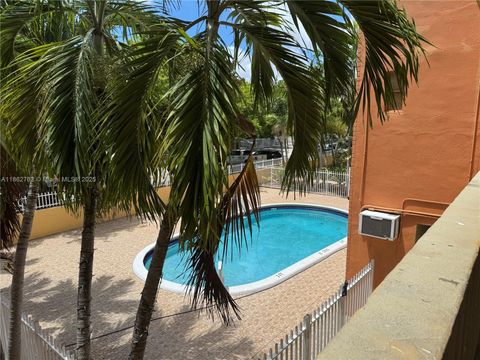
2750 NE 183rd St, Aventura, FL 33160
$-785
Cash flow
-18.6%
Cash-on-Cash Return
1.9%
Cap rate
1.0%
Rent to Value Ratio
Active
$5,500,000
4
bds
|
4
ba
|
5,628
sqft
|
built
2005
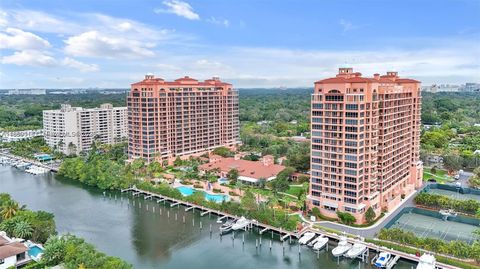
1504 Island Blvd, Aventura, FL 33160
$-26,503
Cash flow
-25.1%
Cash-on-Cash Return
0.4%
Cap rate
0.1%
Rent to Value Ratio
Active
$449,900
4
bds
|
3
ba
|
2,818
sqft
|
built
2006
3134 NE 2nd Dr, Homestead, FL 33033
$-855
Cash flow
-9.9%
Cash-on-Cash Return
3.9%
Cap rate
0.8%
Rent to Value Ratio
Active
$2,580,000
2
bds
|
3
ba
|
2,570
sqft
|
built
1996
10 Edgewater Dr, Coral Gables, FL 33133
$-14,674
Cash flow
-29.7%
Cash-on-Cash Return
-0.7%
Cap rate
0.3%
Rent to Value Ratio
Active
$480,000
2
bds
|
2
ba
|
1,520
sqft
|
built
1981
1000 Quayside Ter, Miami Shores, FL 33138
$-1,973
Cash flow
-21.4%
Cash-on-Cash Return
1.2%
Cap rate
0.8%
Rent to Value Ratio
Active
$190,000
1
bds
|
1
ba
|
700
sqft
|
built
1965
1851 NE 168th St, North Miami Beach, FL 33162
$-384
Cash flow
-10.5%
Cash-on-Cash Return
3.7%
Cap rate
0.8%
Rent to Value Ratio
Active
$550,000
2
bds
|
2
ba
|
1,024
sqft
|
built
2003
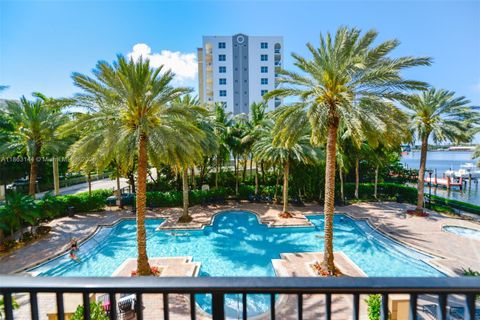
17100 N Bay Rd, Sunny Isles Beach, FL 33160
$-1,179
Cash flow
-11.2%
Cash-on-Cash Return
3.6%
Cap rate
0.6%
Rent to Value Ratio
Active
$415,000
1
bds
|
2
ba
|
1,000
sqft
|
built
1971
19390 Collins Ave, Sunny Isles Beach, FL 33160
$-961
Cash flow
-12.1%
Cash-on-Cash Return
3.4%
Cap rate
0.8%
Rent to Value Ratio
Active
$710,000
1
bds
|
2
ba
|
1,031
sqft
|
built
2005
901 Brickell Key Blvd, Miami, FL 33131
$-2,241
Cash flow
-16.5%
Cash-on-Cash Return
2.4%
Cap rate
0.6%
Rent to Value Ratio
Active
$400,000
3
bds
|
2
ba
|
1,918
sqft
|
built
1954
18835 NW 11th Ct, Miami, FL 33169
$-507
Cash flow
-6.6%
Cash-on-Cash Return
4.6%
Cap rate
0.8%
Rent to Value Ratio
Active
$579,000
3
bds
|
3
ba
|
1,790
sqft
|
built
1998
10150 SW 88th St, Miami, FL 33176
$-1,574
Cash flow
-14.2%
Cash-on-Cash Return
2.9%
Cap rate
0.6%
Rent to Value Ratio
Active
$774,900
3
bds
|
2
ba
|
1,675
sqft
|
built
1980
12935 SW 116th St, Miami, FL 33186
$-1,740
Cash flow
-11.7%
Cash-on-Cash Return
3.5%
Cap rate
0.5%
Rent to Value Ratio
Active
$925,000
4
bds
|
2
ba
|
2,554
sqft
|
built
1977
10450 SW 19th St, Miami, FL 33165
$-2,101
Cash flow
-11.9%
Cash-on-Cash Return
3.4%
Cap rate
0.5%
Rent to Value Ratio
Active
$525,000
3
bds
|
3
ba
|
1,617
sqft
|
built
2012
15224 SW 119th St, Miami, FL 33196
$-1,280
Cash flow
-12.7%
Cash-on-Cash Return
3.2%
Cap rate
0.6%
Rent to Value Ratio
Active
$12,900,000
6
bds
|
7
ba
|
5,960
sqft
|
built
2005
365 Gulf Rd, Key Biscayne, FL 33149
$-65,096
Cash flow
-26.3%
Cash-on-Cash Return
0.1%
Cap rate
0.1%
Rent to Value Ratio
Active
$269,000
2
bds
|
2
ba
|
897
sqft
|
built
1988
1221 SW 122nd Ave, Miami, FL 33184
$-549
Cash flow
-10.6%
Cash-on-Cash Return
3.7%
Cap rate
0.8%
Rent to Value Ratio
Active
$849,000
3
bds
|
2
ba
|
1,612
sqft
|
built
1957
8560 SW 27th Ln, Miami, FL 33155
$-2,073
Cash flow
-12.7%
Cash-on-Cash Return
3.2%
Cap rate
0.4%
Rent to Value Ratio
Active
$1,048,888
5
bds
|
4
ba
|
2,487
sqft
|
built
1988
6775 SW 103rd Ct, Miami, FL 33173
$-1,890
Cash flow
-9.4%
Cash-on-Cash Return
4.0%
Cap rate
0.6%
Rent to Value Ratio
Active
$480,000
3
bds
|
1
ba
|
1,700
sqft
|
built
1953
3515 NW 98th St, Miami, FL 33147
$-728
Cash flow
-7.9%
Cash-on-Cash Return
4.3%
Cap rate
0.6%
Rent to Value Ratio
Active
$255,000
2
bds
|
2
ba
|
870
sqft
|
built
1985
18965 NW 62nd Ave, Hialeah, FL 33015
$-494
Cash flow
-10.1%
Cash-on-Cash Return
3.8%
Cap rate
0.9%
Rent to Value Ratio
Active
$1,299,999
5
bds
|
3
ba
|
2,821
sqft
|
built
2016
27410 SW 172nd Ave, Homestead, FL 33031
$-3,881
Cash flow
-15.6%
Cash-on-Cash Return
2.6%
Cap rate
0.4%
Rent to Value Ratio
Active
$800,000
3
bds
|
3
ba
|
2,460
sqft
|
built
2017
3392 W 103rd Ter, Hialeah, FL 33018
$-2,237
Cash flow
-14.6%
Cash-on-Cash Return
2.8%
Cap rate
0.5%
Rent to Value Ratio
Active
$155,000
1
bds
|
1
ba
|
696
sqft
|
built
1972
1225 NE 124th St, North Miami, FL 33161
$-343
Cash flow
-11.5%
Cash-on-Cash Return
3.5%
Cap rate
1.2%
Rent to Value Ratio
Active
$720,000
1
bds
|
1
ba
|
1,035
sqft
|
built
2009
495 Brickell Ave, Miami, FL 33131
$-2,713
Cash flow
-19.7%
Cash-on-Cash Return
1.6%
Cap rate
0.6%
Rent to Value Ratio
Active
$1,150,000
3
bds
|
3
ba
|
2,068
sqft
|
built
2022
8211 NW 43rd Ter, Doral, FL 33166
$-2,123
Cash flow
-9.6%
Cash-on-Cash Return
3.9%
Cap rate
0.7%
Rent to Value Ratio
Active
$410,000
3
bds
|
1
ba
|
1,125
sqft
|
built
1995
12235 SW 202nd St, Miami, FL 33177
$-457
Cash flow
-5.8%
Cash-on-Cash Return
4.8%
Cap rate
0.7%
Rent to Value Ratio
Active
$450,000
2
bds
|
2
ba
|
860
sqft
|
built
1925
1350 Pennsylvania Ave, Miami Beach, FL 33139
$-1,397
Cash flow
-16.2%
Cash-on-Cash Return
2.4%
Cap rate
0.6%
Rent to Value Ratio
Active
$585,000
3
bds
|
3
ba
|
1,959
sqft
|
built
2018
10396 W 34th Ln, Hialeah, FL 33018
$-1,752
Cash flow
-15.6%
Cash-on-Cash Return
2.6%
Cap rate
0.5%
Rent to Value Ratio
Active
$2,450,000
3
bds
|
4
ba
|
2,240
sqft
|
built
1996
2645 S Bayshore Dr, Miami, FL 33133
$-11,063
Cash flow
-23.6%
Cash-on-Cash Return
0.7%
Cap rate
0.4%
Rent to Value Ratio
Active
$1,950,000
3
bds
|
2
ba
|
1,892
sqft
|
built
1969
1551 Ancona Ave, Coral Gables, FL 33146
$-6,960
Cash flow
-18.6%
Cash-on-Cash Return
1.9%
Cap rate
0.3%
Rent to Value Ratio
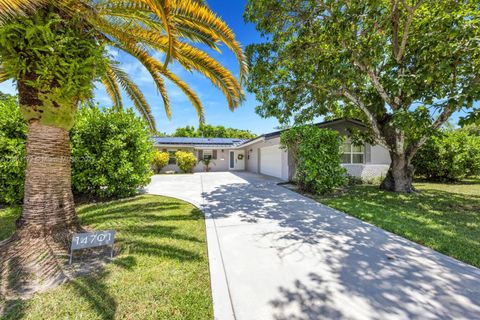
Active
$1,200,000
3
bds
|
3
ba
|
1,817
sqft
|
built
1960
14701 SW 84th Ct, Palmetto Bay, FL 33158
$-2,962
Cash flow
-12.9%
Cash-on-Cash Return
3.2%
Cap rate
0.5%
Rent to Value Ratio
Active
$271,900
2
bds
|
2
ba
|
0
sqft
|
built
1973
665 NE 195th St, Miami, FL 33179
$-609
Cash flow
-11.7%
Cash-on-Cash Return
3.5%
Cap rate
0.8%
Rent to Value Ratio
Active
$625,000
3
bds
|
2
ba
|
1,528
sqft
|
built
1987
2840 SW 132nd Ct, Miami, FL 33175
$-925
Cash flow
-7.7%
Cash-on-Cash Return
4.4%
Cap rate
0.6%
Rent to Value Ratio