Palm Beach County Investment Properties for Sale
Browse homes for sale and investment properties in Palm Beach County. Refine your search by price, property type, or more.
Best cash flowing properties in Palm Beach County

Active
$205,000
3
bds
|
2
ba
|
1,250
sqft
|
built
1987
705 Harbour Pointe Way, Greenacres, FL 33413
$-170
Cash flow
-4.3%
Cash-on-Cash Return
5.2%
Cap rate
1.4%
Rent to Value Ratio
Active
$176,000
2
bds
|
1
ba
|
980
sqft
|
built
1973
810 W Tiffany Dr, Mangonia Park, FL 33407
$-203
Cash flow
-6.0%
Cash-on-Cash Return
4.8%
Cap rate
1.0%
Rent to Value Ratio
6,021 out of 7,308 properties for sale in Palm Beach County
Limited Results Shown
Create a free account, or log in to reveal all property listings and enjoy the complete experience.
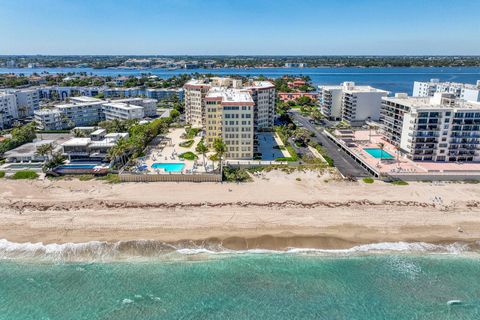
Active
$548,980
2
bds
|
2
ba
|
1,395
sqft
|
built
1967
3475 S Ocean Blvd, Palm Beach, FL 33480
$-2,206
Cash flow
-21.0%
Cash-on-Cash Return
1.3%
Cap rate
0.7%
Rent to Value Ratio

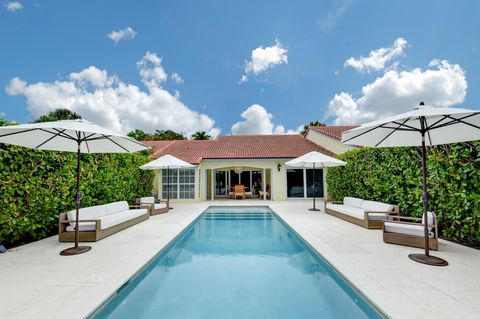
Active
$2,175,000
3
bds
|
3
ba
|
2,170
sqft
|
built
1981
2131 Wightman Dr, Wellington, FL 33414
$-11,007
Cash flow
-26.4%
Cash-on-Cash Return
0.1%
Cap rate
0.2%
Rent to Value Ratio
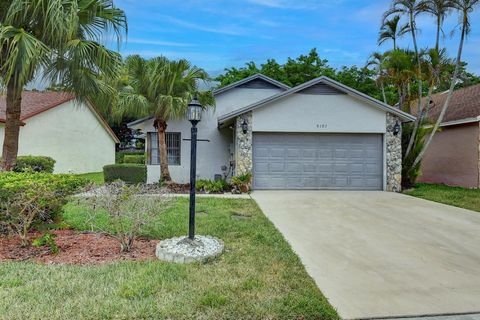
Active
$1,100,000
3
bds
|
2
ba
|
1,561
sqft
|
built
1987
2521 Vista Del Prado Dr, Wellington, FL 33414
$-5,067
Cash flow
-24.0%
Cash-on-Cash Return
0.6%
Cap rate
0.4%
Rent to Value Ratio
Active
$539,000
3
bds
|
2
ba
|
1,692
sqft
|
built
1986
9107 Chatsworth Cascades, Boca Raton, FL 33434
$-1,282
Cash flow
-12.4%
Cash-on-Cash Return
3.3%
Cap rate
0.7%
Rent to Value Ratio
Active
$649,000
4
bds
|
3
ba
|
1,625
sqft
|
built
1978
2550 Ray Ct, Lake Worth, FL 33462
$-706
Cash flow
-5.7%
Cash-on-Cash Return
4.8%
Cap rate
0.7%
Rent to Value Ratio
Active
$499,900
2
bds
|
2
ba
|
1,950
sqft
|
built
1975
108 Lakeshore Dr, North Palm Beach, FL 33408
$-2,539
Cash flow
-26.5%
Cash-on-Cash Return
0.1%
Cap rate
0.8%
Rent to Value Ratio

Active
$242,900
1
bds
|
1
ba
|
696
sqft
|
built
2003
616 Clearwater Park Rd, West Palm Beach, FL 33401
$-806
Cash flow
-17.3%
Cash-on-Cash Return
2.2%
Cap rate
0.8%
Rent to Value Ratio
Active
$939,000
3
bds
|
4
ba
|
2,503
sqft
|
built
2022
10536 Starling Way, West Palm Beach, FL 33412
$-3,459
Cash flow
-19.2%
Cash-on-Cash Return
1.7%
Cap rate
0.5%
Rent to Value Ratio
Active
$610,000
2
bds
|
2
ba
|
1,385
sqft
|
built
1986
2101 Marina Isle Way, Jupiter, FL 33477
$-2,690
Cash flow
-23.0%
Cash-on-Cash Return
0.9%
Cap rate
0.5%
Rent to Value Ratio
Active
$825,000
3
bds
|
4
ba
|
2,531
sqft
|
built
1988
108 Toteka Cir, Jupiter, FL 33458
$-1,808
Cash flow
-11.4%
Cash-on-Cash Return
3.5%
Cap rate
0.7%
Rent to Value Ratio
Active
$1,295,000
2
bds
|
2
ba
|
1,190
sqft
|
built
2020
155 E Boca Raton Rd, Boca Raton, FL 33432
$-5,785
Cash flow
-23.3%
Cash-on-Cash Return
0.8%
Cap rate
0.4%
Rent to Value Ratio
Active
$320,000
2
bds
|
2
ba
|
1,400
sqft
|
built
1980
300 Golfview Rd, North Palm Beach, FL 33408
$-1,235
Cash flow
-20.1%
Cash-on-Cash Return
1.5%
Cap rate
0.9%
Rent to Value Ratio
Active
$999,998
4
bds
|
2
ba
|
2,500
sqft
|
built
1998
8671 155th Pl N, West Palm Beach, FL 33418
$-1,841
Cash flow
-9.6%
Cash-on-Cash Return
3.9%
Cap rate
0.5%
Rent to Value Ratio

Active
$1,100,000
2
bds
|
2
ba
|
1,028
sqft
|
built
1957
100 N Ocean Blvd, Delray Beach, FL 33483
$-4,898
Cash flow
-23.2%
Cash-on-Cash Return
0.8%
Cap rate
0.4%
Rent to Value Ratio

Active
$2,975,999
4
bds
|
3
ba
|
3,485
sqft
|
built
1958
946 Eve St, Delray Beach, FL 33483
$-9,252
Cash flow
-16.2%
Cash-on-Cash Return
2.4%
Cap rate
0.3%
Rent to Value Ratio
Active
$199,000
1
bds
|
1
ba
|
627
sqft
|
built
1985
631 Executive Center Dr, West Palm Beach, FL 33401
$-396
Cash flow
-10.4%
Cash-on-Cash Return
3.8%
Cap rate
0.8%
Rent to Value Ratio

Active
$1,473,000
3
bds
|
2
ba
|
1,599
sqft
|
built
1975
625 Sunshine Dr, Delray Beach, FL 33444
$-5,824
Cash flow
-20.6%
Cash-on-Cash Return
1.4%
Cap rate
0.3%
Rent to Value Ratio
Active
$329,000
3
bds
|
3
ba
|
1,482
sqft
|
built
2005
3216 Laurel Ridge Cir, Riviera Beach, FL 33404
$-590
Cash flow
-9.4%
Cash-on-Cash Return
4.0%
Cap rate
0.9%
Rent to Value Ratio
Active
$500,000
3
bds
|
2
ba
|
1,400
sqft
|
built
1980
513 El Vedado, West Palm Beach, FL 33405
$-703
Cash flow
-7.3%
Cash-on-Cash Return
4.5%
Cap rate
0.6%
Rent to Value Ratio

Active
$995,000
3
bds
|
3
ba
|
1,863
sqft
|
built
2019
2928 Gin Berry Way, West Palm Beach, FL 33401
$-2,380
Cash flow
-12.5%
Cash-on-Cash Return
3.3%
Cap rate
0.6%
Rent to Value Ratio
Active
$750,000
2
bds
|
2
ba
|
1,457
sqft
|
built
1973
2773 S Ocean Blvd, Palm Beach, FL 33480
$-3,351
Cash flow
-23.3%
Cash-on-Cash Return
0.8%
Cap rate
0.6%
Rent to Value Ratio
Active
$1,200,000
3
bds
|
3
ba
|
1,611
sqft
|
built
1990
2608 Fairway Dr N, Jupiter, FL 33477
$-2,234
Cash flow
-9.7%
Cash-on-Cash Return
3.9%
Cap rate
0.6%
Rent to Value Ratio

Active
$19,995,000
4
bds
|
6
ba
|
6,794
sqft
|
built
1992
871 NE 35th St, Boca Raton, FL 33431
$-107,736
Cash flow
-28.1%
Cash-on-Cash Return
-0.3%
Cap rate
0.0%
Rent to Value Ratio
Active
$699,999
3
bds
|
3
ba
|
1,990
sqft
|
built
1984
1421 Ocean Dunes Cir, Jupiter, FL 33477
$-1,952
Cash flow
-14.5%
Cash-on-Cash Return
2.8%
Cap rate
0.6%
Rent to Value Ratio
Active
$1,520,000
2
bds
|
3
ba
|
1,672
sqft
|
built
2020
155 E Boca Raton Rd, Boca Raton, FL 33432
$-5,885
Cash flow
-20.2%
Cash-on-Cash Return
1.5%
Cap rate
0.6%
Rent to Value Ratio
Active
$1,950,000
3
bds
|
2
ba
|
1,961
sqft
|
built
1979
709 Irwin Ln, Jupiter, FL 33458
$-4,424
Cash flow
-11.8%
Cash-on-Cash Return
3.4%
Cap rate
0.5%
Rent to Value Ratio
Active
$325,000
2
bds
|
2
ba
|
1,140
sqft
|
built
1969
11800 Avenue Of P G A, Palm Beach Gardens, FL 33418
$-945
Cash flow
-15.2%
Cash-on-Cash Return
2.7%
Cap rate
0.8%
Rent to Value Ratio
Active
$305,000
2
bds
|
2
ba
|
1,047
sqft
|
built
1982
7030 Half Moon Cir, Hypoluxo, FL 33462
$-1,394
Cash flow
-23.8%
Cash-on-Cash Return
0.7%
Cap rate
0.8%
Rent to Value Ratio

Active
$700,000
4
bds
|
3
ba
|
1,837
sqft
|
built
1955
1317 N M St, Lake Worth, FL 33460
$-1,974
Cash flow
-14.7%
Cash-on-Cash Return
2.8%
Cap rate
0.5%
Rent to Value Ratio
Active
$399,000
3
bds
|
2
ba
|
1,846
sqft
|
built
1991
5454 Firenze Dr, Boynton Beach, FL 33437
$-1,082
Cash flow
-14.1%
Cash-on-Cash Return
2.9%
Cap rate
0.8%
Rent to Value Ratio
Active
$2,600,000
4
bds
|
5
ba
|
3,546
sqft
|
built
2004
6097 Wildcat Run, West Palm Beach, FL 33412
$-12,004
Cash flow
-24.1%
Cash-on-Cash Return
0.6%
Cap rate
0.2%
Rent to Value Ratio
Active
$450,000
3
bds
|
2
ba
|
1,500
sqft
|
built
1961
827 Caroline Ave, West Palm Beach, FL 33413
$-513
Cash flow
-5.9%
Cash-on-Cash Return
4.8%
Cap rate
0.6%
Rent to Value Ratio

Active
$670,000
3
bds
|
2
ba
|
1,674
sqft
|
built
1972
514 Jaeger Dr, Delray Beach, FL 33444
$-1,193
Cash flow
-9.3%
Cash-on-Cash Return
4.0%
Cap rate
0.5%
Rent to Value Ratio
Active
$589,000
4
bds
|
2
ba
|
2,198
sqft
|
built
1989
3540 Cypress Wood Ct, Lake Worth, FL 33467
$-664
Cash flow
-5.9%
Cash-on-Cash Return
4.8%
Cap rate
0.7%
Rent to Value Ratio
Active
$639,000
3
bds
|
2
ba
|
1,376
sqft
|
built
1998
6254 Lucerne St, Jupiter, FL 33458
$-1,170
Cash flow
-9.6%
Cash-on-Cash Return
3.9%
Cap rate
0.6%
Rent to Value Ratio
Active
$433,000
3
bds
|
3
ba
|
1,870
sqft
|
built
1985
7186 Promenade Dr, Boca Raton, FL 33433
$-1,293
Cash flow
-15.6%
Cash-on-Cash Return
2.6%
Cap rate
0.8%
Rent to Value Ratio
Active
$965,000
4
bds
|
3
ba
|
2,440
sqft
|
built
2003
132 Via Castilla, Jupiter, FL 33458
$-1,869
Cash flow
-10.1%
Cash-on-Cash Return
3.8%
Cap rate
0.6%
Rent to Value Ratio
Active
$339,900
2
bds
|
2
ba
|
1,025
sqft
|
built
1988
24 Lexington Ln W, Palm Beach Gardens, FL 33418
$-935
Cash flow
-14.4%
Cash-on-Cash Return
2.8%
Cap rate
0.7%
Rent to Value Ratio