Palm Beach County Investment Properties for Sale
Browse homes for sale and investment properties in Palm Beach County. Refine your search by price, property type, or more.
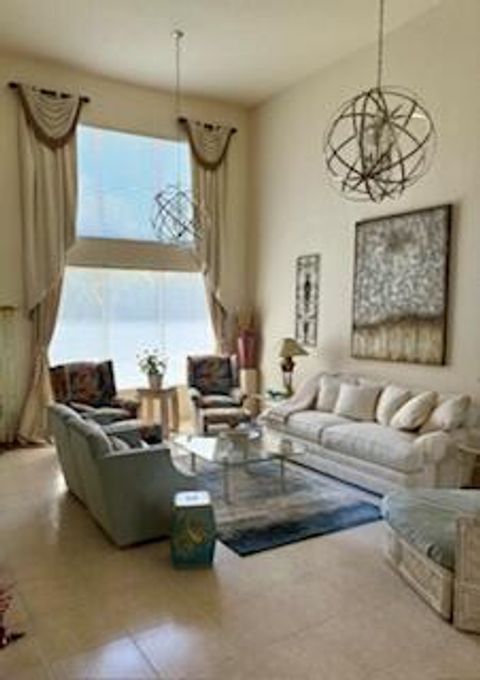
Best cash flowing properties in Palm Beach County
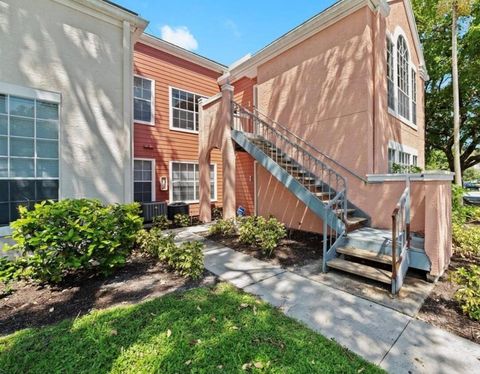
Active
$275,000
2
bds
|
2
ba
|
958
sqft
|
built
1985
22053 Palms Way, Boca Raton, FL 33433
$-338
Cash flow
-6.4%
Cash-on-Cash Return
4.7%
Cap rate
0.9%
Rent to Value Ratio
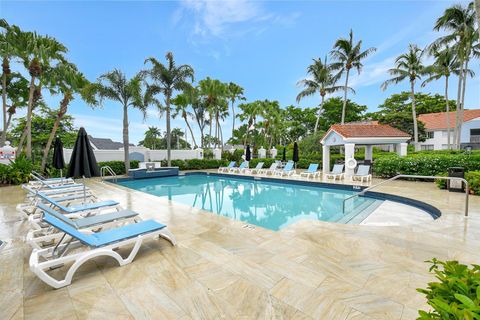
Active
$125,000
1
bds
|
2
ba
|
1,104
sqft
|
built
1989
19309 Sabal Lake Dr, Boca Raton, FL 33434
$-400
Cash flow
-16.7%
Cash-on-Cash Return
2.3%
Cap rate
1.8%
Rent to Value Ratio
5,025 out of 6,088 properties for sale in Palm Beach County
Limited Results Shown
Create a free account, or log in to reveal all property listings and enjoy the complete experience.
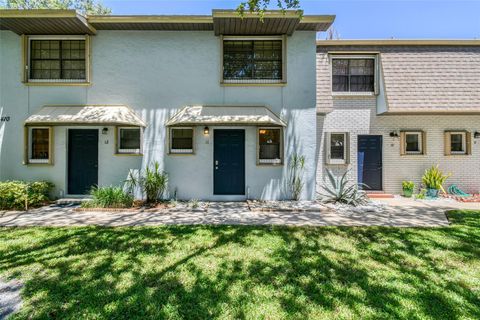
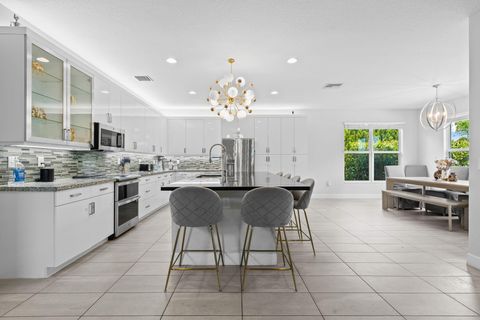
Active
$1,070,000
3
bds
|
3
ba
|
2,658
sqft
|
built
2023
5320 Blue Reed Ln, Lake Worth, FL 33467
$-3,359
Cash flow
-16.4%
Cash-on-Cash Return
2.4%
Cap rate
0.5%
Rent to Value Ratio
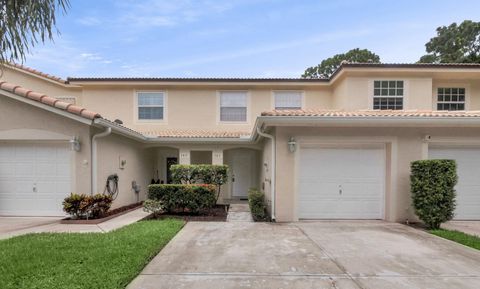
Active
$1,815,000
3
bds
|
3
ba
|
2,184
sqft
|
built
2007
125 NE 10th St, Delray Beach, FL 33444
$-3,605
Cash flow
-10.4%
Cash-on-Cash Return
3.8%
Cap rate
0.5%
Rent to Value Ratio
Active
$275,000
2
bds
|
3
ba
|
1,252
sqft
|
built
1981
2095 White Pine Cir, Greenacres, FL 33415
$-659
Cash flow
-12.5%
Cash-on-Cash Return
3.3%
Cap rate
0.8%
Rent to Value Ratio
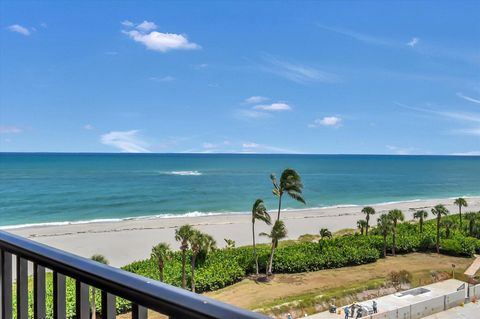
Active
$665,000
2
bds
|
2
ba
|
1,280
sqft
|
built
1980
102 Clubhouse Cir, Jupiter, FL 33477
$-2,372
Cash flow
-18.6%
Cash-on-Cash Return
1.9%
Cap rate
0.5%
Rent to Value Ratio
Active
$465,000
3
bds
|
2
ba
|
1,865
sqft
|
built
1987
7632 Forest Green Ln, Boynton Beach, FL 33436
$-1,085
Cash flow
-12.2%
Cash-on-Cash Return
3.3%
Cap rate
0.6%
Rent to Value Ratio
Active
$350,000
2
bds
|
2
ba
|
1,178
sqft
|
built
1989
1101 Keystone Dr, Jupiter, FL 33458
$-980
Cash flow
-14.6%
Cash-on-Cash Return
2.8%
Cap rate
0.7%
Rent to Value Ratio
Active
$1,300,000
3
bds
|
3
ba
|
2,434
sqft
|
built
1991
20678 NW 26th Ave, Boca Raton, FL 33434
$-3,051
Cash flow
-12.2%
Cash-on-Cash Return
3.3%
Cap rate
0.6%
Rent to Value Ratio
Active
$429,900
3
bds
|
2
ba
|
1,429
sqft
|
built
2002
2157 Big Wood Cay, West Palm Beach, FL 33411
$-966
Cash flow
-11.7%
Cash-on-Cash Return
3.5%
Cap rate
0.7%
Rent to Value Ratio

Active
$379,999
5
bds
|
2
ba
|
1,862
sqft
|
built
1972
200 NW 10th St, Belle Glade, FL 33430
$-660
Cash flow
-9.1%
Cash-on-Cash Return
4.1%
Cap rate
0.5%
Rent to Value Ratio
Active
$694,900
2
bds
|
2
ba
|
1,170
sqft
|
built
1983
400 Ocean Trail Way, Jupiter, FL 33477
$-2,289
Cash flow
-17.2%
Cash-on-Cash Return
2.2%
Cap rate
0.8%
Rent to Value Ratio
Active
$375,000
2
bds
|
2
ba
|
1,541
sqft
|
built
1974
3589 S Ocean Blvd, Palm Beach, FL 33480
$-1,944
Cash flow
-27.0%
Cash-on-Cash Return
-0.1%
Cap rate
0.9%
Rent to Value Ratio
Active
$2,300,000
4
bds
|
4
ba
|
3,913
sqft
|
built
2001
7094 Via Mediterrania, Boca Raton, FL 33433
$-10,121
Cash flow
-23.0%
Cash-on-Cash Return
0.9%
Cap rate
0.3%
Rent to Value Ratio

Active
$495,000
4
bds
|
2
ba
|
1,200
sqft
|
built
1961
3852 Catalina Rd, West Palm Beach, FL 33410
$-859
Cash flow
-9.1%
Cash-on-Cash Return
4.1%
Cap rate
0.5%
Rent to Value Ratio
Active
$425,000
3
bds
|
3
ba
|
1,438
sqft
|
built
1991
3143 Clint Moore Rd, Boca Raton, FL 33496
$-1,415
Cash flow
-17.4%
Cash-on-Cash Return
2.2%
Cap rate
0.8%
Rent to Value Ratio
Active
$300,000
2
bds
|
2
ba
|
1,056
sqft
|
built
1981
410 N Cypress Dr, Tequesta, FL 33469
$-656
Cash flow
-11.4%
Cash-on-Cash Return
3.5%
Cap rate
0.7%
Rent to Value Ratio
Active
$370,000
3
bds
|
3
ba
|
1,437
sqft
|
built
2000
143 Wooden Mill Ter, Jupiter, FL 33458
$-868
Cash flow
-12.2%
Cash-on-Cash Return
3.3%
Cap rate
0.8%
Rent to Value Ratio
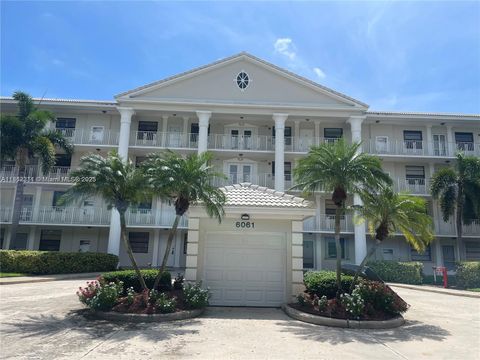
Active
$250,000
2
bds
|
2
ba
|
1,385
sqft
|
built
1985
6061 Balboa Cir, Boca Raton, FL 33433
$-541
Cash flow
-11.3%
Cash-on-Cash Return
3.6%
Cap rate
1.0%
Rent to Value Ratio
Active
$1,888,000
4
bds
|
4
ba
|
3,214
sqft
|
built
2023
9216 Coral Isles Cir, Palm Beach Gardens, FL 33412
$-4,903
Cash flow
-13.5%
Cash-on-Cash Return
3.0%
Cap rate
0.6%
Rent to Value Ratio
Active
$399,000
3
bds
|
2
ba
|
1,215
sqft
|
built
1978
5600 N Flagler Dr, West Palm Beach, FL 33407
$-1,742
Cash flow
-22.8%
Cash-on-Cash Return
0.9%
Cap rate
0.8%
Rent to Value Ratio
Active
$305,000
2
bds
|
2
ba
|
950
sqft
|
built
1984
21938 Remsen Ter, Boca Raton, FL 33433
$-754
Cash flow
-12.9%
Cash-on-Cash Return
3.2%
Cap rate
0.7%
Rent to Value Ratio
Active
$1,200,000
2
bds
|
3
ba
|
2,054
sqft
|
built
1984
16956 Freshwind Cir, Jupiter, FL 33477
$-4,217
Cash flow
-18.3%
Cash-on-Cash Return
1.9%
Cap rate
0.4%
Rent to Value Ratio
Active
$1,195,000
4
bds
|
3
ba
|
2,772
sqft
|
built
2006
16211 Rosecroft Ter, Delray Beach, FL 33446
$-3,219
Cash flow
-14.1%
Cash-on-Cash Return
2.9%
Cap rate
0.5%
Rent to Value Ratio
Active
$850,000
4
bds
|
3
ba
|
2,986
sqft
|
built
1988
16424 121st Ter N, Jupiter, FL 33478
$-1,336
Cash flow
-8.2%
Cash-on-Cash Return
4.3%
Cap rate
0.7%
Rent to Value Ratio
Active
$369,900
3
bds
|
3
ba
|
1,597
sqft
|
built
1981
5650 Camino Del Sol, Boca Raton, FL 33433
$-890
Cash flow
-12.6%
Cash-on-Cash Return
3.3%
Cap rate
0.9%
Rent to Value Ratio
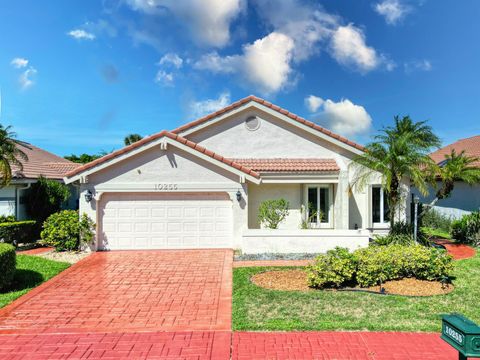
Active
$600,000
3
bds
|
2
ba
|
2,352
sqft
|
built
1985
10255 Sunset Bend Dr, Boca Raton, FL 33428
$-1,067
Cash flow
-9.3%
Cash-on-Cash Return
4.0%
Cap rate
0.7%
Rent to Value Ratio
Active
$315,000
1
bds
|
2
ba
|
776
sqft
|
built
1976
769 Jeffery St, Boca Raton, FL 33487
$-770
Cash flow
-12.8%
Cash-on-Cash Return
3.2%
Cap rate
0.8%
Rent to Value Ratio
Active
$499,000
3
bds
|
2
ba
|
1,292
sqft
|
built
1986
1344 Periwinkle Pl, Wellington, FL 33414
$-900
Cash flow
-9.4%
Cash-on-Cash Return
4.0%
Cap rate
0.6%
Rent to Value Ratio
Active
$499,000
3
bds
|
2
ba
|
1,430
sqft
|
built
1972
9182 Lantern Dr, Lake Worth, FL 33467
$-705
Cash flow
-7.4%
Cash-on-Cash Return
4.5%
Cap rate
0.6%
Rent to Value Ratio
Active
$769,900
4
bds
|
3
ba
|
2,515
sqft
|
built
2007
8921 Morgan Landing Way, Boynton Beach, FL 33473
$-1,759
Cash flow
-11.9%
Cash-on-Cash Return
3.4%
Cap rate
0.6%
Rent to Value Ratio
Active
$675,000
3
bds
|
3
ba
|
1,955
sqft
|
built
1979
1885 NW 9th St, Delray Beach, FL 33445
$-1,404
Cash flow
-10.9%
Cash-on-Cash Return
3.7%
Cap rate
0.7%
Rent to Value Ratio
Active
$905,000
3
bds
|
3
ba
|
2,038
sqft
|
built
2001
131 Rockingham Rd, Jupiter, FL 33458
$-2,209
Cash flow
-12.7%
Cash-on-Cash Return
3.2%
Cap rate
0.6%
Rent to Value Ratio
Active
$1,750,000
4
bds
|
4
ba
|
3,336
sqft
|
built
1983
4606 Gleneagles Dr, Boynton Beach, FL 33436
$-5,352
Cash flow
-16.0%
Cash-on-Cash Return
2.5%
Cap rate
0.4%
Rent to Value Ratio

Active
$520,000
4
bds
|
2
ba
|
1,582
sqft
|
built
1972
237 Porter Pl, West Palm Beach, FL 33409
$-1,106
Cash flow
-11.1%
Cash-on-Cash Return
3.6%
Cap rate
0.5%
Rent to Value Ratio
Active
$289,900
2
bds
|
2
ba
|
948
sqft
|
built
1989
1165 Crystal Way, Delray Beach, FL 33444
$-902
Cash flow
-16.2%
Cash-on-Cash Return
2.4%
Cap rate
0.8%
Rent to Value Ratio
Active
$1,420,000
6
bds
|
5
ba
|
3,477
sqft
|
built
2022
7619 Francisca Club Ln, Delray Beach, FL 33446
$-4,645
Cash flow
-17.1%
Cash-on-Cash Return
2.2%
Cap rate
0.5%
Rent to Value Ratio
Active
$799,999
2
bds
|
2
ba
|
1,170
sqft
|
built
1983
400 Ocean Trail Way, Jupiter, FL 33477
$-3,816
Cash flow
-24.9%
Cash-on-Cash Return
0.4%
Cap rate
0.5%
Rent to Value Ratio
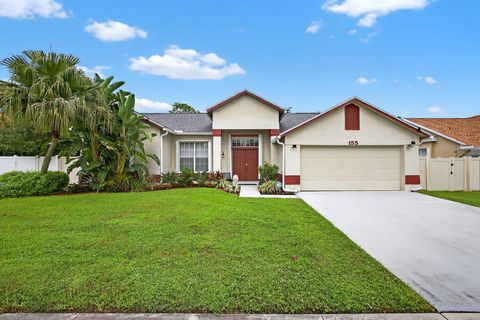
Active
$515,000
4
bds
|
2
ba
|
1,887
sqft
|
built
1989
155 Royal Pine Cir S, Royal Palm Beach, FL 33411
$-495
Cash flow
-5.0%
Cash-on-Cash Return
5.0%
Cap rate
0.7%
Rent to Value Ratio
Active
$779,000
2
bds
|
2
ba
|
1,739
sqft
|
built
1956
632 N Lakeside Dr, Lake Worth, FL 33460
$-981
Cash flow
-6.6%
Cash-on-Cash Return
4.6%
Cap rate
0.6%
Rent to Value Ratio