Palm Beach County Investment Properties for Sale
Browse homes for sale and investment properties in Palm Beach County. Refine your search by price, property type, or more.
Best cash flowing properties in Palm Beach County

Active
$775,000
4
bds
|
2
ba
|
2,282
sqft
|
built
1996
1871 Corsica Dr, West Palm Beach, FL 33414
$690
Cash flow
4.6%
Cash-on-Cash Return
7.2%
Cap rate
1.1%
Rent to Value Ratio
Active
$330,000
3
bds
|
2
ba
|
1,646
sqft
|
built
1978
4643 Holly Lake Dr, Lake Worth, FL 33463
$-68
Cash flow
-1.1%
Cash-on-Cash Return
5.9%
Cap rate
0.8%
Rent to Value Ratio
5,025 out of 6,088 properties for sale in Palm Beach County
Limited Results Shown
Create a free account, or log in to reveal all property listings and enjoy the complete experience.

Active
$3,798,000
5
bds
|
7
ba
|
5,393
sqft
|
built
2024
14823 Horseshoe Trce, Wellington, FL 33414
$-13,637
Cash flow
-18.7%
Cash-on-Cash Return
1.8%
Cap rate
0.3%
Rent to Value Ratio
Active
$219,900
2
bds
|
2
ba
|
1,115
sqft
|
built
1984
4695 Sable Pine Cir, West Palm Beach, FL 33417
$-502
Cash flow
-11.9%
Cash-on-Cash Return
3.4%
Cap rate
0.8%
Rent to Value Ratio

Active
$619,999
4
bds
|
3
ba
|
2,883
sqft
|
built
2005
8465 Alister Blvd W, Palm Beach Gardens, FL 33418
$-726
Cash flow
-6.1%
Cash-on-Cash Return
4.7%
Cap rate
0.7%
Rent to Value Ratio
Active
$320,000
3
bds
|
3
ba
|
1,488
sqft
|
built
1981
720 7th Ln, Greenacres, FL 33463
$-562
Cash flow
-9.2%
Cash-on-Cash Return
4.0%
Cap rate
0.8%
Rent to Value Ratio

Active
$867,000
5
bds
|
3
ba
|
3,303
sqft
|
built
2000
6584 Marbletree Ln, Lake Worth, FL 33467
$-1,892
Cash flow
-11.4%
Cash-on-Cash Return
3.5%
Cap rate
0.6%
Rent to Value Ratio

Active
$3,895,999
5
bds
|
4
ba
|
2,910
sqft
|
built
1930
138 Greymon Dr, West Palm Beach, FL 33405
$-14,103
Cash flow
-18.9%
Cash-on-Cash Return
1.8%
Cap rate
0.3%
Rent to Value Ratio

Active
$332,999
2
bds
|
2
ba
|
1,215
sqft
|
built
1989
9746 Nickels Blvd, Boynton Beach, FL 33436
$-990
Cash flow
-15.5%
Cash-on-Cash Return
2.6%
Cap rate
0.8%
Rent to Value Ratio

Active
$699,999
2
bds
|
2
ba
|
1,170
sqft
|
built
1983
400 Ocean Trail Way, Jupiter, FL 33477
$-2,856
Cash flow
-21.3%
Cash-on-Cash Return
1.3%
Cap rate
0.6%
Rent to Value Ratio
Active
$449,000
3
bds
|
3
ba
|
1,680
sqft
|
built
1997
7823 Springfield Lake Dr, Lake Worth, FL 33467
$-697
Cash flow
-8.1%
Cash-on-Cash Return
4.3%
Cap rate
0.7%
Rent to Value Ratio

Active
$849,000
2
bds
|
2
ba
|
1,247
sqft
|
built
1971
630 Ocean Dr, Juno Beach, FL 33408
$-2,124
Cash flow
-13.1%
Cash-on-Cash Return
3.1%
Cap rate
0.7%
Rent to Value Ratio

Active
$499,000
2
bds
|
2
ba
|
1,400
sqft
|
built
1974
5440 N Ocean Dr, Riviera Beach, FL 33404
$-2,117
Cash flow
-22.1%
Cash-on-Cash Return
1.1%
Cap rate
0.7%
Rent to Value Ratio

Active
$460,000
3
bds
|
2
ba
|
1,453
sqft
|
built
1992
175 Harbor Lake Cir, Greenacres, FL 33413
$-1,189
Cash flow
-13.5%
Cash-on-Cash Return
3.0%
Cap rate
0.7%
Rent to Value Ratio

Active
$685,000
2
bds
|
2
ba
|
1,438
sqft
|
built
1988
4201 N Ocean Blvd, Boca Raton, FL 33431
$-3,064
Cash flow
-23.3%
Cash-on-Cash Return
0.8%
Cap rate
0.7%
Rent to Value Ratio
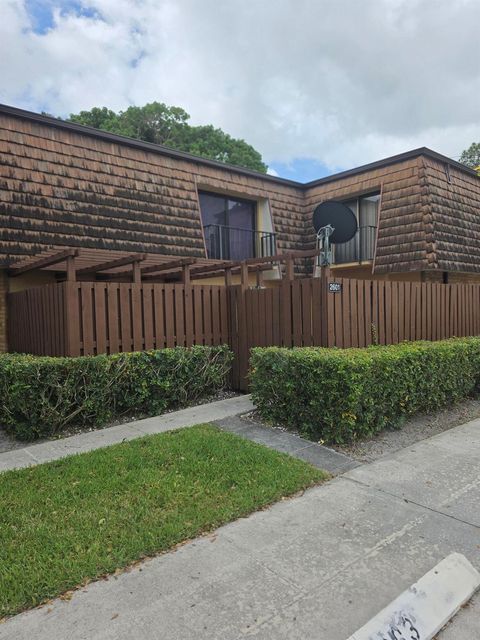
Active
$350,000
3
bds
|
3
ba
|
1,488
sqft
|
built
1982
2601 26th Ln, Greenacres, FL 33463
$-878
Cash flow
-13.1%
Cash-on-Cash Return
3.1%
Cap rate
0.7%
Rent to Value Ratio
Active
$3,537,500
5
bds
|
6
ba
|
4,263
sqft
|
built
2006
260 NE Wavecrest Ct, Boca Raton, FL 33432
$-15,025
Cash flow
-22.2%
Cash-on-Cash Return
1.1%
Cap rate
0.3%
Rent to Value Ratio

Active
$697,000
3
bds
|
2
ba
|
1,263
sqft
|
built
1961
2701 SW 4th St, Boynton Beach, FL 33435
$-2,031
Cash flow
-15.2%
Cash-on-Cash Return
2.6%
Cap rate
0.5%
Rent to Value Ratio

Active
$599,999
2
bds
|
2
ba
|
1,513
sqft
|
built
1998
4411 Sunset Cay Cir, Boynton Beach, FL 33436
$-1,532
Cash flow
-13.3%
Cash-on-Cash Return
3.1%
Cap rate
0.6%
Rent to Value Ratio
Active
$175,000
2
bds
|
2
ba
|
1,007
sqft
|
built
1985
2259 Linton Ridge Cir, Delray Beach, FL 33444
$-210
Cash flow
-6.3%
Cash-on-Cash Return
4.7%
Cap rate
1.1%
Rent to Value Ratio
Active
$2,999,999
4
bds
|
3
ba
|
2,657
sqft
|
built
1978
940 Turner Quay, Jupiter, FL 33458
$-9,756
Cash flow
-17.0%
Cash-on-Cash Return
2.2%
Cap rate
0.3%
Rent to Value Ratio

Active
$699,900
5
bds
|
4
ba
|
2,796
sqft
|
built
2007
9161 Dupont Pl, Wellington, FL 33414
$-1,569
Cash flow
-11.7%
Cash-on-Cash Return
3.5%
Cap rate
0.6%
Rent to Value Ratio

Active
$998,000
5
bds
|
5
ba
|
3,350
sqft
|
built
2003
3571 Birague Dr, Wellington, FL 33449
$-2,747
Cash flow
-14.4%
Cash-on-Cash Return
2.8%
Cap rate
0.5%
Rent to Value Ratio

Active
$1,324,900
2
bds
|
2
ba
|
1,630
sqft
|
built
1988
120 SE 5th Ave, Boca Raton, FL 33432
$-6,292
Cash flow
-24.8%
Cash-on-Cash Return
0.4%
Cap rate
0.5%
Rent to Value Ratio

Active
$1,650,000
3
bds
|
3
ba
|
1,652
sqft
|
built
1981
11669 Wimbledon Cir, Wellington, FL 33414
$-4,379
Cash flow
-13.8%
Cash-on-Cash Return
3.0%
Cap rate
0.6%
Rent to Value Ratio
Active
$1,195,000
5
bds
|
4
ba
|
3,156
sqft
|
built
1993
11777 Island Lakes Ln, Boca Raton, FL 33498
$-1,286
Cash flow
-5.6%
Cash-on-Cash Return
4.9%
Cap rate
0.7%
Rent to Value Ratio

Active
$415,000
3
bds
|
3
ba
|
2,084
sqft
|
built
1987
11905 Donlin Dr, Wellington, FL 33414
$-771
Cash flow
-9.7%
Cash-on-Cash Return
3.9%
Cap rate
0.7%
Rent to Value Ratio
Active
$2,850,000
2
bds
|
3
ba
|
2,156
sqft
|
built
1985
1400 S Ocean Blvd, Boca Raton, FL 33432
$-15,514
Cash flow
-28.4%
Cash-on-Cash Return
-0.4%
Cap rate
0.3%
Rent to Value Ratio

Active
$849,900
4
bds
|
4
ba
|
2,435
sqft
|
built
1983
6945 150th Pl N, West Palm Beach, FL 33418
$-1,790
Cash flow
-11.0%
Cash-on-Cash Return
3.6%
Cap rate
0.6%
Rent to Value Ratio

Active
$337,000
2
bds
|
3
ba
|
1,264
sqft
|
built
1986
404 Live Oak Ln, Boynton Beach, FL 33436
$-943
Cash flow
-14.6%
Cash-on-Cash Return
2.8%
Cap rate
0.7%
Rent to Value Ratio

Active
$3,949,000
4
bds
|
4
ba
|
3,018
sqft
|
built
2000
761 Ocean Dr, Juno Beach, FL 33408
$-17,259
Cash flow
-22.8%
Cash-on-Cash Return
0.9%
Cap rate
0.3%
Rent to Value Ratio
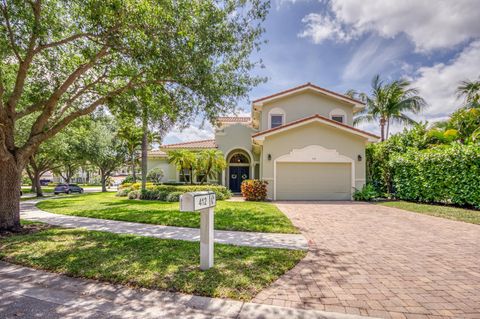
Active
$1,289,990
4
bds
|
4
ba
|
3,308
sqft
|
built
2007
412 Meadowlark Dr, Jupiter, FL 33458
$-1,543
Cash flow
-6.2%
Cash-on-Cash Return
4.7%
Cap rate
0.7%
Rent to Value Ratio
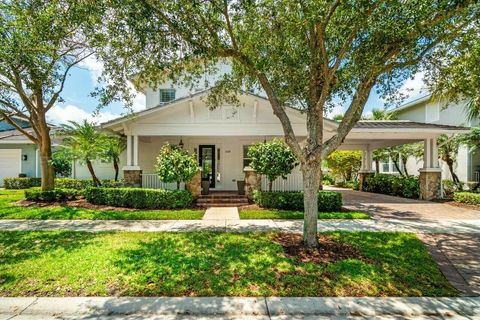
Active
$1,575,000
4
bds
|
4
ba
|
2,421
sqft
|
built
2013
2724 Wymberly Dr, Jupiter, FL 33458
$-3,995
Cash flow
-13.2%
Cash-on-Cash Return
3.1%
Cap rate
0.6%
Rent to Value Ratio
Active
$479,000
3
bds
|
2
ba
|
1,347
sqft
|
built
1990
17262 Boca Club Blvd, Boca Raton, FL 33487
$-1,385
Cash flow
-15.1%
Cash-on-Cash Return
2.7%
Cap rate
0.7%
Rent to Value Ratio

Active
$1,375,000
5
bds
|
7
ba
|
5,415
sqft
|
built
2012
2376 Merriweather Way, Wellington, FL 33414
$-4,259
Cash flow
-16.2%
Cash-on-Cash Return
2.4%
Cap rate
0.5%
Rent to Value Ratio
Active
$3,299,000
3
bds
|
4
ba
|
2,825
sqft
|
built
2014
270 Mercury Cir, Juno Beach, FL 33408
$-12,274
Cash flow
-19.4%
Cash-on-Cash Return
1.7%
Cap rate
0.3%
Rent to Value Ratio
Active
$295,000
2
bds
|
3
ba
|
1,260
sqft
|
built
1988
1506 Wharf Ln, Greenacres, FL 33463
$-646
Cash flow
-11.4%
Cash-on-Cash Return
3.5%
Cap rate
0.8%
Rent to Value Ratio
Active
$250,000
2
bds
|
2
ba
|
1,447
sqft
|
built
1985
7472 La Paz Blvd, Boca Raton, FL 33433
$-603
Cash flow
-12.6%
Cash-on-Cash Return
3.3%
Cap rate
1.1%
Rent to Value Ratio

Active
$1,899,000
3
bds
|
4
ba
|
2,938
sqft
|
built
2006
112 Dalena Way, Palm Beach Gardens, FL 33418
$-6,294
Cash flow
-17.3%
Cash-on-Cash Return
2.2%
Cap rate
0.5%
Rent to Value Ratio

Active
$4,599,000
4
bds
|
5
ba
|
4,617
sqft
|
built
2000
5784 Vintage Oaks Cir, Delray Beach, FL 33484
$-17,599
Cash flow
-20.0%
Cash-on-Cash Return
1.6%
Cap rate
0.2%
Rent to Value Ratio